HAL Id: ensl-00768160
https://hal-ens-lyon.archives-ouvertes.fr/ensl-00768160
Submitted on 20 Dec 2012HAL is a multi-disciplinary open access
archive for the deposit and dissemination of sci-entific research documents, whether they are pub-lished or not. The documents may come from teaching and research institutions in France or abroad, or from public or private research centers.
L’archive ouverte pluridisciplinaire HAL, est destinée au dépôt et à la diffusion de documents scientifiques de niveau recherche, publiés ou non, émanant des établissements d’enseignement et de recherche français ou étrangers, des laboratoires publics ou privés.
the atmospheres of substellar objects
Bernd Freytag, France Allard, Derek Homeier, Hans-Günter Ludwig, Matthias
Steffen
To cite this version:
Bernd Freytag, France Allard, Derek Homeier, Hans-Günter Ludwig, Matthias Steffen. Radiation hydrodynamics simulations of dust clouds in the atmospheres of substellar objects. ASP Conference series, 2011, 450, pp.125. �ensl-00768160�
**FULL TITLE**
ASP Conference Series, Vol. **VOLUME**, **YEAR OF PUBLICATION** **NAMES OF EDITORS**
Radiation hydrodynamics simulations of dust clouds in the atmospheres of substellar objects
Bernd Freytag and France Allard
Centre de Recherche Astrophysique de Lyon, UMR 5574: CNRS, Universit´e de Lyon, ´Ecole Normale Sup´erieure de Lyon, 46 all´ee d’Italie, F-69364 Lyon Cedex 07, France
Derek Homeier
Institut f¨ur Astrophysik G¨ottingen, Georg-August-Universit¨at, Friedrich-Hund-Platz 1, D-37077 G¨ottingen, Germany
Hans-G¨unter Ludwig
Observatoire de Paris-Meudon, GEPI-CIFIST, 92195 Meudon, France
Matthias Steffen
Astrophysikalisches Institut Potsdam, An der Sternwarte 16, D-14482 Potsdam, Germany
Abstract. The temperature structure and the motions in the atmospheres of cool stars are affected by the underlying convection zone. The radiation hy-drodynamics code CO5BOLD has been developed to simulate (small patches of the) convective surface layers of these stars. Updated opacity tables based on PHOENIX data and a description for the formation, destruction, advective transport, and settling of dust have made the code fit to handle the conditions in brown dwarf atmospheres. Currently, objects from 8500K down to about 900K have been simulated. Recently, incident radiation has been included, allow-ing simulations with conditions found on hot planets. In non-irradiated brown dwarf models we encounter mixing by gravity waves and in the cooler models convection within the clouds. The qualitative effects of incident radiation are surprisingly small, as long as the effective temperature of the object stays well below the dust condensation temperature. Beyond that point, there are no layers where dust could form, anymore.
1. Introduction
Temperatures in the atmospheres of late type M dwarf stars and brown dwarfs are so low that dust particles can form (Tgas < 1800K). These grains should sink under the influence of gravity into deeper layers and vanish from the at-mosphere, clearing it from condensable material. However, observed spectra can only be reproduced by models accounting for dust formation and its result-ing greenhouse effect in the visible layers (Tsuji et al. 1996; Leggett et al. 1998). The approaches to model dust within classical 1D hydrostatic stellar atmosphere models presented in Helling et al. (2008) differ considerably, and all rely on not
well justified assumptions about the extent of the cloud layers or the amount of mixing.
On candidate to cause mixing is surface convection that influences the strat-ification in various ways: Convective energy transport leads to a change in the mean temperature structure but also to spatial and temporal fluctuations in the temperature field, with implications for the formation of molecules (see e.g. Wedemeyer-B¨ohm et al. 2005). Velocity fields affect shapes of spectral lines, are able to mix material, and can transport wave energy. Moreover, the correct description of the surface convection zone is necessary for detailed models of the interior of stellar or sub-stellar objects.
Time-dependent radiation hydrodynamics (RHD) models can describe self-consistently the mixing of material beyond the classical boundaries of a convec-tion zone, as demonstrated for instance for main-sequence A-type stars (Freytag et al. 1996) or for M dwarfs (Ludwig et al. 2002, 2006). The aim of the current project is to extend the latter simulations into the regime of brown dwarfs and hot planets, where dust clouds have a strong influence onto the photospheric temperature structure.
2. Simulations with CO5BOLD
2.1. Numerical radiation hydrodynamics
We used the radiation-hydrodynamics code CO5BOLD in the local setup (see Freytag et al. 2002; Wedemeyer et al. 2004; Freytag et al. 2004) to calculate time-dependent 2D models of the atmospheres of sub-stellar objects, including the very top layers of the convection zone. The restriction to two dimensions, so far, arises from the need to cover the extremely long settling and mixing time scales of dust and monomers. The code solves the coupled equations of compressible hydrodynamics and non-local radiation transport on a Cartesian grid with a time-explicit scheme. The tabulated equation of state account for the ionization of hydrogen and helium, and the formation of H2 molecules.
The 1D hydrodynamics fluxes are computed with an approximate Riemann solver of Roe-type and combined unsplit, i.e. the fluxes in vertical and horizontal direction are computed from the same state (and not after each other) and their contributions are added, because the conditions in the cool objects are almost incompressible.
Usually, we use open top and bottom boundary conditions for local mod-els that comprise the upper part of a deep convection zone. However, closed boundaries keep the amount of dust constant within the computational domain and are employed for all the brown dwarf models. I.e., the lower boundary is closed although the stellar convection zone should extend down to the center of the star. To keep the entropy close to a prescribed value, the internal en-ergy in a few grid layers (10 km heigh) at the bottom of the model is adjusted. This mechanism acts as an energy source and replenishes the radiative energy losses through the top of the model. This parameter (the value of the entropy plateau sinin the deep convective layers) controles the effective temperature and is taken from the start model. In addition, a drag force damps downdrafts in these layers.
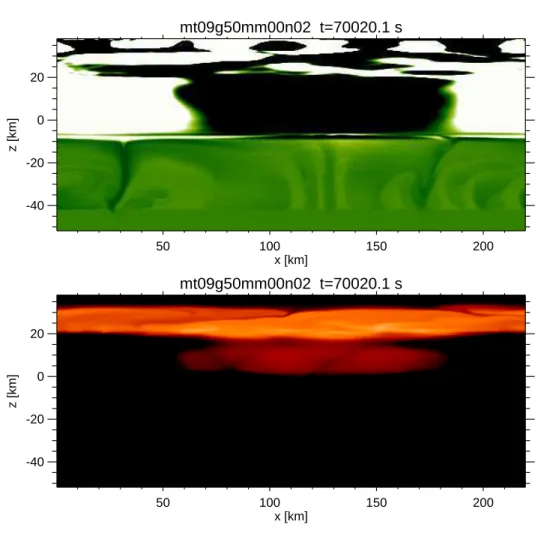
RHD simulations of dust clouds 3 mt09g50mm00n02 t=70020.1 s 50 100 150 200 x [km] -40 -20 0 20 z [km] mt09g50mm00n02 t=70020.1 s 50 100 150 200 x [km] -40 -20 0 20 z [km]
Figure 1. Entropy fluctuations (top panel; bright color indicates material hotter than the surroundings) and dust concentration (bottom panel; the bright band at the top is the dust), without irradiation. Teff=900 K, logg=5.
The top boundary is closed, too, partly to keep material inside. It has damp-ing zone of about 8 grid points where a strong drag force is applied. Dampdamp-ing just at an open boundary appeared to be not sufficient to keep under control gravity waves with moderate Mach number (with peak values close to 1) but large vertical gradients due to the occurrence of waves with small vertical wave-length.
Incident radiation along the vertical ray is described by two parame-ters: the effective temperature of a black body Teff,inci and a dilution factor (Rstar/dstar−planet)2.
2.2. Dust model
To account for the presence of dust we added terms in the modules for hydro-dynamics, radiation transport, source terms, and in the handling of boundary conditions.
It is impossible to account for all microphysical processes that might play a role for dust formation in current time-dependent multi-dimensional simulations. Instead, we chose a treatment of dust that includes only the most basic – and hopefully the most important – ingredients.
We concentrate on Forsterite grains (Mg2SiO4, 3.3 g/cm3) that are relatively abundant and give the largest contribution to the total dust opacities. The dust scheme is based on a simplified version of the dust model used in H¨ofner et al. (2003): one density field (instead of four as in H¨ofner et al. 2003 and Freytag & H¨ofner 2008) describes the amount of dust, the other the amount of “monomers”. The ratio of dust plus monomers density over gas density is allowed to change, in contrast to the dust description by H¨ofner et al. (2003).
Instead of modelling the nucleation and the detailed evolution of the number of grains we assume a constant fraction of seeds in the total amount of dust and monomers. Would all material in a grid cell be condensed into dust, the grains would have the maximum radius rd,max, which is an external parameter and is set typically to 1 µm. The radius rdof dust grains for given dust mass density ρd and monomer mass density ρm is computed from rd= rd,max[ρd/(ρd+ ρm)]1/3. Condensation and evaporation are modelled as in H¨ofner et al. (2003), with parameters and saturation vapor curve adapted to Forsterite.
In the hydrodynamics module, monomers and dust densities are advected together with the gas density. However, a settling speed according to Rossow (1978) is added to the vertical advection velocity of the dust grains, assuming instantaneous equilibrium between gravitational and viscous force that act onto the grains.
For RHD models of cool stars we usually assume a complete mixture of the atmosphere and the same element composition everywhere in the model. CO5BOLD can deal with the effects of ionization but not with a variation of el-ement composition with space and time. Therefore, the depletion of elel-ements is completely ignored in the equation of state: anyway, the formation of molecules has only a minor effect on e.g. the heat capacity as long as hydrogen exists in the form of H2. However, molecules play a major role for the opacity. And the formation of molecules depends on the abundance and depletion of elements. To take this partially into account we derive the CO5BOLD opacity table from a data cube with κ(T, P, ν) generated with the PHOENIX atmosphere code (Fer-guson et al. 2005), since gas phase opacity calculations are too prohibitive for a dynamical account in hydro simulations. For this application we find the limiting Cond case a priori most suitable, i.e. dust condensation in equilibrium with the gas phase while ignoring dust opacities so as to reproduce an efficient sedimenta-tion case. The resulting gas phase opacities are depleted from refractory element contributions in the proportion predicted by chemical equilibrium in layers were conditions favor dust formation, and not depleted in inner atmospheric layers where gas is too hot for dust formation. This choice allows for an as adequate as possible account of gas phase opacities in the innermost atmospheric layers where dust does not form, as well as in the dust forming layers. Dust opacities are included dynamically. The detailed gas opacities are averaged into 5 bins to account for non-grey effects. In contrast to the sophisticated treatment of the gas opacities, we use a simple formula for the dust opacities, assuming that
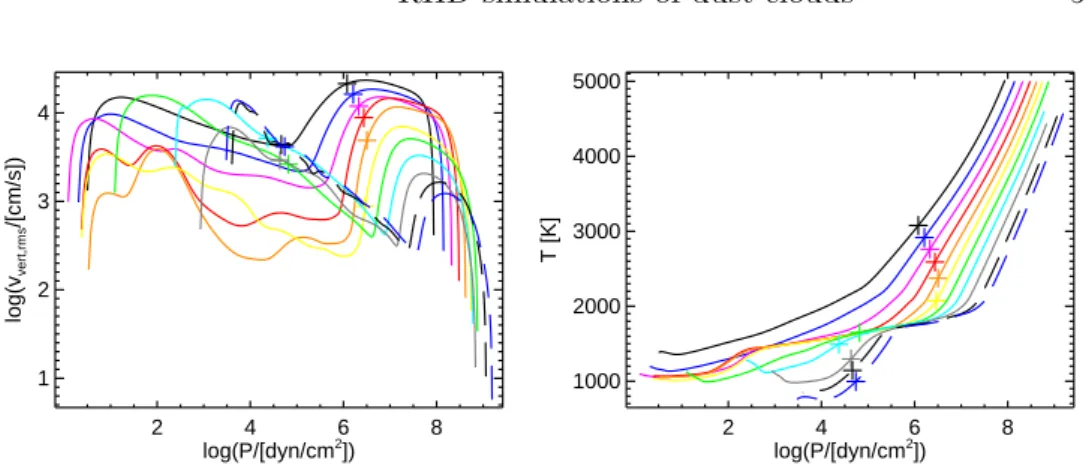
RHD simulations of dust clouds 5 2 4 6 8 log(P/[dyn/cm2 ]) 1 2 3 4 log(v vert,rms /[cm/s]) 2 4 6 8 log(P/[dyn/cm2 ]) 1000 2000 3000 4000 5000 T [K]
Figure 2. Logarithm of rms-value of vertical velocity (left) and mean tem-perature (right) over logarithm of pressure for models with effective tempera-tures (from top to bottom at the right part of both plots) of 2800 K, 2600 K, 2400 K, 2200 K, 2000 K, 1800 K, 1600 K, 1400 K, 1200 K, 1000 K, 900 K. Plus signs indicate the points where the Rosseland optical depths reaches unity.
the large particle limit is valid for all grain sizes and treating scattering as true absorption.
3. Results of the simulations 3.1. Temperature sequence
We present a temperature sequence of non-irradiated models reaching from cool M dwarfs to cool brown dwarfs (Teff=2800 K to 900 K; logg=5) demonstrating the contributions of different mixing processes.
The top panel in Fig. 1 shows the typical granulation pattern with cool downdrafts even narrower than in solar granulation (Ludwig et al. 2002, 2006) in a warmer environment. There is a thin transition layer to the stable atmo-sphere with strong inhomogeneities induced by gravity waves. Figure 1(bottom) indicates the location of the actual dust clouds and shows their spatial variations due to gravity waves and convection within the clouds.
The bump on the plot of the rms-value of the vertical velocity over the logarithm of pressure in Fig. 2(left) is due to convective motions. The wiggly increase with decreasing pressure (to the left) is mostly due to gravity waves. While the amplitude of the convection in the deeper layers decreases monoton-ically with effective temperature, the wave amplitudes show a more complex temperature dependence.
The plot of the temperature over the logarithm of pressure in Fig. 2(right) shows the effect of the dust onto the stratification for models of 2400 K and below: within the clouds the temperature drops rapidly, while below the cloud deck the greenhouse effect causes a temperature plateau with a fairly shallow slope.
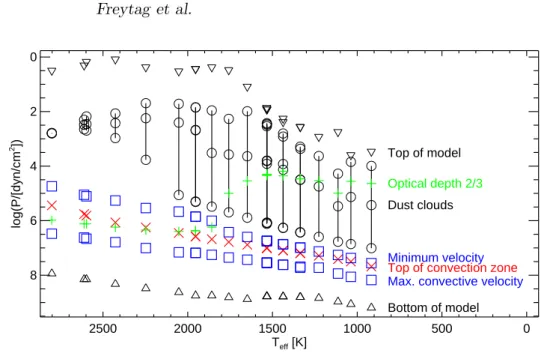
Figure 3 shows the position of the clouds relative to the convection zone for the entire temperature sequences covered by the models. At higher effective temperatures one can just see through the thin cloud layers right into the top
2500 2000 1500 1000 500 0 Teff [K] 8 6 4 2 0 log(P/[dyn/cm 2 ])
Top of convection zone
Top of model
Bottom of model Dust clouds
Max. convective velocity Minimum velocity
Optical depth 2/3
Figure 3. Logarithm of pressure over effective temperature for various points of interest: black triangles: top and bottom of each model, red crosses: top of convectively unstable layers, lower set of blue squares: point withy maximum convective velocity vvert,rms, black circles: location of cloud layers,
green plus signs: layers with τRosseland=2/3.
of the convection zone. A intermediate temperatures the clouds become thicker and opaque. At lower effective temperatures most of the dust sits below the visible layers which are less affected by it.
3.2. Sequences with different amounts of irradiation
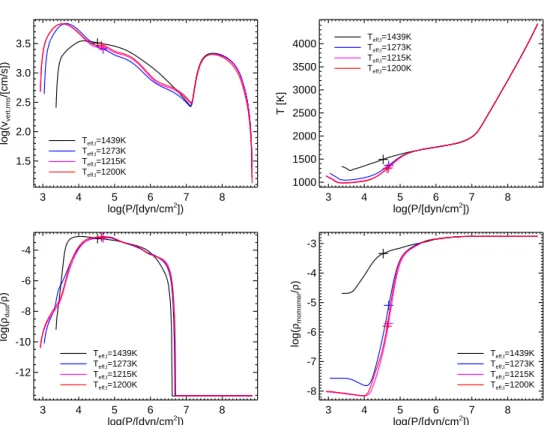
We varied the incident radiation for models with two different internal effective temperatures (Teff=1200 K and 900 K), resulting in a models with various total effective temperature Teff,t, as indicated in the plots.
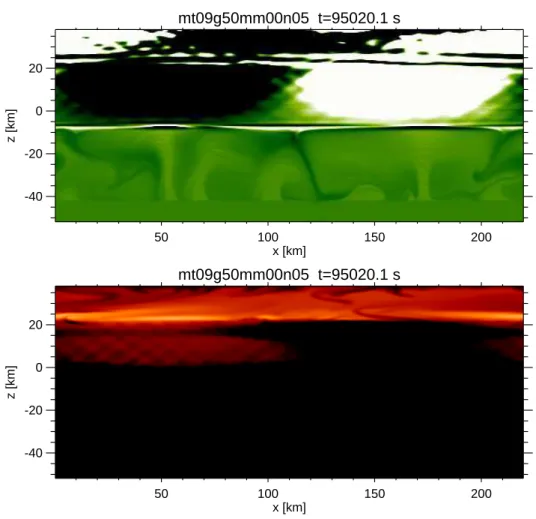
We started with small amounts of irradiation being afraid that a significant flux entering the model at the top would somehow impede the convection and alter the entire structure. However, small amount of incident flux have a small effect (compare Figs. 1 and 4) essentially restricted to the upper atmospheric layers only. As seen in the top right panels in Fig. 6 and Fig. 7 the temperature rises slightly above and at the top of the cloud layers until the effective temper-ature is sufficient to emit the flux coming from below as well as the irradiated flux. There is only little effect onto the velocities (top left panels in Figs. 6 and 7) and the dust concentration decreases only slightly (bottom left panels), as also observed with Phoenix Dusty models (Barman et al. 2001). The decrease in dust leads to a decrease in the monomer depletion (bottom right panels).
In contrast, the irradiation in the CoRoT-3b case (model with Teff,t=1735 K in Fig. 7) is sufficient to raise the temperature to levels where essentially no (Forsterite) dust can form and the corresponding monomers show little deple-tion. We find however a dust haze forming close to the top. The velocity
RHD simulations of dust clouds 7 mt09g50mm00n05 t=95020.1 s 50 100 150 200 x [km] -40 -20 0 20 z [km] mt09g50mm00n05 t=95020.1 s 50 100 150 200 x [km] -40 -20 0 20 z [km]
Figure 4. Entropy fluctuations and dust concentration for model with small amounts of irradiation: logg=5, Teff=900 K, Teff,t=1276 K.
mt09g50mm00n06 t=95020.0 s 50 100 150 200 x [km] -40 -20 0 20 z [km]
Figure 5. Entropy fluctuations for model with strong irradiation. logg=5, Teff=900 K, Teff,t=1735 K.
3 4 5 6 7 8 log(P/[dyn/cm2 ]) 1.5 2.0 2.5 3.0 3.5 log(v vert,rms /[cm/s]) Teff,t=1439K Teff,t=1273K Teff,t=1215K Teff,t=1200K 3 4 5 6 7 8 log(P/[dyn/cm2 ]) 1000 1500 2000 2500 3000 3500 4000 T [K] Teff,t=1439K Teff,t=1273K Teff,t=1215K Teff,t=1200K 3 4 5 6 7 8 log(P/[dyn/cm2 ]) -12 -10 -8 -6 -4 log( ρdust / ρ ) Teff,t=1439K Teff,t=1273K Teff,t=1215K Teff,t=1200K 3 4 5 6 7 8 log(P/[dyn/cm2 ]) -8 -7 -6 -5 -4 -3 log( ρmomomer / ρ ) Teff,t=1439K Teff,t=1273K Teff,t=1215K Teff,t=1200K
Figure 6. Logarithm of rms-value of vertical velocity (top left), mean tem-perature (top right), dust concentration (bottom left), and monomer concen-tration (bottom right) over logarithm of pressure for models with different amount of irradiation. The internal effective temperature is of about 1200 K. Gravity logg=5.
RHD simulations of dust clouds 9 4 5 6 7 8 9 log(P/[dyn/cm2 ]) 1 2 3 4 log(v vert,rms /[cm/s]) Teff,t=1735K Teff,t=1276K Teff,t=1072K Teff,t=967K Teff,t=900K 4 5 6 7 8 9 log(P/[dyn/cm2 ]) 1000 2000 3000 4000 T [K] Teff,t=1735K Teff,t=1276K Teff,t=1072K Teff,t=967K Teff,t=900K 4 5 6 7 8 9 log(P/[dyn/cm2 ]) -14 -12 -10 -8 -6 -4 log( ρdust / ρ ) Teff,t=1735K Teff,t=1276K Teff,t=1072K Teff,t=967K Teff,t=900K 4 5 6 7 8 9 log(P/[dyn/cm2 ]) -16 -14 -12 -10 -8 -6 -4 log( ρmomomer / ρ ) Teff,t=1735K Teff,t=1276K Teff,t=1072K Teff,t=967K Teff,t=900K
Figure 7. Logarithm of rms-value of vertical velocity (top left), mean tem-perature (top right), dust concentration (bottom left), and monomer concen-tration (bottom right) over logarithm of pressure for models with different amount of irradiation. The internal effective temperature is of about 900 K. Gravity logg=5.
amplitude shows little change. The remaining atmospheric motions are purely due to gravity waves (cf. Fig. 5).
4. Conclusions
The presented 2D radiation hydrodynamical atmosphere models of substellar ob-jects show that overshoot velocities decline roughly exponentially with distance from the convectively unstable regions, as found previously in e.g. A-type and M-type dwarfs. However, the velocities drop so steeply that they are only impor-tant close to the convection zone. Instead, gravity waves dominate the mixing of the upper atmospheric layers with amplitudes even growing with height, modu-lating dust concentration and cloud thickness. At effective temperatures below about 2000 K, dust layers become thick enough to cause convection within the clouds. The induced combined mixing is sufficient to balance the settling of dust grains.
Models with higher effective temperatures show a high-altitude haze of op-tically thin clouds. At lower effective temperatures thick and dense clouds exist but mostly below the visible layers, that are essentially depleted of the material that went into the dust. In between, dust is an important opacity source in the atmosphere.
Incident radiation mainly affects the temperature of the uppermost atmo-spheric layers. Small amounts of irradiation (corresponding to orbital distances beyond about 0.05 AU for a solar type star host) have no qualitative effect onto the cloud dynamics, causing only a small rise of the temperatures at the top and above the clouds, which leads to some decrease of the dust concentration.
Nevertheless, when irradiation heats up the atmosphere too much, as is the case for CoRoT-3b at 0.055 AU from an F star host, dust cloud formation and with it cloud convection is suppressed, except perhaps in the planetary limb i.e. a dust haze in the uppermost layers. But gravity waves induced by the lower convection zone remain.
References
Barman, T. S., Hauschildt, P. H., & Allard, F. 2001, ApJ, 556, 885 Ferguson, J. W., Alexander, D. R., Allard, F., et al. 2005, ApJ, 623, 585 Freytag, B. & H¨ofner, S. 2008, A&A, 483, 571
Freytag, B., Ludwig, H.-G., & Steffen, M. 1996, A&A, 313, 497
Freytag, B., Steffen, M., & Dorch, B. 2002, Astronomische Nachrichten, 323, 213 Freytag, B., Steffen, M., Wedemeyer-B¨ohm, S., & Ludwig, H.-G. 2004, CO5BOLD User
Manual, http://www.astro.uu.se/~bf/co5bold_main.html Helling, C., Ackerman, A., Allard, F., et al. 2008, MNRAS, 1310
H¨ofner, S., Gautschy-Loidl, R., Aringer, B., & Jørgensen, U. G. 2003, A&A, 399, 589 Leggett, S. K., Allard, F., & Hauschildt, P. H. 1998, ApJ, 509, 836
Ludwig, H.-G., Allard, F., & Hauschildt, P. H. 2002, A&A, 395, 99 Ludwig, H.-G., Allard, F., & Hauschildt, P. H. 2006, A&A, 459, 599 Rossow, W. B. 1978, Icarus, 36, 1
Tsuji, T., Ohnaka, K., & Aoki, W. 1996, A&A, 305, L1+
Wedemeyer, S., Freytag, B., Steffen, M., Ludwig, H.-G., & Holweger, H. 2004, A&A, 414, 1121