DOI: 10.1212/01.wnl.0000316391.40236.c3
2008;71;44-49
Neurology
and M. Lambert
F. Ramos, N. M. Verhoeven, E. Struys, H. J. Blom, C. Jakobs, E. Levy, G. A. Mitchell
F. -G. Debray, Y. Boulanger, A. Khiat, J. -C. Decarie, J. Orquin, M. -S. Roy, A. Lortie,
Reduced brain choline in homocystinuria due to remethylation defects
This information is current as of January 30, 2009
http://www.neurology.org/cgi/content/full/71/1/44
located on the World Wide Web at:
The online version of this article, along with updated information and services, is
All rights reserved. Print ISSN: 0028-3878. Online ISSN: 1526-632X.
since 1951, it is now a weekly with 48 issues per year. Copyright © 2008 by AAN Enterprises, Inc.
® is the official journal of the American Academy of Neurology. Published continuously
Neurology
at UNIV MEDECINE LEIG 22827242 on January 30, 2009
www.neurology.org
Reduced brain choline in homocystinuria
due to remethylation defects
F.-G. Debray, MD
Y. Boulanger, PhD
A. Khiat, PhD
J.-C. Decarie, MD
J. Orquin, MD
M.-S. Roy, PhD
A. Lortie, MD
F. Ramos, MSc
N.M. Verhoeven, PhD
E. Struys, PhD
H.J. Blom, PhD
C. Jakobs, PhD
E. Levy, MD, PhD
G.A. Mitchell, MD
M. Lambert, MD
ABSTRACTObjective:
To investigate whether secondary impairment of the transmethylation pathway is a mech-anism underlying the neurologic involvement in homocystinuria due to remethylation defects.Methods:
Twelve patients with neurologic disease due to remethylation defects were examined by brain magnetic resonance spectroscopic imaging (1H MRSI). Brain N-acetylaspartate,choline-containing compounds (Cho), and creatine (Cr) were quantified and compared to with controls. Metab-olites of remethylation cycle and creatine biosynthesis pathway were measured in plasma and urine.
Results:
MRSI revealed isolated Cho deficiency in all regions examined (mean concentration units ⫾ SD, patients vs controls): frontal white matter (0.051 ⫾ 0.010 vs 0.064 ⫾ 0.010; p ⫽ 0.001), lenticular nucleus (0.056⫾ 0.011 vs 0.069 ⫾ 0.009; p ⬍ 0.001), and thalamus (0.063 ⫾ 0.010 vs 0.071⫾ 0.007; p ⫽ 0.006). In contrast to controls, the Cho/Cr ratio decreased with age in patients in the three brain regions examined. Low creatine urinary excretion (p⬍ 0.005), normal urine and plasma guanidinoacetate, and a paradoxical increase in plasma S-adenosylmethionine (p⬍ 0.005) concentrations were observed.Conclusion:
Patients with homocystinuria due to remethylation defects have an isolated brain choline deficiency, probably secondary to depletion of labile methyl groups produced by the trans-methylation pathway. Although biochemical studies suggest mild peripheral creatine deficiency, brain creatine is in the reference range, indicating a possible compartmentation phenomenon. Paradoxical increase of S-adenosylmethionine suggests that secondary inhibition of methylases contributes to the transmethylation defect in these conditions.Neurology®2008;71:44–49GLOSSARY
CblC⫽ combined homocystinuria–methylmalonic aciduria; CblG ⫽ methionine synthase deficiency; CBS ⫽ cystathionine -synthase; Cho ⫽ water-soluble choline-containing compounds; Cr ⫽ creatine; DQ ⫽ developmental quotient; Met ⫽ plasma methionine; MR⫽ magnetic resonance; MSRI ⫽ magnetic resonance spectroscopic imaging; MTHFR ⫽ methylene tetrahy-drofolate reductase; NA⫽ not available; NAA ⫽ N-acetylaspartate; NN ⫽ neonatal; NS ⫽ not significant; OA ⫽ optic atrophy;
OMA⫽ oculomotor apraxia; OMIM ⫽ Online Mendelian Inheritance in Man; PM ⫽ pigmentary maculopathy; Pt ⫽ patient; RD ⫽ remethylation defect; RP⫽ retinitis pigmentosa; tHcy ⫽ plasma total homocysteine; THF ⫽ tetrahydrofolate.
Homocystinuria due to remethylation defects (RD) is a group of inherited metabolic diseases
characterized by chronic and progressive neurologic impairement.
1In contrast to
homocystin-uria due to cystathionine

-synthase (CBS) deficiency, plasma methionine concentration is low
in RD, and there is neither skeletal involvement nor ectopia lentis. Despite treatments effective
in reducing plasma homocysteine level, the neurologic outcome in RD is often poor.
2,3From a metabolic point of view, the methionine– homocysteine cycle is a carrier of activated
methyl group taking part in the transmethylation pathway (figure 1).
1Labile methyl groups are
provided by dietary methionine, glycine, serine, betaine, and choline. They are also produced
endo-genously through the folate cycle by methylenetetrahydrofolate reductase (MTHFR) in the form of
5= methyltetrahydrofolate (figure 1, step A), and transferred to homocysteine to produce
methio-nine (step B). This last step is formally called remethylation pathway. The activated form of
methi-onine, S-adenosylmethionine (AdoMet), is the methyl donor for many important biosynthetic
From the Divisions of Medical Genetics (F.-G.D., G.A.M., M.L.) and Neurology (A.L.), Department of Pediatrics; Departments of Medical Imaging (J.-C.D.), Ophthalmology (J.O., M.-S.R.), Psychology (F.R.), and Nutrition (E.L.), University of Montreal and Ste-Justine Hospital, Montreal, Quebec, Canada; Department of Radiology (Y.B., A.K.), University of Montreal and Hoˆpital Saint-Luc, Montreal, Quebec, Canada; and Metabolic Unit (N.M.V., E.S., H.J.B., C.J.), Department of Clinical Chemistry, VU University Medical Center, Amsterdam, The Netherlands.
Disclosure: The authors report no disclosures.
Supplemental data at www.neurology.org
Address correspondence and reprint requests to Dr. Marie Lambert, Division of Medical Genetics, Ste-Justine Hospital, 3175 Coˆte-Sainte-Catherine, Montreal, Quebec, H3T 1C5, Canada
processes.
4Quantitatively and qualitatively, the
most important methyl consumers are creatine,
phosphatidylcholine, and sphingomyelin
bio-synthesis, as well as DNA methylation.
4,5Overall, this suggests that the
pathophysio-logic mechanisms underlying neuropathophysio-logic
im-pairment may be distinct between RD and
CBS deficiency. In contrast to CBS
defi-ciency, low methionine levels in RD can
im-pair the transmethylation pathway (figure 1),
potentially contributing to the neurologic
in-volvement. To test this hypothesis in vivo, we
investigated a group of patients with RD by
magnetic resonance spectroscopic imaging
(MRSI) to measure creatine and
choline-containing compounds in the brains of these
patients. The concentrations of the
metabo-lites of transmethylation pathways were also
determined in plasma and urine.
METHODSPatients and controls. Twelve patients
(me-dian age 6 years, range 2–22 years) with homocystinuria due to RD were prospectively included: seven patients with combined homocystinuria–methylmalonic aciduria (CblC, Online Mende-lian Inheritance in Man [OMIM] no. 277400), one patient with methionine synthase deficiency (CblG, OMIM no. 250940), and four patients (including three siblings, patients 9 –11) with MTHFR deficiency (OMIM no. 236250). Diagnoses were con-firmed by enzyme assays (MTHFR), complementation studies (CblC and G), and molecular analyses (CblC) as previously de-scribed6,7(performed by Dr. D.S. Rosenblatt, McGill University,
Montreal, Canada). Patients’ medical charts were retrospectively reviewed. Controls included 36 consecutive children of similar age (median 6.9 years, range 2–18 years) for whom magnetic resonance (MR) spectra were acquired after a brain MRI
exami-nation performed for assessment of various nonmetabolic neuro-logic disorders. Individuals with unexplained encephalopathy diffuse cerebral abnormalities and those who received brain irra-diation were excluded. Informed consent was obtained from par-ticipants or their legal guardians, and the Institutional Review Board of Ste-Justine Hospital approved the study.
Brain MRI and spectroscopy. Patients and controls
under-went brain MRI and1
H MRSI examinations on a 1.5-tesla Mag-netom Symphony MR imager (Siemens, Erlangen, Germany) using a standard circularly polarized head coil. MRSI data were acquired with the point-resolved spectroscopy sequence on a 15-mm-thick axial slice passing through the center of the thalami. Acquisition parameters were a field of view of 16⫻ 16 cm2
, a voxel size of 15⫻ 10 ⫻ 10 mm3
, 16 phase-encoding steps in each direction, an echo time of 135 ms, and a repetition time of 1,500 ms. Quantitation of the metabolite signals of
N-acetylaspartate (NAA), creatine plus phosphocreatine (Cr),
and choline-containing compounds (Cho), as well as the Cho/Cr ratio, was performed using the LCModel software package.8
Me-tabolites levels were quantitated from a single voxel in each hemisphere for three brain areas: thalamus, frontal white matter, and lenticular nucleus. For each individual, the concentration for a specific brain area was the mean of the left and right sides measurements. Metabolite units were the untransformed con-centrations as recorded by LCModel.
Biochemical studies. Venous blood was collected in a
15-U/mL sodium heparin tube and placed on ice. Samples were centri-fuged immediately and plasma stored at⫺80°C. Before storage at ⫺80°C, an aliquot of plasma was deproteinized with perchloric acid for determination of AdoMet and S-adenosylhomocysteine (AdoHcy). Plasma amino acid concentrations were measured by automated ion-exchange chromatography (Biochrom 30, Fisher Scientific Ltd.) and plasma total homocysteine by fluorescence po-larization immunoassay (IMx homocysteine kit, Abbott). Plasma AdoMet and AdoHcy concentrations were determined using stable isotope dilution tandem mass spectrometry.9Guanidinoacetate and
creatine were measured in plasma and urine using stable isotope dilution gas chromatography–mass spectrometry as previously re-ported.10,11
Statistical analyses. Brain metabolites measured by MRSI
were compared between patients and controls using a Student t test. Linear regression was used to examine the association be-tween age (explanatory variable) and brain metabolite concentra-tions and ratios (dependent variable) in patients and controls. To test whether the magnitude of the effect of age on metabolite concentrations and ratio varied as a function of the diagnostic category (patients vs controls), we used a product term (age * diagnostic category; controls⫽ reference group). The regression coefficient of the product term (age * diagnostic category) can be interpreted as the amount of change in the association between age and brain metabolites when diagnostic category is “patients” instead of “controls” (reference category). A one-sample signed rank test was used to compare patients’ plasma and urine metab-olite concentrations and the upper limit of the given reference range for homocysteine, AdoMet, AdoHcy, guanidinoacetate, and the lower limit of the given reference range for methionine and creatine. The 95% CI of the proportion of patients with plasma or urine concentrations of transmethylation and creatine biosynthesis pathways above (or below) the upper (or lower) limit of the reference range were estimated as previously de-scribed.12Reference ranges for each of these plasma and urine
metabolites were provided by the laboratory that performed the
Figure 1 The transmethylation pathway
AdoHcy⫽ S-adenosylhomocysteine; AdoMet ⫽ S-adenosylmethionine; CblC ⫽ combined homocystinuria–methylmalonic aciduria; CblG⫽ methionine synthase deficiency; MTHFR ⫽ methylene tetrahydrofolate reductase deficiency; THF⫽ tetrahydrofolate. Enzymes: a, methylene tetrahydrofolate reductase; b, methionine synthase; c, methionine adenosyl-transferase; d, guanidinoacetate methyladenosyl-transferase; e, phosphoethanolamine methyltrans-ferase; f, S-adenosylhomocysteine hydrolase.
Neurology 71 July 1, 2008 45
at UNIV MEDECINE LEIG 22827242 on January 30, 2009
www.neurology.org
biochemical measurement; thus, the reference populations for these measurements were different from the controls for the MRSI stud-ies. Only unrelated patients were included in statistical analyses to avoid overrepresentation of the three members of the same family (only the proband was included). Statistical significance was set at ⬍0.05. Statistical analyses were performed with SAS statistical soft-ware (version 9.1, SAS Institute, Inc., Cary, NC).
RESULTS
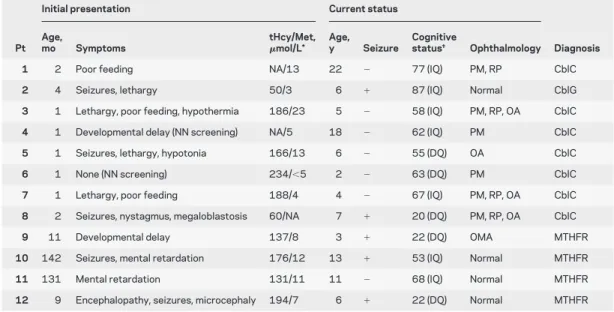
Characteristics at presentation and current
status of patients are shown in table 1. Median age at
diag-nosis was 2 months (range 1–142 months). Ten patients
had low methionine concentration (⬍14 mmol/L) at
di-agnosis. Patients were initially treated with
hydroxoco-balamin (IM injections), folic acid, betaine, and
moderate protein restriction. CblC patients received
oral
L-carnitine supplementation. Hydroxocobalamin
was discontinued in MTHFR patients. No CblC
pa-tient experienced episode of acidosis after initiation of
treatment. Currently, no patient has signs of spasticity.
Brain MRI.
Results of brain MRI are summarized
in table e-1 on the Neurology
®Web site at www.
neurology.org. The main neuroradiologic findings
were nonspecific cerebral atrophy with
periven-tricular white matter loss. For many patients (8/
12), this pattern was reminiscent of periventricular
leukomalacia. Focal white matter T2
hyperintensi-ties were uncommon and mild.
Magnetic resonance spectroscopy.
Mean Cho
concen-tration was significantly lower in patients than in
controls in the three regions examined (table 2).
Brain Cr and Cho/Cr ratio were lower in patients
than in controls, but these differences reached
signif-icance only for the Cho/Cr ratio in the lenticular
nuclei. In controls, Cho tended to decrease with age
in frontal white matter and lenticular nuclei, whereas
Cr decreased only in frontal white matter. In
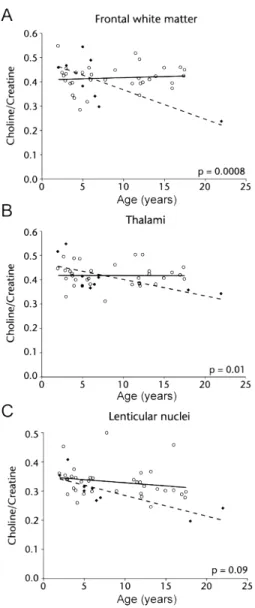
pa-tients, both Cho and Cho/Cr ratio decreased with
age in each brain region examined (table e-2). The
effect of age on Cho/Cr ratio clearly differed between
cases and controls in frontal white matter (p
interaction⫽0.0008) and thalami (p
interaction⫽ 0.01). The
Cho/Cr ratio decreased progressively with age in
cases but was stable in controls (figure 2). We
de-tected no differences between patients and controls
in mean brain NAA concentrations nor any
signifi-cant changes with age (tables 2 and e-2).
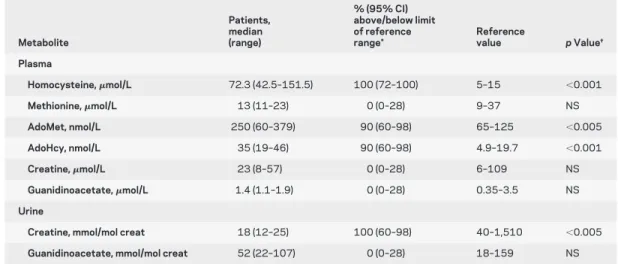
Biochemical studies.
All patients had high plasma
to-tal homocysteine (table 3). Plasma methionine
con-centration was in the lower half of the distribution
for all cases but, paradoxically, plasma AdoMet, the
product of adenylation of methionine (figure 1,
reac-tion C), was markedly increased in patients.
AdoHcy, the product of all methyltransferases (figure
1, reactions D and E), was also increased. Urine and
plasma concentrations of guanidinoacetate, the
pre-cursor of creatine (figure 1, reaction D), were within
reference range in all patients. Urinary excretion of
creatine, the methylation product of
guanidinoac-etate, was significantly decreased.
Table 1 Characteristics of patients
Initial presentation Current status
Pt Age,
mo Symptoms
tHcy/Met,
mol/L* Age,y Seizure
Cognitive
status† Ophthalmology Diagnosis
1 2 Poor feeding NA/13 22 ⫺ 77 (IQ) PM, RP CblC
2 4 Seizures, lethargy 50/3 6 ⫹ 87 (IQ) Normal CblG
3 1 Lethargy, poor feeding, hypothermia 186/23 5 ⫺ 58 (IQ) PM, RP, OA CblC
4 1 Developmental delay (NN screening) NA/5 18 ⫺ 62 (IQ) PM CblC
5 1 Seizures, lethargy, hypotonia 166/13 6 ⫺ 55 (DQ) OA CblC
6 1 None (NN screening) 234/⬍5 2 ⫺ 63 (DQ) PM CblC
7 1 Lethargy, poor feeding 188/4 4 ⫺ 67 (IQ) PM, RP, OA CblC
8 2 Seizures, nystagmus, megaloblastosis 60/NA 7 ⫹ 20 (DQ) PM, RP, OA CblC
9 11 Developmental delay 137/8 3 ⫹ 22 (DQ) OMA MTHFR
10 142 Seizures, mental retardation 176/12 13 ⫹ 53 (IQ) Normal MTHFR
11 131 Mental retardation 131/11 11 ⫺ 68 (IQ) Normal MTHFR
12 9 Encephalopathy, seizures, microcephaly 194/7 6 ⫹ 22 (DQ) Normal MTHFR
*Normal values for plasma total homocysteine (tHcy), 5–15mol/L; and for plasma methionine (Met), 9–37 mol/L. †Neuropsychological testing included evaluation of IQ by the Wechsler Adult Intelligence Scale–Revised, the Wechsler Intelligence Scale for Children Version III, and the Leiter, and assessment of developmental quotient (DQ) by the Griffiths Mental Development Scale, according to patient’s age and developmental status.
Pt⫽ patient; NA ⫽ not available; PM ⫽ pigmentary maculopathy; RP ⫽ retinitis pigmentosa; CblC ⫽ combined homocystin-uria–methylmalonic aciduria; CblG⫽ methionine synthase deficiency; OA ⫽ optic atrophy; NN ⫽ neonatal; OMA ⫽ oculomo-tor apraxia; MTHFR⫽ methylene tetrahydrofolate reductase deficiency.
DISCUSSION
In agreement with most reports, RD
patients in this study have a wide range of severe
neurologic symptoms, including seizures,
psychomo-tor delay, and cognitive impairment. The
pathophys-iologic mechanisms underlying the neurologic
involvement in RD is not fully understood. Plasma
homocysteine concentration is generally lower in RD
than in CBS deficiency. However, in contrast to CBS
deficiency, microcephaly is frequent in RD
1and was
observed in six of our patients (table e-1). There is no
obvious relationship between plasma homocysteine
concentration and clinical phenotype.
Our hypothesis was that the lack of methyl
groups could be responsible for secondary creatine
deficiency and cerebral guanidinoacetate
intoxica-tion. By extension, transmethylation pathway
dis-ruption in RD may induce depletion of all
AdoMet-dependent biosynthetic processes. At least 50
AdoMet-dependent methylation reactions exist in
mammals, which constitutes a minimal estimation as
suggested by genomic analyses.
13MRSI was previously used to identify secondary
brain creatine depletion in hyperornithinemia due to
ornithine-
␦-aminotransferase deficiency,
14and it was
hypothesized that the reduced brain creatine
concen-tration contributed to the retinal degeneration
ob-served in this condition.
15Six of our patients had
retinitis pigmentosa or pigmentary maculopathy. In
our study, we did not find significant brain creatine
depletion, although given the small size of our
sam-ple, a definitive answer to this question will need
fur-ther study. Low urinary creatine excretion indicates
probable peripheral insufficiency, suggesting a
com-partmentation phenomenon. Moreover, no increase
in guanidinoacetate concentration was found in
plasma and urine, in contrast to a previous report on
six CblC patients.
16Despite plasma creatine
concen-trations in the low-normal range, it is possible that
brain creatine uptake was sufficient to sustain
ade-quate brain creatine levels.
Based on early studies of the labile methyl balance, it
has been considered that creatine biosynthesis
con-sumed more AdoMet than all the other physiologic
methyltransferases reactions combined, accounting for
the use of more than 70% of AdoMet-derived methyl
Table 2 Brain NAA, Cho, and Cr concentrations* and Cho/Cr ratio measured by magnetic resonance spectroscopic imaging
Brain region Patients†, nⴝ 9 Controls, nⴝ 36 p Value‡
Frontal white matter
NAA 0.220⫾ 0.045 0.253⫾ 0.052 0.1 Cho 0.051⫾ 0.010 0.064⫾ 0.010 0.001 Cr 0.142⫾ 0.027 0.158⫾ 0.032 0.1 Cho/Cr 0.380⫾ 0.108 0.415⫾ 0.053 0.2 Lenticular nucleus NAA 0.327⫾ 0.031 0.347⫾ 0.032 0.1 Cho 0.056⫾ 0.011 0.069⫾ 0.009 ⬍0.001 Cr 0.204⫾ 0.027 0.213⫾ 0.022 0.3 Cho/Cr 0.277⫾ 0.046 0.331⫾ 0.053 ⬍0.01 Thalamus NAA 0.328⫾ 0.051 0.324⫾ 0.033 0.8 Cho 0.063⫾ 0.010 0.071⫾ 0.007 0.006 Cr 0.163⫾ 0.017 0.173⫾ 0.019 0.2 Cho/Cr 0.388⫾ 0.056 0.417⫾ 0.045 0.1
*LCModel untransformed concentrations; values are mean⫾ SD.
†Only the unrelated patients (including the proband of the family) were included in this anal-ysis to avoid overrepresentation of the three members of the same family.
‡p values for differences between patients and control subjects using Student t test. NAA⫽ N-acetylaspartate; Cho ⫽ water-soluble choline-containing compounds; Cr ⫽ creatine.
Figure 2 Scatter plots of the choline/creatine ratio according to age in frontal white matter (A), lenticular nuclei (B), and thalami (C)
Solid lines are regression curves for patients (⽧); dashed lines are regression curves for controls (X).
Neurology 71 July 1, 2008 47
at UNIV MEDECINE LEIG 22827242 on January 30, 2009
www.neurology.org
groups in humans.
17,18Recent studies in animal models
as well as reexamination of the human creatine
metabo-lism suggested that creatine synthesis was responsible
for a smaller proportion of AdoMet-derived methyl
group consumption and that phosphatidylcholine
syn-thesis through the reaction catalyzed by the
phosphati-dylethanolamine methyltransferase was a major
consumer of these methyl groups.
19,20In this study, we
found that patients with RD had a significant decrease
in choline-containing compounds signal in the brain.
The Cho signal is mainly derived from the precursors of
phosphatidylcholine, phosphocholine, free choline, and
glycerophosphocholine.
21Overall, our results are in
agreement with the recent estimation on the methyl
group balance in humans.
19,20Phosphatidylethano-lamine methyltransferase is the rate-limiting step of
phosphatidylcholine synthesis in the liver. Its activity
has also been specifically characterized in
oligodendro-cytes, although it was considered a minor contributor to
the total phosphatidylcholine synthesis in the whole
brain. Phosphatidylcholine synthesis in brain proceeds
mainly through the CDP-choline/Kennedy pathway,
directly incorporating phosphocholine on the
diacyl-glycerol backbone.
22Nevertheless, conversion of
phosphatidylethanolamine into phosphatidylcholine
remains the only known pathway for the de novo
cho-line biosynthesis in the body, ultimately supplying the
brain in choline.
Of note, cerebral choline depletion observed by
MRSI has been reported in an infant with dietary
cobalamin deficiency
23and in a patient with
S-adenosylhomocysteine hydrolase deficiency
24(fig-ure 1, reaction F), both situations potentially
impair-ing transmethylation pathway. Because brain MRSI
in patients with nonspecific psychomotor delay,
my-elination delay, or focal T2-weighted
hyperintensi-ties shows an increase in the choline signal,
25-27we
think that our findings are specific to RD and related
to the metabolic defects. In our patients, we can
spec-ulate that lifelong depletion of choline precursors has
contributed to the periventricular white matter loss
and cerebral atrophy observed on MRI.
Previous studies have shown that brain
concentra-tions of creatine and choline remain constant after
age 2 years.
28In our control group, we found a slight
Cho decrease with age in frontal with matter and
lenticular nuclei, whereas the Cho/Cr ratio was
sta-ble. By contrast, in patients, the Cho/Cr ratio
pro-gressively decreased with age in the three brain
regions examined. This suggests that brain Cho
de-pletion occurs as an isolated phenomenon and that
this deficiency seems persistent throughout life.
There was a paradoxical increase in plasma AdoMet
in our patients, as previously reported in a study of six
CblC patients.
16This was discordant with the
concom-itant low methionine levels. The explanation for such a
paradoxical AdoMet increase remains unclear, but a
sec-ondary inhibition of the methylases is likely. This
rein-troduces a “toxic hypothesis” in the pathophysiologic
model of the disease, in addition to the “depletion
hy-pothesis” already discussed. AdoHcy, an inhibitor of
many AdoMet-dependent methyltransferases, was high
Table 3 Plasma and urine concentrations of transmethylation and creatine biosynthesis pathways metabolites Metabolite Patients, median (range) % (95% CI) above/below limit of reference range* Reference value p Value† Plasma Homocysteine,mol/L 72.3 (42.5–151.5) 100 (72–100) 5–15 ⬍0.001 Methionine,mol/L 13 (11–23) 0 (0–28) 9–37 NS AdoMet, nmol/L 250 (60–379) 90 (60–98) 65–125 ⬍0.005 AdoHcy, nmol/L 35 (19–46) 90 (60–98) 4.9–19.7 ⬍0.001 Creatine,mol/L 23 (8–57) 0 (0–28) 6–109 NS Guanidinoacetate,mol/L 1.4 (1.1–1.9) 0 (0–28) 0.35–3.5 NS Urine
Creatine, mmol/mol creat 18 (12–25) 100 (60–98) 40–1,510 ⬍0.005
Guanidinoacetate, mmol/mol creat 52 (22–107) 0 (0–28) 18–159 NS
*For plasma homocysteine, S-adenosylmethionine (AdoMet), S-adenosylhomocysteine (AdoHcy), guanidinoacetate, and urine guanidinoacetate, we considered concentrations above the upper limit of the reference range. For plasma methionine, creatine, and urine creatine, we considered concentrations below the lower limit of the reference range. Only the unrelated patients (including the proband of the family) were included in this analysis to avoid overrepresentation of the three mem-bers of the same family.
†p value for comparison between patients and upper limit of the reference range (for homocysteine, AdoMet, AdoHcy, and gua-nidinoacetate) and the lower limit of the reference range (for methionine and creatine), using a one-sample signed rank test. NS⫽ not significant.
in our patients, but there was no significant association
between AdoMet and AdoHcy concentrations. Of
note, plasma AdoMet concentration was significantly
higher in CblC patients than in MTHFR patients.
Ad-ditional studies are needed to investigate the
mecha-nisms underlying AdoMet accumulation in RD.
Our results show that patients with RD have an
isolated deficiency of choline-containing compounds
in the brain, probably due to the impairment of
transmethylation processes. Paradoxical AdoMet
in-crease suggests that secondary inhibition of
methyl-ases could contribute to the transmethylation defect
in these conditions.
ACKNOWLEDGMENT
The authors thank Mrs. Yolande Lefevre for her excellent assistance dur-ing the course of this study and all patients and their families for their participation.
Received September 9, 2007. Accepted in final form March 7, 2008
REFERENCES
1. Rosenblatt DS, Fenton WA. Inherited disorders of folate and cobalamin transport and metabolism. In: Scriver CR, Beaudet AL, Sly WS, Valle D, eds. The Metabolic and Molecular Bases of Inherited Disease. 8th ed. New York: McGraw-Hill, 2001:3897–3933.
2. Rosenblatt DS, Aspler AL, Shevell MI, et al. Clinical het-erogeneity and prognosis in combined methylmalonic aci-duria and homocystinuria (cblC). J Inherit Metab Dis 1997;20:528–538.
3. Ogier de Baulny H, Gerard M, Saudubray JM, Zittoun J. Remethylation defects: guidelines for clinical diagnosis and treatment. Eur J Pediatr 1998;157:S77–S83.
4. Wyss M, Kaddurah-Daouk R. Creatine and creatinine me-tabolism. Physiol Rev 2000;80:1107–1213.
5. Clarke S, Banfield K. S-adenosylmethionine-dependent methyltransferases. In: Carmel R, Jacobsen DW, eds. Ho-mocystine in Health and Disease. Cambridge, UK: Cam-bridge University Press, 2001:63–78.
6. Watkins D. Cobalamin metabolism in methionine-dependent human tumor and leukemia cell lines. Clin In-vest Med 1998;21:151–158.
7. Lerner-Ellis JP, Tirone JC, Pawelek PD, et al. Identification of the gene responsible for methylmalonic aciduria and ho-mocystinuria, cblC type. Nat Genet 2006;38:93–100. 8. Provencher SW. Automatic quantitation of localized in
vivo1
H spectra with the LCModel. NMR Biomed 2001; 14:260–264.
9. Gellekink H, van Oppenraaij-Emmerzaal D, van Rooij A, Struys EA, den Heijer M, Blom HJ. Stable-isotope dilu-tion liquid chromatography-electrospray injecdilu-tion tandem mass spectrometry method for fast, selective measurement of S-adenosylmethionine and S-adenosylhomocysteine in plasma. Clin Chem 2005;51:1487–1492.
10. Valongo C, Cardoso ML, Domingues P, et al. Age related reference values for urine creatine and guanidinoacetic acid concentration in children and adolescents by gas chromatography-mass spectrometry. Clin Chim Acta 2004;348:155–161.
11. Almeida LS, Verhoeven NM, Roos B, et al. Creatine and guanidinoacetate: diagnostic markers for inborn errors in
creatine biosynthesis and transport. Mol Genet Metab 2004;82:214–219.
12. Newcombe RG, Altman DG. Proportions and their differ-ences. In: Altman DJ, Machin D, Bryant TN, Gardner MJ, eds. Statistics with Confidence. London: BMJ Books, 2000:45–56.
13. Katz JE, Dlakic M, Clarke S. Automated identification of putative methyltransferases from genomic open reading frames. Mol Cell Proteomics 2003;2:525–540.
14. Na¨nto¨-Salonen K, Komu M, Lundbom N, et al. Re-duced brain creatine in gyrate atrophy of the choroid and retina with hyperornithinemia. Neurology 1999; 53:303–307.
15. Sipila I, Rapola J, Simell O, Vannas A. Supplementary creatine as a treatment for gyrate atrophy of the choroid and retina. N Engl J Med 1981;304:867–870.
16. Bodamer OA, Sahoo T, Beaudet AL, et al. Creatine me-tabolism in combined methylmalonic aciduria and homo-cystinuria. Ann Neurol 2005;57:557–560.
17. Mudd SH, Poole JR. Labile methyl balances for normal humans on various dietary regimens. Metabolism 1975; 24:721–735.
18. Mudd SH, Ebert MH, Scriver CR. Labile methyl group balances in the human: the role of sarcosine. Metabolism 1980;29:707–720.
19. Noga AA, Stead LM, Zhao Y, Brosnan ME, Brosnan JT, Vance DE. Plasma homocysteine is regulated by phospho-lipid methylation. J Biol Chem 2003;278:5952–5955. 20. Stead LM, Brosnan JT, Brosnan ME, Vance DE, Jacobs
RL. Is it time to reevaluate methyl balance in humans? Am J Clin Nutr 2006;83:5–10.
21. Boulanger Y, Labelle M, Khiat A. Role of phospholipase A2on the variation of the choline signal intensity observed
by1
H magnetic resonance spectroscopy in brain diseases. Brain Res Rev 2000;33:380–389.
22. Vos JP, de Haas CGM, van Golde LMG, Lopes-Cardozo M. Relationships between phosphatidylcholine, phosphatidyleth-anolamine and sphingomyelin metabolism in cultured oligo-dendrocytes. J Neurochem 1997;68:1252–1260.
23. Horstmann M, Neumaier-Probst E, Lukacs Z, Steinfeld R, Ullrich K, Kohlschutter A. Infantile cobalamin deficiency with cerebral lactate accumulation and sustained choline depletion. Neuropediatrics 2003;34:261–264. 24. Baric I, Fumic K, Glenn B, et al. S-adenosylhomocysteine
hydrolase deficiency in a human: a genetic disorder of me-thionine metabolism. Proc Natl Acad Sci USA 2004;101: 4234–4239.
25. Kreis R, Ernst T, Ross BD. Development of the human brain: in vivo quantification of metabolite and water con-tent with proton magnetic resonance spectroscopy. Magn Reson Med 1993;30:424–437.
26. Yeo RA, Hill D, Campbell R, Vigil J, Brooks WM. Devel-opmental instability and working memory ability in chil-dren: a magnetic resonance spectroscopy investigation. Dev Neuropsychol 2000;17:143–159.
27. Filippi CG, Ulug AM, Deck MD, Zimmerman RD, Heier LA. Developmental delay in children: assessment with proton MR spectroscopy. AJNR Am J Neuroradiol 2002;23:882–888. 28. Pouwels PJW, Brockmann K, Kruse B, et al. Regional age
dependence of human brain metabolites from infancy to adulthood as detected by quantitative localized proton MRS. Pediatr Res 1999;46:474–485.
Neurology 71 July 1, 2008 49
at UNIV MEDECINE LEIG 22827242 on January 30, 2009
www.neurology.org