Title page. 1 2 3 4 Title :
Design of a versatile device for measuring whole plant gas exchanges in Arabidopsis
thaliana.
5 6
Running Title :
A rosette cuvette for photosynthesis measurements 7
8
Authors :
Pierre Tocquin and Claire Périlleux 9 10 11 12 13 14 15 Address :
Laboratory of Plant Physiology Department of Life Sciences University of Liège Sart-Tilman B22 4000 Liège Belgique 16 17 18 19 Corresponding author: Pierre Tocquin Email: [email protected]
Summary. 1 2 3 4 5 6 7 8 9 10 11 12 13 14 15 16 17 18 19 20 21 22
• Because of its small size and rosette growth habit, measuring gas exchanges in
Arabidopsis thaliana is still difficult with standard leaf cuvettes. We designed a
versatile system which is (1) usable at the whole rosette level, (2) as small as possible for fast and accurate measurements, but (3) adaptable to plant size, and (4) suitable for in situ measurements whatever the growing substrate of the plant.
• We designed the cuvette in two parts : (i) the basic unit, which contains the sensors and is connected to the infra-red gas analyzer, and (ii) the clear chamber, which is an independent module where the rosette is enclosed.
• We made a set of three interchangeable chambers of different sizes to measure the rate of CO2 assimilation [A] of 26-, 33- and 40-day old plants. The dependence of A to light irradiance and to intercellular CO2 concentration was recorded as typical response curves which validate our device.
• Measurements were not only consistent in saturating conditions, but accurate CO2 exchange measurements in limiting conditions also reflected important physiological features related to plant ageing.
Keywords.
Arabidopsis thaliana, gas exchanges, photosynthesis, cuvette, light-response curve,
Introduction. 1 2 3 4 5 6 7 8 9 10 11 12 13 14 15 16 17 18 19 20 21 22 23 24
Plant photosynthesis and transpiration are key parameters that respond to environmental conditions and determine final biomass. The photosynthetic gas exchanges of C3 plants have been widely explored and the dependence of CO2 assimilation to environmental parameters like atmospheric CO2 concentration and irradiance has been mathematically formulated (Prioul & Chartier, 1977; Farquhar et al., 1980). Gas exchange measurements can thus be used for non-invasive analyses of the mechanisms controlling photosynthesis in various physiological states.
Specific devices have been designed for monitoring gas exchanges. Their principle is to analyze gas (CO2 and water vapor) before and after the exchanges with the plant, which must be enclosed in the circuit. A critical parameter is the volume of the measurement chamber which must be small to ensure accurate and fast (low inertia) measurement of the flowing gas. Thus leaf cuvettes have been favored which isolate a unit leaf area in a tight clear chamber while flowing gas are circulated and monitored by an infrared gas analyzer (IRGA). The whole device can be portable for use in the laboratory or in the field. A variety of leaf cuvettes are available, which have been designed for crops and trees, hence are suitable for most plants, provided the measured leaf is larger than the cuvette and can be clamped without damage. However, a main concern about leaf cuvettes is the sampling they require : a unit leaf area is chosen for measurement although leaves are not only different according to their physiological age and position on the plant, but also show photosynthetic gradients. Thus the relevance of gas exchange measurements with a leaf cuvette clearly depends on the precision and reproducibility of criteria used to localize the measured area, but is still hardly amenable to the organism level.
An additional problem arises when the plant material of interest is too small for the leaves to be clamped easily, and using leaf cuvettes is all the more difficult for species having a rosette growth habit. Thus for species like Arabidopsis thaliana, specific devices have to be adapted or alternative measurements have to be performed. The production of O 1 2 3 4 5 6 7 8 9 10 11 12 13 14 15 16 17 18 19 20
2 by leaf disc samples was frequently used for photosynthesis studies since it may be measured with a Clark electrode (Neuhaus & Stitt, 1990; Signora et al., 1998; Van der Kooij et al., 1999; Draborg et al., 2001). Another solution is to remove plants from their substrate and enclose them in a gas exchange measurement chamber (Van der Kooij & De Kok, 1996; Eckardt et al., 1997). Other built-in house devices enclose the whole plant, together with its support, in the cuvette (Caspar et al., 1985; Van Oosten et al., 1997; Donahue et al., 1997; Sun et al., 1999). This solution, however, is not ideal for obtaining highly accurate measurements of gas exchanges because of background gas exchange due to the roots and microorganisms in the potting mixture, and because of the large volume of the measurement chamber.
Since we were interested in studying the effects of environmental changes on gas exchanges throughout plant growth in Arabidopsis, we set up a cuvette which was: (1) usable at the whole rosette level, (2) as small as possible for fast and accurate measurements, but (3) adaptable to plant size throughout the culture, and (4) suitable for
Materials and methods. 1 2 3 4 5 6 7 8 9 10 11 12 13 14 15 16 17 18 19 20 21 22 Plant growth
Plants of Arabidopsis thaliana ecotype Columbia were grown on hydroponics, as previously described (Tocquin et al., 2003). Briefly, seeds - first stratified for 3 days on wet filter paper at 2°C - were sown individually on 0.65% agar-containing seed-holders. Eight seed-holders were inserted in the cover of a 1L black plastic container filled with nutrient solution. The solution was renewed weekly from the third week of growth to prevent nutrient depletion. Plants were grown in phytotrons, in 8-hour short days. The photon flux density was 120 µmol.m-2.s-1 PAR (Very High Output fluorescent tubes, Sylvania, Zaventem, Belgium); temperature was 20°C (day/night) and relative humidity was 70%.
Cuvette design
We designed an upgradeable system formed of two independent units : (1) the basic unit which includes sensors for light and temperature, a fan for circulating air, and which is connected to the infrared gas analyzer (IRGA) (Ciras-1, PPSystems, Hitchin, U.K.), and (2) the clear chamber which is a removable module, with a circular window. This device is described in more details below.
All the cuvette parts in contact with the air fluxes were made of Dural (aluminum alloy) or glass to ensure minimal adsorption of H2O and CO2.
The sensors, electrical and mechanical items used in the basic unit were supplied as a kit from PPSystems (Hitchin, U.K).
automatic air supplier allowing to control the flow rate and the CO2 and H2O partial pressure of the air entering the cuvette. To control the CO
1 2 3 4 5 6 7 8 9 10 11 12 13 14 15 16 17 18 19 20 21 22
2 input, ambient air is depleted by passing through a soda lime column, then CO2 provided by a small soda charger (ISI GmbH, Vienna, Austria) is automatically added by the air supplier coupled to a mass flowmeter.
Light source
For gas exchange measurements, the clear chamber was lit up with an halogen spot (12V, 50W, Philips) placed on the top of a “light column”. This column was formed of four elements, from top to bottom: the spot, an iris diaphragm to control the light intensity, a light shaping diffuser to increase the light homogeneity over the cuvette area, and a hot mirror to decrease the thermal radiation reaching the leaves (the last three items supplied by Te Lintelo Systems bv, Zevenaar, The Netherlands). The range of irradiances generated by the light column (0 – 1000 µmol.m-2.s-1 PAR) was calibrated using a PAR sensor (PPSystems, Hitchin, U.K).
Leaf area
The projected leaf area was used for the calculation of CO2 assimilation. Practically, a digital picture of the rosette was taken at the time of the gas exchange measurement. The projected leaf area was then calculated using an image analysis software
(SigmaScan Pro 4, Jandel Scientific) calibrated with a scale included in the picture.
Expression of results
The data collected by Ciras-1 (differences in CO2 and H2O amounts in the air entering and leaving the cuvette, temperature of air in the cuvette, and air flow rate) together
with measured parameters (light irradiance, leaf area and boundary layer resistance (rb), see below) were used to calculate gas exchange parameters according to von Caemmerer & Farquhar (1981). These calculations were greatly facilitated by the
availability of worksheets on the website 1
2 3 4
http://www.dundee.ac.uk/bioscience/photosyn.htm (Richard Parsons et al., Department of Biological Sciences, Dundee University, Dundee, Scotland). Each data shown is the mean of five measurements performed on five different plants. Statistical significance of results was assessed by analysis of variance (one-way ANOVA) using SigmaStat 2.03 (Jandel Scientific). Significance was accepted as P ≤ 0.001.
5 6 7 8 9 10 11 12 13 14
CO2 assimilation [A] was measured in response to increasing light irradiance [Q] and calculated intercellular CO2 [Ci]. Regression curves were obtained by fitting data to model equations from Prioul & Chartier (1977) and von Caemmerer & Farquhar (1981) by the least squares method using Photosyn Assistant (Dundee Scientific, Dundee, UK).
Results and discussion 1 2 3 4 5 6 7 8 9 10 11 12 13 14 15 16 17 18 19 20 21 22 23
Cuvette design and parameterization
Our cuvette was designed following the guidelines outlined by Long & Hällgren (1993) and is made of two units (Figure 1):
1. A basic unit composed of all the electrical and mechanical devices needed to control the circulation of air inside the cuvette (small 12V fan), to record the air temperature (thermocouple) and the irradiance (PAR sensor);
2. The clear chamber, made of:
i. A 3 mm-thick rigid bottom which can be inserted in between the rosette of the plant and the substrate (Figure 1a, b). A sliding bit with a small hole on its internal edge allows to clamp the hypocotyl without damage and isolate the cuvette from the substrate, whatever it is.
ii. A clear chamber which is clamped onto the bottom plate, with foam gaskets tightly sealing the assembling. The clear chamber has an external rectangular shape and an internal circular shape. The rectangle has a standard width to fit into the basic unit (i) but the internal diameter can be adapted to the size of the plant. Three chambers were constructed (Figure 1d) allowing measurements on plants with a diameter up to 25, 45 and 80 mm, and whose volume was around 20, 30, and 120 cm3, respectively. Special attention was paid when designing each chamber to avoid dead volume of air and to optimize air circulation all over the leaves. So, the large chamber was provided with an additional fan (Figure 1c). The air inlet and outlet were located at the start and the end of the air course inside the cuvette to avoid cross-contamination and to make
1 2 3 4 5 6 7 8 9 10 11 12 13 14 15 16 17 18 19 20 21 22
sure that the out-flowing air had been stirred over the rosette before being analyzed (Figure 1c).
The air flow rate entering the cuvette is a critical factor which has to be adapted to the size of the chamber and of the plant : increasing this rate contributes to avoid air contamination from the outside and to accelerate the steady-state achievement, but decreasing this rate is needed to measure very low amplitude gas exchanges. The optimal air flow rate was thus determined for each chamber by supplying CO2 free air (< 5 ppm) to the cuvette : we selected the lowest flow rate which allowed to reach steady-state CO2-free air inside the cuvette within 2 minutes (Figure 2). The fluxes of 250 ml.min-1, 350 ml.min-1, and 450 ml.min-1 were found to be optimal for the small, medium, and large chamber, respectively.
The leaf boundary layer resistance (rb) is due to a small layer of still air at the leaf surface that reduces the velocity of gas exchanges. This parameter is required to calculate leaf temperature and stomatal resistance. For gas exchange measurement, rb has to be minimized by increasing the air movement around the leaf and is thus affected by chamber design. In our cuvette, a low rb was obtained by the vigorous stirring of the air, the minimal volume of the chamber and the absence of pockets of still air. We determined rb for each cuvette from the evaporation rate of a wet filter paper under controlled conditions according to Parkinson (1995) using the RBCAL software provided with Ciras-1. rb was measured by using wet filter paper replica of the rosettes presented in Table 1. The boundary layer resistance to water vapor transfer was 0.32, 0.68 and 0.85 mol.m-2.s-1 for the small, the medium and the large chamber, respectively.
Gas exchange measurements 1 2 3 4 5 6 7 8 9 10 11 12 13 14 15 16 17 18 19 20 21 22 23
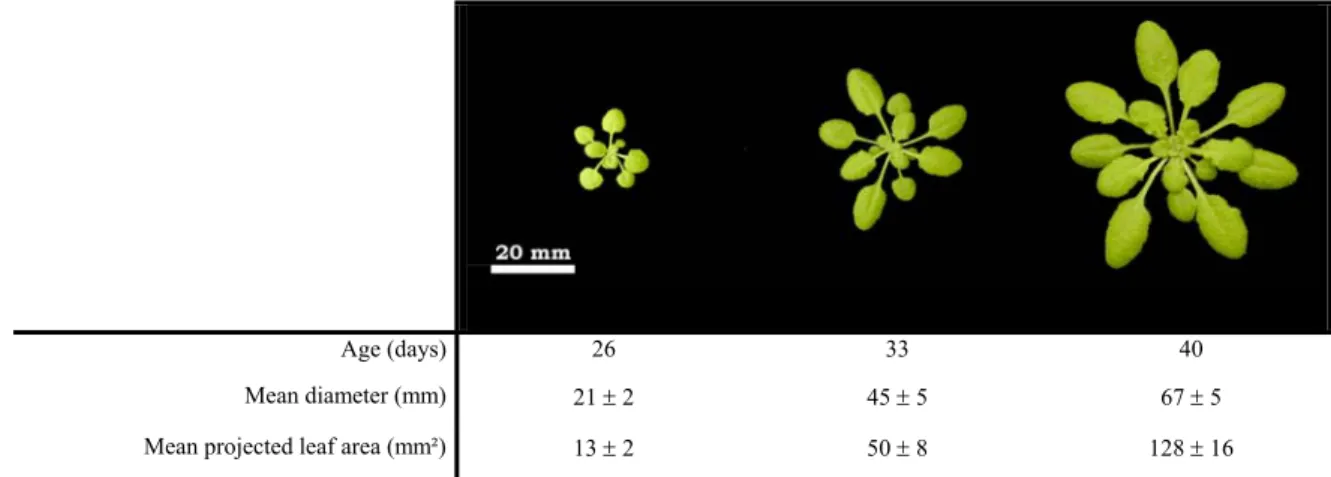
Photosynthesis measurements were performed on 26-, 33- and 40-day old plants (Table 1), using the small, the medium and the large chamber (Figure 1d), respectively. In our culture conditions, this relative short period of time covers the exponential growth phase during which the rosette leaf area is increasing 10 fold (Table 1). However, leaf shading is still reduced (< 5%), thus the projected leaf area gives a reliable estimation of the photosynthetic area and was used for calculations. All the measurements were performed with plants grown on hydroponics in phytotron under controlled air temperature (20°C) and humidity (70% RH). In these conditions, the leaf to air water vapor deficit [VPD] in the cuvette was calculated to be 0.9 - 1.3 kPa.
The necessity of designing clear chambers of different sizes was clearly demonstrated when all three cuvettes were compared for measuring CO2 assimilation [A] as a function of internal CO2 concentration [Ci] on 26-day old plants (Figure 3). When measurements were performed with the small chamber, which was almost at its uppermost limit of use with plants of this age, data were consistent and homogeneous (small standard deviations). With the medium chamber, the assimilation curve obtained was almost similar to the one recorded with the small cuvette but the variability of the data was higher, although the same 5 individuals were used for the measurements. When measurements were performed with the large cuvette, the data were even more variable and statistically different from the other 2 curves at P ≤ 0.001.
Light response curves
Photosynthesis response to increasing irradiance was assayed under ambient atmospheric CO2 level (389,6 ± 2,4 ppm). As expected from Prioul & Chartier (1977),
the light-response curves had a nonrectangular hyperbola shape with three main phases : (1) an initial linear phase in which A increases with photon flux density [Q]; (2) a transition from light-limited to light-saturated photosynthesis; this phase is commonly described by the rate of bending, or convexity [Θ] and (3) the light-saturated assimilation rate [A 1 2 3 4 5 6 7 8 9 10 11 12 13 14 15 16 17 18 19 20 21 22 23
sat]. Thus Θ determines the photosynthetic efficiency in the intermediate light range above the linear phase. The highest efficiency is attained when Θ = 1, in which case the curve goes directly from the linear part to the plateau set by Asat. This is never realized for cells and leaves that typically show Θ values within the range of 0.7 to 0.99 (Ögren, 1993).
From the regression curve fitting to model equation of Prioul & Chartier (1977), Asat was calculated to be 7.3 ± 0.4 µmol CO2 .m-2.s-1 for 26-day old plants and to increase thereafter to 9.6 ± 0.4 µmol CO2.m-2.s-1 (Figure 4a). These calculated values are slightly overestimated as compared to eye analysis of Figure 4a but this is expected since the model calculates Asat as the horizontal asymptote of the experimental curve. Thus evaluated and calculated values will be different unless Θ = 1. In parallel with the increase in Asat, the saturating irradiance [Qsat] - deduced from the curves - increased from around 550 µmol.m2.s-1 for the 26-day old plants to 700 µmol.m-2.s-1 for the older, while the light compensation point was unchanged and close to 30 µmol.m-2.s-1.
These values are in good agreement with light-response curves previously reported for
A. thaliana, using other methods or devices but comparable physiological conditions
(Caspar et al., 1985; Van der Kooij & De Kok, 1996; Eckardt et al., 1997; Sun et al., 1999). In contrast, Donahue et al. (1997) have measured unusually high values of Asat and Qsat - 23.5 µmol CO2.m-2.s-1 and 1400 µmol.m-2.s-1, respectively. Although they
used 26-day old plants, we can not dismiss differences in the physiological age of the material used for these measurements as compared to ours. But the discrepancy could also arise from technical problems : Donahue et al. (1997) measured CO
1 2 3 4 5 6 7 8 9 10 11 12 13 14 15 16 17 18 19 20 21 22 23 2 exchanges in a large cuvette of 150 cm3, enclosing whole plants together with their growing substrate, which may be inappropriate. As seen in Figure 3, using a large cuvette for small plants may give artifactual data and yield response curves which are abnormally smoothened and 'slow bending'. From our curves obtained with size-adapted cuvettes, Θ was calculated to be close to 0.92 for the 26- and 33-day old plants, 0.84 for the 40-day old plants. These values are consistent with the common range of 0.70 to 0.99 found for cells and leaves (Ögren & Evans, 1993).
A/Ci curves
Following the mechanistic model first proposed by Farquhar et al. (1980) and subsequently modified (von Caemmerer & Farquhar, 1981; Sharkey, 1985; Harley & Sharkey, 1991), a generalised response of the light-saturated CO2 assimilation rate [Asat] to leaf intercellular CO2 mole fraction [Ci] consists of two phases : an initial linear response where assimilation is limited by the amount of active Rubisco (the slope of this initial phase is Vc,max); this phase is followed by an inflection to a slower rise where Amax is reached due to limitation by the supply of substrate (ribulose 1,5-bisphosphate, RuBP).
The data presented on Figure 4b were fitted to model equations and the Vc,max the Rubisco was calculated to be 21.3 and 26.5 µmol.m-2.s-1 for 26- and 33-day old plants, respectively, and increased to 45.5 µmol.m-2.s-1 for the 40-day old plants. This increase is statistically significant, thus the activity of Rubisco seemed to rise with age.
The three A/Ci curves shown in Figure 4b were obtained from data recorded in an identical range of CO 1 2 3 4 5 6 7 8 9 10 11 12 13 14 15 16 17 18 19 20 21 22 23
2 concentrations in the cuvette [Ca] (the CO2 concentration in the inlet is set by the air supplier of the Ciras-1). Since stomatal conductance is the main parameter controlling the Ci/Ca ratio, the fact that Ci shifted to lower values with age reflects the concomitant decrease in stomatal conductance. As a consequence, the transpiration rate decreased from around 1.6 mmole.m-2.s-1 for 26- and 33-day old plants to 0.5 mmole.m-2.s-1 for 40-day old plants and the water use efficiency, expressed as the ratio between the rate of photosynthesis and transpiration, increased. This evolution possibly reflects optimisation of growth, which is observed when culture conditions - such as our hydroponic system - are non-limiting (van den Boogaard et al., 1995).
Conclusion
The cuvettes we have designed for measuring whole plant gas exchanges in Arabidopsis are made of common material and commercially available sensors. A critical parameter that determined the reliability of the measurements is the size of the cuvette, relative to the size of the plant. A set a three interchangeable cuvettes allowed us to measure accurately CO2 assimilation during plant growth. Light- and Ci- response curves allowed us to validate our measurements : our data are consistent with the literature, not only in saturating conditions, but also in limiting conditions where accurate measurements of low A gives information on the physiological state of the plant (Θ, Vc,max). Our device is totally independent of any growing system, hence can be used in any experimental purpose. Because of its easy handling and flexibility, we believe that this new experimental tool may be valuable at any scale, including functional genomic programs.
Acknowledgments 1 2 3 4 5 6 7 8
P. Tocquin is grateful to the F.R.I.A. for the award of research fellowships. This research was supported by the 'Action de Recherches Concertées' 98/03-219 of the University of Liège. We thank G. Demeure for his excellent technical skills in building the cuvette, P. Ongena for involvement in the first development stages of the cuvette and A. Pieltain for her assistance in photosynthesis measurements. The authors wish to thank Dr. Jiahong Li and Dr. Fabrice Franck for helpful comments on the manuscript.
References 1 2 3 4 5 6 7 8 9 10 11 12 13 14 15 16 17 18 19 20 21 22
Caspar T, Huber SC, Somerville C. 1985. Alterations in growth, photosynthesis and respiration in a starchless mutant of Arabidopsis thaliana (L.) deficient in chloroplast phosphoglucomutase activity. Plant Physiology 79: 11-17
Donahue RA, Poulson ME, Edwards GE. 1997. A method for measuring whole plant photosynthesis in Arabidopsis thaliana. Photosynthesis Research 52: 263-269
Draborg H, Villadsen D, Nielsen TH. 2001. Transgenic Arabidopsis plants with decreased activity of frustose-6-phosphate,2-kinase/fructose-2,6-bisphosphatase have altered carbon partitioning. Plant Physiology 126: 750-758
Eckardt NA, Snyder GW, Portis ARJr, Ogren WL. 1997. Growth and photosynthesis under high and low irradiance of Arabidopsis thaliana antisense mutants with reduced ribulose-1,5-bisphosphate carboxylase/oxygenase activase content. Plant Physiology 113: 575-586
Farquhar GD, von Caemmerer S, Berry JA. 1980. A biochemical model of photosynthetic CO2 assimilation in leaves of C3 species. Planta 149: 78-90.
Harley PC, Sharkey TD. 1991. An improved model of C3 photosynthesis at high CO2 - reversed O2 sensitivity explained by lack of glycerate reentry into the chloroplast.
Photosynthesis Research 27: 169-178.
Long SP, Hällgren J-E. 1993. Measurement of CO2 assimilation by plants in the field and the laboratory. In: Hall DO, Scurlock JMO, Bolhàr-Nordenkampf RC, Leegood RC, Long SP, eds. Photosynthesis and production in a changing environment: a field and
1 2 3 4 5 6 7 8 9 10 11 12 13 14 15 16 17 18 19
Neuhaus HE, Stitt M. 1990. Control analysis of photosynthate partitioning - impact of reduced activity of ADP-glucose pyrophosphorylase or plastid phosphoglucomutase on the fluxes to starch and sucrose in Arabidopsis thaliana (L) heynh. Planta 182: 445-454.
Ögren E. 1993. Convexity of the photosynthetic light-response curve in relation to intensity and direction of light during growth. Plant Physiology 101: 1013-1019.
Ögren E, Evans JR. 1993. Photosynthetic light-response curves. 1. The influence of CO2 partial pressure and leaf inversion. Planta 189: 182-190.
Parkinson KJ. 1995. A simple method for determining the boundary layer resistance in leaf cuvettes. Plant Cell and Environment 8: 223-226
Prioul J-L, Chartier P. 1977. Partitioning of transfer and carboxylation components of intracellular resistance to photosynthetic CO2 fixation: A critical analysis of the methods used. Annals of Botany 41: 789-800.
Sharkey TD. 1985. Photosynthesis in intact leaves of C3 plants: physics, physiology and rate limitations. Botanical Review 51: 53-105
Signora L, Galtier N, Skot L, Lucas H, Foyer CH. 1998. Over-expression of sucrose phosphate synthase in Arabidopsis thaliana results in increased foliar sucrose/starch ratios and favours decreased foliar carbohydrate accumulation in plants after prolonged growth with CO2 enrichment. Journal of Experimental Botany 49: 669-680
Sun J, Okita TW, Edwards GE. 1999. Modification of carbon partitioning, photosynthetic capacity, and O
1 2 3 4 5 6 7 8 9 10 11 12 13 14 15 16 17 18 19 20
2 sensitivity in Arabidopsis plants with low ADP-glucose pyrophosphorylase activity. Plant Physiology 119: 267-276
Tocquin P, Corbesier L, Havelange A, Pieltain A, Kurtem E, Bernier G, Perilleux C. 2003. A novel high efficiency, low maintenance, hydroponic system for synchronous growth and flowering of Arabidopsis thaliana. BMC Plant Biology 3: 2.
van den Boogaard R, Kostadinova S, Veneklaas E, Lambers H. 1995. Association of water-use efficiency and nitrogen use efficiency with photosynthetic characteristics of 2 wheat cultivars. Journal of Experimental Botany 46: 1429-1438.
Van der Kooij TAW, De Kok LJ. 1996. Impact of elevated CO2 on growth and development of Arabidopsis thaliana L. Phyton 36: 173-184
Van der Kooij TAW, De Kok LJ, Stulen I. 1999. Biomass production and carbohydrate content of Arabidopsis thaliana at atmospheric CO2 concentrations from 390 to 1680 µl.l-1. Plant Biology 1: 482-486
Van Oosten J-J, Gerbaud A, Huijser C, Dijkwel PP, Chua N-H, Smeekens CM. 1997. An Arabidopsis mutant showing reduced feedback inhibition of photosynthesis. Plant
Journal 12: 1011-1020.
von Caemmerer S, Farquhar GD. 1981. Some relationships between the biochemistry of photosynthesis and the gas exchange rates of leaves. Planta 153: 376-387.
Tables. 1
2 3 4
Table 1. Growth parameters of the plants used in gas exchange experiments.
Rosette diameter and projected leaf area of 26-, 33- and 40-day old plants grown on hydroponics in 8-h short days, 120 µmol.m-2.s-1 PAR. Data are means ± SD for 5 plants.
Age (days) 26 33 40
Mean diameter (mm) 21 ± 2 45 ± 5 67 ± 5 Mean projected leaf area (mm²) 13 ± 2 50 ± 8 128 ± 16 5
Figure legends. 1 2 3 4 5 6 7 8 9 10 11 12 13 14 15 16 17 18 19 20 21 22
Figure 1. Arabidopsis cuvette. (a) 3D exploded drawing of the cuvette showing the basic unit [BU] and the chamber [CH] which is formed of the 3-mm thick rigid bottom [b] and the clear chamber [cch]. Gaskets [g] insure air-tight assembling of the main unit, the clear chamber and the bottom. A large sliding door [sd] - with a small hole [h] on the internal edge – allows to slip the bottom between the rosette and the substrate and to close the bottom without damage to the hypocotyls. (b) Picture of the cuvette in a working state, assembled with the medium chamber. (c) Horizontal section of the basic unit [BU] and the large chamber [CH] showing the air flow inside the cuvette: the main fan [mf] and auxiliary fan [af] circulate flowing air from inlet [ai] to outlet [ao]; (d) The small, medium and large clear chambers. See the text for size specifications.
Figure 2. Influence of the input air flow rate on the measurement accuracy in the cuvette. Typical results are shown for the medium size chamber. Input air was depleted in CO2. Before closing the cuvette, output air analyzed was ambient, thus the output - input CO2 concentration was about 400 ppm.
Figure 3. Photosynthesis response of 26-day old plants to increasing intercellular CO2 (Ci). Gas exchange measurements were performed on the same 5 plants, using the three different size chambers. * statistically different from the small chamber measurements at P ≤ 0.001.
Figure 4. Photosynthesis response curves of 26-, 33- and 40-day old plants (n=5). Chamber size was adapted to plant diameter at the time of measurement. (a) Light response curves. (b) Intercellular CO
1 2 3 4 5 6
2 response curves. Regression curves were obtained by fitting data to model equations by the least squares method. * statistically different from 26-day old plant data at P ≤ 0.001.
Illustrations. 1
2 Figure 1
1 Figure 2
2 3
1 Figure 3
2 3
1 Figure 4