Catalysis Today xxx (xxxx) xxx
Please cite this article as: Giulia Zoppi, Catalysis Today, https://doi.org/10.1016/j.cattod.2020.08.013 Available online 26 August 2020
0920-5861/© 2020 The Authors. Published by Elsevier B.V. This is an open access article under the CC BY-NC-ND license
(http://creativecommons.org/licenses/by-nc-nd/4.0/).
Aqueous phase reforming of lignin-rich hydrothermal liquefaction
by-products: A study on catalyst deactivation
Giulia Zoppi
a, Giuseppe Pipitone
a, Camilla Galletti
a, Andrea Maria Rizzo
b,
David Chiaramonti
b,c, Raffaele Pirone
a, Samir Bensaid
a,*
aDepartment of Applied Science and Technology, Politecnico Di Torino, Corso Duca Degli Abruzzi 24, 10129, Turin, Italy bRenewable Energy Consortium for Research and Development (RE-CORD), Viale Kennedy 182, 50038, Scarperia e San Piero, Italy c“Galileo Ferraris” Energy Department, Politecnico Di Torino, Corso Duca Degli Abruzzi 24, 10129, Turin, Italy
A R T I C L E I N F O Keywords:
Aqueous phase reforming Deactivation
Lignin hydrothermal liquefaction Biorefinery
Renewable hydrogen
A B S T R A C T
The water fraction derived from the hydrothermal liquefaction of a lignin-rich feedstock was subjected to aqueous phase reforming to produce hydrogen. Deactivation of the catalyst was observed, and it was ascribed to fouling phenomena caused by phenolic oligomers. Simple aromatics like guaiacol and phenol, as well as in-organics, were proved not to be the cause of the deactivation thanks to the use of a multi-component synthetic mixture. The influence of using activated carbon as a pretreatment was studied, leading to a strong improvement of the performance when it was carried out at high temperature. The extent of deactivation was assessed using aqueous phase reforming of glycolic acid as a model reaction test. The results were found to be correlated with the surface area of the catalyst. A thermal regeneration in inert conditions was evaluated as a mode of catalyst regeneration. While the textural properties were partially recovered, the performance of the catalyst only slightly improved. A spectroscopic analysis of the solids in the aqueous solution was carried out, highlighting the structural similarities between their nature and the lignin residue. The results obtained in this study helped to enlarge the knowledge on the aqueous phase reforming of real complex mixtures, looking at indicators of paramount importance for a possible industrial application such as the stability of the catalyst.
1. Introduction
Lignocellulosic biomass is a valuable feedstock for the sustainable production of energy and chemicals thanks to its availability and low cost [1]. Several processes may be used for its conversion into valuable products, but they can be lumped into two different strategies [2]. On one side, lignocellulosic biomass can be separated into its main com-ponents (cellulose, hemicellulose, lignin), which in turn will be con-verted into the desired product (e.g. bioethanol). Despite its advantages in terms of flexibility, this option offers the drawback of more complex and expensive operation (necessity of pretreatment steps, etc.). On the other side, another option is the possibility to process the entire biomass, such in the case of hydrothermal liquefaction (HTL) [3,4].
HTL is a thermochemical process performed with water under sub- or near-critical conditions, able to produce a biofuel commonly known as biocrude [5]. Despite its high energetic content (about 30 MJ/kg, that is 70–95 % of petroleum oil), oxygen can account for up to 35 wt.%, meaning that it must be removed to increase its calorific value and other
properties such as thermal and chemical stability [6,7].
Apart from the organic phase, other products are obtained. A CO2-
rich gas phase is derived from the cracking reactions; a solid phase is obtained from the condensation reactions (tar), containing most of the inorganics (ash); finally, a carbon-laden aqueous phase is produced as well [8].
The aqueous phase derived from hydrothermal liquefaction is a primary concern for the development of the technology, as confirmed by the U.S. Department of Energy [9]. It cannot be disposed of without a proper post-treatment; moreover, the recycle of the aqueous phase may be a key element to improve the economic feasibility of the entire pro-cess, significantly reducing the demand for freshwater at the inlet of the HTL reactor [10]. For this reason, some options have been proposed in literature, such as hydrothermal gasification and anaerobic digestion [11,12].
We recently proposed that the water effluent derived from hydro-thermal liquefaction can be subjected to aqueous phase reforming (APR) to produce a gas mixture rich in hydrogen [13]. Aqueous phase * Corresponding author.
E-mail address: samir.bensaid@polito.it (S. Bensaid).
Contents lists available at ScienceDirect
Catalysis Today
journal homepage: www.elsevier.com/locate/cattod
https://doi.org/10.1016/j.cattod.2020.08.013
reforming has been suggested to valorize biomass-derived molecules dissolved in water at moderate reaction conditions (230− 270 ◦C,
autogenous pressure) [14]. It has the potential to minimize two possible limitations of HTL: on one side, it helps to clean the water effluent from its carbon content; at the same time, it produces a valuable chemical (hydrogen) that can be used in-situ to upgrade the biocrude, reducing its oxygen content and increasing its calorific value.
Most of the literature has dealt with the investigation of single model compounds, such as alcohols and polyalcohols [15]. In the previous works, we enlarged the portfolio of possible compounds, looking also at molecules more representative of waste streams deriving from HTL, like carboxylic acids, ketones, aromatics [16]. Moreover, a real aqueous phase derived from lignin-rich hydrothermal liquefaction has been tested, increasing the level of complexity of the investigation [13]. In this context, it has been reported that the process performance strongly depended on the aqueous phase composition. It has been suggested that phenolic oligomers may deactivate the catalyst, leading to the necessity of a liquid-liquid extraction with an organic solvent as pretreatment.
It is widely described in the literature that most of the processes involving lignin as feedstock (such as pyrolysis, hydrothermal lique-faction, supercritical water conversion) suffer the problem of solid de-posit formation. The variability of the reaction conditions and feedstocks led also to different names, for instance, phenolic char, py-rolytic lignin, phenolic oligomers [17]. Several studies have been car-ried out to improve the stability of the bio-oils during storage [18,19] or hinder char formation [20,21]. The same kind of deposit has been found in the juice and wine storage where phenolic molecules are present [22]. The study of pyrolytic lignin highlighted that it contains linkages that were not present in the original lignin, proving the presence of condensation reaction [23]. The catalytic process of valorization of bio-oil has to face the formation of carbonaceous materials from phenols polymerization [24].
The present work aims to investigate the deactivation of the catalyst after the aqueous phase reforming of lignin-rich hydrothermal lique-faction. Multi-component synthetic mixtures have been used to evaluate the contribution of simple aromatics (phenol and guaiacol) and in-organics to the deactivation. Furthermore, physical pretreatment such as the adsorption on activated carbon has been assessed, looking at the influence on the performance of APR. Finally, the degree of deactivation has been evaluated using a model reaction (APR of glycolic acid) as a means of comparison.
2. Material and methods
2.1. Materials
Glycolic acid, acetic acid, phenol, guaiacol, and activated carbon were purchased from Sigma Aldrich. Lactic acid was purchased from Fluka. Deionized water was obtained in the laboratory thanks to a RO Cubic S2 system, whose purification system consists of low-pressure reverse osmosis and ion exchange resins. The aqueous phase derived from lignin-rich hydrothermal liquefaction was kindly furnished by RE- CORD (Renewable Energy Consortium for Research and Demonstration) and prepared as reported in [13]. A developmental 5% Pt/C catalyst was provided by a commercial supplier. Activated carbon (Darco – 100 mesh particle size) used for the adsorption tests was purchased from Sigma Aldrich.
2.2. Aqueous phase reforming experiments
The APR catalytic tests have been carried out in a batch reactor (4566 Parr series) equipped with a 4848-model reactor controller (Parr). 75 mL of aqueous phase were used in each experiment, together with 0.375 g of 5% Pt/C. The air in the reactor was flushed by nitrogen, and the initial pressure was set at 0.3 MPa. The stirring rate was fixed at 400 rpm to prevent external mass transfer limitations. The reaction time was
fixed at 2 h, and the reaction was assumed to start when the set tem-perature (270 ◦C) was reached. An internal cooling loop and an external
water bath were used to quench the reaction at the desired reaction time. The value of the pressure reported by the digital transducer was used to quantify the gas production by the ideal gas law. The gas phase was collected in a syringe and analyzed by μGC. The liquid product was recovered from the reactor, filtered by gravity to remove the catalyst and subjected to TOC and HPLC analysis. The spent catalyst was dried in an oven at 105 ◦C overnight, recovered and weighted.
2.3. Products analysis
The gas phase was analyzed by an SRA Micro-GC, equipped with Molsieve 5A and PoraPLOT U columns, with a TCD detector. The quantification of the gaseous products was performed using the pressure value reported by the transducer at 20 ◦C, using the ideal gas law.
HPLC analysis (Shimadzu) was performed with a Rezex ROA-Organic acid H+(8%) column (300 mm * 7.8 mm). The mobile phase was 5 mM
H2SO4 in water. The flow rate was fixed at 0.7 mL/min and the
tem-perature of the column at 50 ◦C. The products were determined using a
refractive index detector (RID) and quantified by external calibration using purchased standards. Photo diode array (PDA) detector was used to identify aromatic compounds thanks to its higher sensitivity compared to RID.
Total organic carbon (TOC) analysis was performed using a Shi-madzu TOC-VCSH analyzer equipped with a nondispersive infrared
detector.
2.4. Catalyst characterization
A Micromeritics Tristar 3020 instrument was used to measure the N2
adsorption/desorption isotherms of the fresh and spent catalysts at 77 K. The samples were pretreated at 200 ◦C under nitrogen flow for 2 h
through a Micromeritics Flow Prep 060 degassing system. The specific surface area was calculated according to the Brunauer-Emmet-Teller (BET) equation.
The Pt/C catalyst used for the room temperature adsorption of the aqueous phase from lignin-rich HTL was subjected to a washing step using 50 mL of acetone. A GC–MS analysis was carried out on the acetone solution to derive information on the organics present on the surface of the Pt/C catalyst. The components separation was performed using a Agilent 6890 GC equipped with a 30 m ×0.25 mm ×0.25 μm HP- 5 capillary column. The injection port was set at 250 ◦C and the
tem-perature program consisted of a 5 min soak at 50 ◦C, followed by a 10 ◦C/min ramp up to 100 ◦C (held 1 min), a 20 ◦C/min ramp up to 230 ◦C
(held 5 min), and a final 20 ◦C/min ramp up to 300 ◦C (held 15 min). The
compounds were identified by fragmentation patterns from an Agilent 5973 MS.
X-ray diffraction (XRD) was performed through a Panalytical X’Pert Pro diffractometer (Cu Ka radiation). The possible presence of platinum in the solution after the test was measured via a Thermo Scientific iCAP Q ICP-MS (Thermo Fisher).
FTIR spectroscopy analysis was used to determine the functional groups in the solid deposit. The spectra were collected with a Bruker Tensor 27 FTIR spectrometer (Bruker Optics, Billerica, Ma), equipped with an attenuated total reflection (ATR) accessory, between 4000 and 500 cm−1 wavenumbers. The analysis was carried out at room
temper-ature, tightly pressing the sample against the crystal surface. 2.5. Evaluation of APR performance
The results of aqueous phase reforming of the real phase were re-ported using indicators conventionally used in literature.
The carbon to gas conversion, defined as the ratio between the moles of carbon in the gas product molfinCgas and the moles of carbon in the
breakage; the hydrogen gas distribution, defined as the ratio between the moles of hydrogen present in the gas phase as molecular hydrogen (molfin H2) after the reaction and the moles of total hydrogen (i.e.
including alkanes) (Eq.2); the hydrogen productivity was defined as the moles of hydrogen produced divided by the moles of carbon in the feed (Eq. 3). This indicator was particularly useful to express a sort of hydrogen yield in the case of complex mixtures, being impossible the definition of a conventional reaction stoichiometry. Finally, the APR hydrogen yield was used in the case of glycolic acid reforming, defined as the ratio between the moles of produced hydrogen in the gas phase molfin H2 and the moles of feed (it is highlighted here that 3 is added
according to the reaction stoichiometry to reach a maximum 100 % yield) (Eq.4).
Carbon to gas (%) = 100∗ molfinCgas
molinCfeedstock (1) H2gas distribution (%) = molfinH2 molfin(H2+2∗CH4+3∗C2H6+4∗C3H8) (2) H2productivity = mmolfinH2 molinCfeedstock (3) APR − H2yield (%) = 100∗ molfinH2 3∗molinglycolic (4)
3. Results and discussion
3.1. Synthetic aqueous phase – effect of aromatic monomers and inorganics
In our previous work, we hypothesized that the aromatic compounds might interact with the platinum catalyst, drastically reducing the hydrogen productivity [13]. This suggestion derived from the observa-tion that the hydrogen yield monotonically decreased with the increase of the aromatic content in the aqueous phase derived from lignin-rich hydrothermal liquefaction.
In an attempt to evaluate the effect of the aromatic molecules, the composition of the actual aqueous phase was modeled considering five representative compounds. In the following Table 1, the concentration of each compound is reported.
The influence of the aromatics was investigated looking at three different tests: the first one in which the five-compounds mixture was subjected to APR; in the second one guaiacol and phenol were excluded; in the third one only the aromatics were present. In Fig. 1, the com-parison between the 3-components mix (namely Acids) and the 5-com-ponents mix (namely Acids + Aromatics) is reported. Given the different initial carbon content, the comparison of indicators such as the carbon conversion to gas may be misleading; for this reason, looking at quantitative indicators such as the amount of produced gas may be more appropriate.
The 5-components mixture led to the production of a gas phase constituted by carbon dioxide at 50 %, followed by hydrogen at about 30 %. In the liquid phase (Fig. 1B), glycolic acid and lactic acid converted at 100 %, while acetic acid stopped at 30 %. Moreover, propionic acid was produced (16 % yield), likely deriving from lactic acid conversion as
previously suggested in [13]. Please note that the propionic acid yield was defined as the ratio between the moles of propionic acid and the initial moles of lactic acid. At the same time, guaiacol and phenol apparently converted completely, as they were not recognized in the HPLC analysis.
The 3-components mixture, i.e. only constituted by glycolic, lactic and acetic acid, did not show dramatically different results compared to the case in which also the aromatics were present. The total gas pro-duction only slightly increased by 15 %, while in the liquid phase acetic acid conversion increased up to 50 %. It is known from previous studies that in the current working conditions one mole of acetic acid catalyti-cally converted into one mole of carbon dioxide and one mole of methane [13]. Starting from this knowledge, we can perform some calculations. In the 5-components test, about 0.6 mmoles of acetic acid converted, therefore being responsible for 0.6 mmoles out of 0.9 totally produced of CH4 and 0.6 out of 3.4 mmoles in the case of CO2. On the
other hand, in the 3-components test, 0.9 mmoles of acetic acid con-verted, so likely being the reason why methane and carbon dioxide production increased.
The reported results highlight that phenol and guaiacol do not affect the conversion of glycolic and lactic acid, as it was observed in the case of the real aqueous phase reported in [13], where both the acids decreased appreciably their conversion in the case of high concentration of aromatics. For this reason, it can be excluded that aromatic monomers are the cause of the observed deactivation in the actual stream.
For the sake of completeness, a test was performed in which only phenol and guaiacol were present. In this case, the gas production was negligible, highlighting that the aromatic molecules are recalcitrant in the current reaction condition towards the production of a valuable gas (70 mol.% was constituted by carbon dioxide). In the liquid phase, while guaiacol converted completely, phenol converted up to 67 %, and catechol was produced.
It is worthy to highlight here that some carbon balance issues raised when guaiacol and phenol were tested. This was due to the adsorption affinity of aromatics with the carbonaceous support, as reported by [25]. We investigated at room conditions the physisorption affinity of the components of the model mixture to evaluate this phenomenon, sam-pling 1 mL of the solution each 30 min up to 2 h, and the results are reported in the following Fig. 2. When we refer to Relative Intensity in the figure, it is meant as the ratio between the area obtained in the chromatogram by the single component after the adsorption and the area at the initial conditions.
Guaiacol and phenol sharply decreased their concentration after 30 min, with the former being present at about 10 %, while the latter was steadily at 50 %. On the other hand, the concentration of glycolic, acetic and lactic acid was higher. It is known that activated carbons are used for the removal of aromatic pollutants in wastewaters [26]. Villacanas et al. studied the adsorption of model aromatic compounds on activated carbons [25]. The lower concentration of guaiacol and phenol could be explained by the hydrophobic bonding between hydrophobic molecules, like aromatic molecules, and the hydrophobic carbon surface [26]. There was evidence to indicate that guaiacol was adsorbed with a higher extent to the active carbon, being more hydrophobic than phenol because of its methoxy group.
Finally, the effect of inorganics was evaluated using NaCl as a representative compound. 500 ppm of Na were added to the Acids mixture, mimicking its concentration in the actual aqueous phase. The APR of this mixture did not report any worsening of the performance compared to the mixture without inorganics. Even more, the production of methane reduced, leading to an increase in the hydrogen gas distri-bution. The influence of inorganics salts has been poorly investigated for APR. Lehnert et al. suggested that the deactivation observed during APR of crude glycerol was due to the presence of NaCl [27]; however, no experimental evidence was present in their work. On the other hand, Boga et al. ascribed the deactivation mainly to the presence of organic salts (like sodium oleate), studying separately the influence of several
Table 1
Composition of the model aqueous phase tested in the APR set-up.
Compound mol/L
Acetic acid 2.85E-02
Glycolic acid 2.21E-02
Guaiacol 3.29E-03
Lactic acid 1.74E-02
possible poisons [28]. In our reaction conditions, NaCl did not affect the production of hydrogen, therefore it cannot be considered as a poison for the process in the current range.
3.2. Actual aqueous phase – effect of physical pretreatment
It was showed in the previous work that a liquid-liquid extraction with DEE allowed to increase the stability of the catalyst, improving at the same time the hydrogen production [13]. In this work, it was eval-uated the possibility to carry out physical pretreatment to improve the performance of the process. In fact, if it is supposed that high molecular weight compounds are responsible for the deactivation, and if they have a hydrophobic nature, it is possible that they may interact with a solid
sorbent, being removed from the aqueous phase that, afterward, can be subjected to reforming. In the present research, activated carbon was used due to its high surface area and ability to adsorb organic molecules. For the sake of clarity, in the following Table 2, the names of the tests were reported together with a brief description of the pretreatments they have been subjected to.
Two different adsorption conditions were evaluated. The first one was performed at room temperature; in the second one, the same tem-perature of the APR (270 ◦C) was used. In Fig. 3 the results of the
in-fluence of the temperature of the physical pretreatment (AC + HTL-AP and 270 AC + HTL-AP) was compared with the results reported in the previous paper with same reaction conditions [13], where the aqueous phase was reformed without any pretreatment (HTL-AP) and after a liquid-liquid extraction with diethyl ether (DEE + HTL-AP). Finally, a test was performed where both pretreatments were used (270 AC + DEE +HTL-AP).
The APR of HTL-AP led to less than 5% of carbon conversion to gas and negligible hydrogen productivity. This result derived from the small conversion of the mixture components that were prone to hydrogen production, like glycolic acid, glycerol, and methanol. Interestingly, if the APR test was performed after a room temperature pretreatment where the aqueous phase was in contact with activated carbon (AC + HTL-AP), both the indicators improved. The carbon to gas conversion reached 10 %, while the hydrogen productivity raised to 125 mmoles H2/mol C. It is suggested that the phenolic oligomers present in the
solution, because of the affinity with the hydrophobic solid, may be adsorbed into the activated carbon. The depolymerization of lignin during the hydrothermal liquefaction can lead to phenolic monomers and oligomers that are soluble in the water fraction [29]. Decomposition of lignin forms formaldehyde and phenolic monomer (guaiacol, cate-chol, syringol) and it has been reported that cross-linking reactions can occur between these molecules and residual lignin to form solid deposit [21]. In general, HTL and pyrolysis of lignocellulosic biomass form products with a wide range of very reactive molecules (acids, phenols aldehydes, ketones), including also free radicals; these molecules prob-ably repolymerized to form high molecular weight condensation prod-ucts [18]. The aqueous phase post HTL contained, despite in more diluted conditions, the same kind of molecules. Therefore, they may be
Fig. 1. APR results of model mixtures. Reaction conditions: 0.375 g Pt/C, 270 ◦C, 2 h.
Fig. 2. Adsorption of the components of the model mixture. Adsorption
con-ditions: 0.375 g Pt/C, 75 mL Acids + Aromatics solution, room temperature.
Table 2
Description of pretreatments performed on the samples subjected to APR.
Test Pretreatment
HTL-AP APR was performed without any pretreatment of the sample
AC + HTL-AP The sample was put in contact with activated carbon at room temperature for 2 h; afterward, it was subjected to APR 270 AC + HTL-AP The sample was put in contact with activated carbon at 270 ◦C for 2 h; afterward, it was subjected to APR
DEE + HTL-AP The sample was washed with excess DEE; afterward, it was subjected to APR
involved in similar reactions.
When the aqueous phase was subjected to a high-temperature adsorption (270 AC + HTL-AP), the results of APR further improved in terms of carbon conversion to gas and hydrogen productivity. This was an interesting result, which suggested that the temperature influenced the formation of high molecular weight compounds, responsible for the deactivation of the catalyst. Performing the pretreatment at high tem-perature allowed removing some precursors of these deactivating com-pounds, which otherwise were produced during the reaction step (as it happened in the case of AC + HTL-AP). During the storage at low temperature, it has been possible to note the formation of deposit in time (further consideration in paragraph 3.4). As widely pointed out [18,19, 30], the heat increases the aging process: therefore, the high tempera-ture of APR may favor the polymerization reaction and deposit forma-tion. Indeed, even if the reaction was carried out in the absence of oxygen, it has been highlighted that oxidative coupling of phenolic compounds does not require molecular oxygen, being phenol molecules able to react with active sites on the carbon surface itself [31].
Finally, the treatment with activated carbon has been performed also with a sample previously treated with DEE (270 AC + DEE + HTL-AP). In this case, minor differences can be observed in terms of hydrogen productivity compared to the DEE + HTL-AP case; on the other hand, an
improvement in terms of selectivity has been reported. Nevertheless, it will be highlighted in the following that the combination of the two steps allowed to improve the stability of the catalyst.
In Fig. 4, the adsorption of the actual aqueous phase with activated carbon and Pt/C catalyst is reported. First of all, similar trends can be observed between the two experiments, suggesting that at low temper-ature the presence of platinum did not strongly affect the adsorption behavior. However, one phenomenon was particularly interesting and refers to the maximum of adsorption reported at 60 min for phenol and guaiacol. In the case of the synthetic mixture adsorption indicated in Fig. 2, once that the aromatic molecules were adsorbed, there was no change in the product distribution in the liquid phase. The textural analysis of the catalyst reported that the surface area decreased from 831 m2/g of the fresh catalyst to 583 m2/g, and it can be ascribed to the adsorption of phenol and guaiacol.
In the case of the actual aqueous phase adsorption, it seemed that after 60 min a steady state has not been reached. The study of the dy-namic of aromatics adsorption into activated carbon has been majorly explored for a single-component solution. Wang et al. studied the adsorption of a mixture of aromatics into granular activated carbon [32]. It has been highlighted that the solubility and functional groups distribution play a pivotal role in the competitive adsorption capacity. In the current conditions, we suggested that at a first place the aromatic monomers readily interact with the hydrophobic surface of the carbon; however, the oligomers, once overcoming the mass transfer issues (maybe due to their lower diffusion in the aqueous medium) can grad-ually substitute the monomers being less hydrophilic. The textural analysis of the catalyst reported that the surface area was equal to 285 m2/g, much less than the synthetic case, despite the lower adsorption of
the simple aromatics. Therefore, it is likely that the reduction is due to the high molecular weight compounds.
The slight differences in the adsorption trend between activated carbon and Pt/C may be attributed to the different types of support. In fact, despite the pore volume and average pore size are analogous (0.589 cm3/g and 6.45 nm for activated carbon and 0.584 cm3/g and 5.18 nm
for Pt/C), the microporosity is different. It is 0.226 cm3/g for activated
carbon and 0.183 cm3/g for Pt/C (evaluated by t-plot method). Mojoudi et al. reported that phenol adsorption was favored by well-developed porous structure and microporosity [33]. Therefore, the higher value of the latter for activated carbon may be responsible for the higher adsorption capacity (i.e. corresponding to a lower intensity of the peak in the figure) of phenol.
The higher affinity of the phenolic oligomers compared to the monomers can also explain some of the peculiar outcomes of the tests reported before. In Fig. 5, the chromatograms related to synthetic (A) and actual (B) aqueous phase (HTL-AP) are reported. The feeds are
Fig. 4. Adsorption of the actual phase with 0.375 g activated carbon (A) and 0.375 g Pt/C catalyst (B). Adsorption conditions: 75 mL solution, room temperature. Fig. 3. Influence of temperature of physical pretreatment. Reaction conditions:
indicated with a black line, the composition obtained after adsorption with the Pt/C catalyst is depicted in red, while the composition after the APR in blue.
Comparing the chromatograms a) and b), it can clearly be observed that the phenolic compounds were adsorbed in the catalyst (as can be deducted from Fig. 4). After the APR, they completely disappeared.
However, making the same comparison for the HTL-AP (Fig. 5B) it is possible to see that catechol, 3-methoxycatechol, phenol, and guaiacol remained entirely in the liquid phase after the adsorption test; however, analogously with the synthetic mixture, they were removed from the liquid phase during the APR. We proposed that in the synthetic mixtures, where no oligomers were present or formed, the monomers could adsorb during the treatment with activated carbon. On the other hand, in the HTL-AP the formation of longer chain molecules, which have a higher affinity with the carbon, prevented the adsorption of the monomers during the first step. Therefore, it was only during the second step (the APR reaction itself) that they were free to adsorb on the catalyst.
The Pt/C used for the adsorption of the HTL-AP was washed with acetone (50 mL) to get information on the organics present on the sur-face. 25 mL of the solution were left to evaporate to observe high mo-lecular weight compounds. Indeed, the beaker showed some deposits, that were subjected to ATR analysis (paragraph 3.4). 25 mL of the remaining solution were initially concentrated and then subjected to
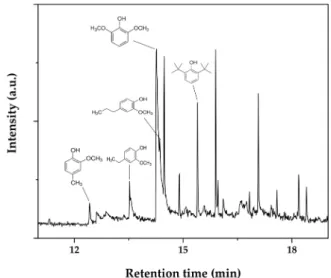
GC–MS analysis (Fig. 6). The spectra revealed the presence of aromatic compounds not identified in the HPLC analysis like 4-ethylguaiacol, 4- propylguaiacol, creosol, and 2,4-di-tert-buthylphenol. These com-pounds were already present in the initial aqueous phase [34]. This test confirmed that not only small molecules such as guaiacol, phenol, and catechol can be adsorbed on the catalyst surface, but also higher mo-lecular weight compounds can interact with the catalyst as well. Further investigation will be addressed to study the influence of the solvent and time of the washing procedure.
3.3. Evaluation of catalyst deactivation
Because of the endogenous nature of the deactivation, it was not possible to evaluate the extent of deactivation conventionally, i.e. re- using the catalyst with a fresh batch of the aqueous phase. Therefore, the APR of a probe molecule (glycolic acid) was used as a reference, whose re-test did not cause appreciable deactivation on the catalyst. The following Fig. 7 shows the obtained results comparing catalysts that derive from different tests.
In Fig. 7, the comparison of the performance after the re-use of the catalyst is reported, together with the information on the surface area.
Fig. 5. HPLC chromatograms (PDA wavelength: 212 nm) of synthetic (A) and actual (B) mixtures on Pt/C catalyst. 1: glycolic acid, 2: lactic acid, 3: acetic acid, 4:
propionic acid, 5: phenol, 6: guaiacol, 7: catechol, 8: 3-methoxycathecol. Adsorption conditions: 75 mL solution, 0.375 g Pt/C catalyst, room temperature, 4 h. Reaction conditions: 75 mL solution, 0.375 g Pt/C catalyst, 270 ◦C, 2 h.
Fig. 6. GC–MS analysis of the acetone solution derived from the washing step
of the Pt/C catalyst. From left to right: creosol, 4-ethylguaiacol, syringol, 4-pro-pylguaiacol, 2,4-di-tert-buthylphenol.
Fig. 7. APR of glycolic acid using second-use Pt/C catalysts and corresponding
textural properties. Reaction conditions: 0.375 g Pt/C, 270 ◦C, 0.9 wt.% C
Starting from the reference test (Fresh), which is the APR of glycolic acid using a fresh catalyst, it can be observed that the APR of HTL-AP led to a strong decrease in both the carbon conversion to gas and the hydrogen yield. This result was associated with a steep loss of surface area, moved from 831 to 162 m2/g. The pretreatment with activated carbon allowed
to increase the performance, with the one at higher temperatures con-firming the improvement compared to the low-temperature adsorption. As a matter of fact, the surface area of the catalyst after high- temperature adsorption was 620 m2/g, while it was 411 after room
temperature adsorption. Moreover, it is interesting to observe that the surface area of activated carbon after adsorption at room temperature decreased from 878 to 145 m2/g, further decreasing up to 119 m2/g at
270 ◦C. When both pretreatments have been performed (i.e. use of DEE
and AC), the catalyst kept most of its original surface area: this result was reflected on the high performance of APR, similar to the ones ob-tained with the fresh catalyst.
In the end, it is highlighted here a preliminary attempt on the regeneration of the catalyst. The catalyst after HTL-AP reforming was subjected to a thermal treatment in inert flow (nitrogen) at 410 ◦C for 2
h. At the end of this step, it was observed that it partially recovered the surface area (447 m2/g); however, it was not sufficient to strongly
improve the performance compared to the HTL-AP case, with only a slight increase of the carbon conversion and hydrogen yield.
Some of the possible reasons were investigated. One possible explanation was the sintering of the particles due to the high- temperature treatment. In Fig. 8, the XRD spectra of the as received (i. e. before its use) and regenerated catalysts are compared. The broad diffraction peak at 2θ = 20− 30◦refers to the amorphous carbon
struc-ture; the diffraction peaks at 2θ = 39.6, 47.4 and 67.1◦refer to the face
centered cubic structure of platinum. Since the two spectra were anal-ogous, leaching was excluded as main deactivation mode. Moreover, re- oxidation of platinum under the hydrothermal reaction conditions was not found, due to the absence of platinum oxide peaks. Poisoning of S- containing compounds was excluded in a previous work [13], while leaching did not occur since ICP-MS did not detect platinum in the HTL-AP and 270 AC + HTL-AP solutions, at the end of the reaction. Finally, it should be considered that, despite the reuse tests have been performed using the same amount of catalyst (0.375 g), it was actually constituted by catalyst plus carbonaceous deposits. In fact, at the end of the reaction with the real aqueous phase, the recovered solid phase weighted more than the original 0.375 g, due to the organics adsorbed on it. Consequently, the effective amount of active sites may vary from one test to the other.
It has been reported that phenolics may adsorb irreversibly into activated carbon so that they cannot actually be removed in water or at
high temperatures [35]. Grant et al. reported that the polymerization of phenolics can occur also on the activated carbon support, and that it was favored by higher temperatures [31].
3.4. Solid characterization
A filtration step was necessary to eliminate the solid particles from the aqueous phase received by RECORD. The use of a simple paper filter was not enough to ensure a clear solution. For this reason, a 0.2 μm PTFE filter was used before the tests. Nevertheless, the mixture was very un-stable; indeed, even if filtered and stored in the fridge, new solids were formed.
The solids in the feed presented a dark brown color. They were characterized by attenuated total reflectance (ATR) spectroscopy to evidence its nature through the identification of some key functional groups (Fig. 9). The broad peak at 3250 cm−1, corresponding to the
O–H stretching, referred to the presence of alcohols, phenols, and carboxylic acids. The band in the range 3000− 2840 cm−1 can be
asso-ciated with the presence of alkyl C–H as it represents the C–H stretching vibrations. Please note that the absorption at around 2300 cm−1 was referred to a noise due to a not perfect compensation of
at-mospheric CO2. The 1200− 1000 cm−1 band was assigned to the C–O
vibrations, therefore it could reveal the presence of acids and phenols. The aromatic skeleton vibration can be identified at 1568 cm-1
associ-ated with C––O stretchings and at 1409 cm-1 associated with C–H de-formations [36]. Finally, the peak at 1315 cm−1 can refer to the
vibration of siringyl with guaiacyl groups [37]. These peaks evidenced the organic nature of the particles and the presence of phenol-derived groups gradually formed during the low-temperature storage of the so-lution. This can be an indication that similar phenomena can be accel-erated during high-temperature treatment.
The catalyst used for the room-temperature adsorption of the actual aqueous phase was washed with 50 mL of acetone for 10 min, as re-ported in paragraph 3.2. The washing solution was left to evaporate to recover solid species present in the surface. Unfortunately, the amount of recovered deposits was barely enough to perform the analysis, leading to a spectrum with lower peaks intensity. Despite the explorative nature of this attempt, the characterization showed a different distribution of the functional groups. The bands associated with the aromatic skeleton at 1568 and 1409 cm−1 were missing; however, the band of the C–H
and CO– stretching vibrations were visible. This result can be due to the fact that the washing step was not able to remove all the species present on the catalyst surface responsible for the observed decrease of surface area during the low-temperature adsorption.
4. Conclusions
The water fraction derived from lignin-rich hydrothermal liquefac-tion has been valorized through APR for hydrogen producliquefac-tion. The objective of the present work was to investigate the phenomena related to the catalyst deactivation. Tests with synthetic mixtures allowed to exclude that aromatic monomers (phenol and guaiacol) and inorganics (NaCl) may be responsible for the decrease of hydrogen production. Different pretreatments of the aqueous phase were carried out to improve the hydrogen productivity, the carbon conversion to gas and the stability of the catalyst. It was observed that performing the adsorption of the aqueous phase with activated carbon at 270 ◦C allowed
to improve the hydrogen yield, likely because phenolic oligomers, formed at high temperature by condensation reactions, block the active sites of the catalyst. The use of both DEE extraction and activated carbon adsorption increased the stability of the catalyst maintaining the orig-inal textural properties. The ATR spectra of the solids formed during the storage confirmed the presence of organics with peaks referring to ar-omatic compounds. The current research allowed to increase the knowledge for the application of the aqueous phase reforming process with complex waste streams, including valuable information on the catalyst deactivation phenomena. Although activated carbon is a good support to improve the dispersion of the active metal, alternative sup-ports that may be inert towards high molecular weight molecules adsorption are under evaluation. Under an industrial point of view, the use of a guard bed constituted by activated carbon may be one possible choice to protect the APR catalyst, due to its low cost; after being saturated, it can be regenerated to avoid a secondary source of pollution. On the other hand, liquid-liquid extraction may be more valuable looking at the HTL-APR integrated system. This is because it allows the recovery of organics that can increase the biocrude yield.
CRediT authorship contribution statement
Giulia Zoppi: Writing - Original Draft and Review, Investigation, Conceptualization. Giuseppe Pipitone: Writing - Original Draft and Review, Investigation, Conceptualization. Camilla Galletti: Investiga-tion (IR), ConceptualizaInvestiga-tion. Andrea Maria Rizzo: Supervision (HTL), Conceptualization. David Chiaramonti: Supervision (HTL), Conceptu-alization. Raffaele Pirone: Supervision, ConceptuConceptu-alization. Samir
Bensaid: Review, Supervision, Project administration,
Conceptualization.
Declaration of Competing Interest
The authors declare that they have no known competing financial interests or personal relationships that could have appeared to influence the work reported in this paper.
Acknowledgment
The project leading to this research has received funding from the European Union’s Horizon 2020 research and innovation program under grant agreement N◦ 764675. Elisa Acciardo is gratefully
acknowledged for the GC–MS analysis and fruitful discussion.
References
[1] D.M. Alonso, J.Q. Bond, J.A. Dumesic, Green Chem. 12 (2010) 1493–1513. [2] S.G. Wettstein, D. Martin Alonso, E.I. Gürbüz, J.A. Dumesic, Curr. Opin. Chem.
Eng. 1 (2012) 218–224.
[3] D.C. Elliott, P. Biller, A.B. Ross, A.J. Schmidt, S.B. Jones, Bioresour. Technol. 178 (2015) 147–156.
[4] S. Bensaid, R. Conti, D. Fino, Fuel 94 (2012) 324–332.
[5] K. Tekin, S. Karag¨oz, S. Bektas¸, Renewable Sustainable Energy Rev. 40 (2014) 673–687.
[6] L. Cao, C. Zhang, H. Chen, D.C.W. Tsang, G. Luo, S. Zhang, J. Chen, Bioresour. Technol. 245 (2017) 1184–1193.
[7] I. Grac̀a, J.M. Lopes, H.S. Cerqueira, M.F. Ribeiro, Ind. Eng. Chem. Res. 52 (2013) 275–287.
[8] J. Watson, T. Wang, B. Si, W.T. Chen, A. Aierzhati, Y. Zhang, Prog. Energy Combust. Sci. 77 (2020), 100819.
[9] Bioenergy Technology Office, Multi-Year Program Plan, 2016.
[10] C.U. Jensen, J.K. Rodriguez Guerrero, S. Karatzos, G. Olofsson, S.B. Iversen, Biomass Convers. Biorefinery. 7 (2017) 495–509.
[11] P.G. Duan, S.K. Yang, Y.P. Xu, F. Wang, D. Zhao, Y.J. Weng, X.L. Shi, Energy 155 (2018) 734–745.
[12] G. Tommaso, W.T. Chen, P. Li, L. Schideman, Y. Zhang, Bioresour. Technol. 178 (2015) 139–146.
[13] G. Pipitone, G. Zoppi, S. Bocchini, A.M. Rizzo, D. Chiaramonti, R. Pirone, S. Bensaid, Catal. Today 345 (2020) 237–250.
[14] R.R. Davda, J.W. Shabaker, G.W. Huber, R.D. Cortright, J.A. Dumesic, Appl. Catal. B Environ. 56 (2005) 171–186.
[15] I. Coronado, M. Stekrova, M. Reinikainen, P. Simell, L. Lefferts, J. Lehtonen, Int. J. Hydrogen Energy 41 (2016) 11003–11032.
[16] G. Pipitone, G. Zoppi, S. Ansaloni, S. Bocchini, F.A. Deorsola, R. Pirone, S. Bensaid, Chem. Eng. J. 377 (2019) 120677.
[17] P. Chen, Q. Zhang, R. Shu, Y. Xu, L. Ma, T. Wang, Bioresour. Technol. 226 (2017) 125–131.
[18] H.N. Lyckeskog, C. Mattsson, L. Olausson, S.I. Andersson, L. Vamling, H. Theliander, Biomass Convers. Biorefinery. 7 (2017) 401–414. [19] R.N. Hilten, K.C. Das, Fuel 89 (2010) 2741–2749.
[20] M. Saisu, T. Sato, M. Watanabe, T. Adschiri, K. Arai, Energy Fuels 17 (2003) 922–928.
[21] K. Okuda, M. Umetsu, S. Takami, T. Adschiri, Fuel Process. Technol. 85 (2004) 803–813.
[22] B. Zou, Y. juan Xu, J. jun Wu, Y. shan Yu, G. sheng Xiao, J. Zhejiang Univ. Sci. B 18 (2017) 854–866.
[23] X. Bai, K.H. Kim, R.C. Brown, E. Dalluge, C. Hutchinson, Y.J. Lee, D. Dalluge, Fuel 128 (2014) 170–179.
[24] A.G. Gayubo, B. Valle, A.T. Aguayo, M. Olazar, J. Bilbao, J. Chem. Technol. Biotechnol. 85 (2010) 132–144.
[25] F. Villaca˜nas, M.F.R. Pereira, J.J.M. ´Orf˜ao, J.L. Figueiredo, J. Colloid Interface Sci. 293 (2006) 128–136.
[26] C. Moreno-Castilla, Carbon 42 (2004) 83–94.
[27] K. Lehnert, P. Claus, Catal. Commun. 9 (2008) 2543–2546.
[28] D.A. Boga, F. Liu, P.C.A. Bruijnincx, B.M. Weckhuysen, Catal. Sci. Technol. 6 (2016) 134–143.
[29] K.R. Arturi, M. Strandgaard, R.P. Nielsen, E.G. Søgaard, M. Maschietti, J. Supercrit, Fluids 123 (2017) 28–39.
[30] X. Hu, Y. Wang, D. Mourant, R. Gunawan, C. Lievens, W. Chaiwat, M. Gholizadeh, L. Wu, X. Li, C.Z. Li, AIChE J. (2013).
[31] T.M. Grant, C.J. King, Ind. Eng. Chem. Res. 29 (1990) 264–271.
[32] W. Wang, S. Pan, R. Xu, J. Zhang, S. Wang, J. Shen, Desalin. Water Treat. 56 (2015) 770–778.
[33] N. Mojoudi, N. Mirghaffari, M. Soleimani, H. Shariatmadari, C. Belver, J. Bedia, Sci. Rep. 9 (2019) 1–12.
[34] S. Dell’Orco, E. Miliotti, G. Lotti, A.M. Rizzo, L. Rosi, D. Chiaramonti, Energies 13 (2020) 1241.
[35] A. Da̧browski, P. Podko´scielny, Z. Hubicki, M. Barczak, Chemosphere 58 (2005) 1049–1070.
[36] M.S. Jahan, D.A.N. Chowdhury, M.K. Islam, S.M.I. Moeiz, Bioresour. Technol. 98 (2007) 465–469.