HAL Id: hal-03025788
https://hal.archives-ouvertes.fr/hal-03025788
Submitted on 26 Nov 2020
HAL is a multi-disciplinary open access
archive for the deposit and dissemination of
sci-entific research documents, whether they are
pub-lished or not. The documents may come from
teaching and research institutions in France or
abroad, or from public or private research centers.
L’archive ouverte pluridisciplinaire HAL, est
destinée au dépôt et à la diffusion de documents
scientifiques de niveau recherche, publiés ou non,
émanant des établissements d’enseignement et de
recherche français ou étrangers, des laboratoires
publics ou privés.
Mobile Relays for Urban Rail Transportation Systems
Mauricio Iturralde, Tanguy Kerdoncuff, Thomas Galezowski, Xavier Lagrange
To cite this version:
Mauricio Iturralde, Tanguy Kerdoncuff, Thomas Galezowski, Xavier Lagrange. Mobile Relays for
Urban Rail Transportation Systems. Telecommunication Systems, Springer Verlag (Germany), 2020,
�10.1007/s11235-020-00735-0�. �hal-03025788�
Mobile Relays for Urban Rail Transportation Systems
Mauricio Iturralde, Tanguy Kerdoncuff, Thomas Galezowski
Xavier Lagrange
November 26, 2020
Abstract
Assuring an uninterrupted high Quality of Service (QoS) of railway communications between on–board terminals and base stations creates challenges for the provider. This is partly explained by the inherent mobility and the high penetration loss of carriages. Deploying mobile relays in public transportation is possible with a 100%-compatible LTE/EPC architecture. This effectively ensures that the electromagnetic insulation is kept to a minimum as QoS on board can be dramatically affected and worsened within the railway vehicles. Yet all users’ traffic congregates via the radio backhaul link and needs to take into consideration the extra packet-overhead and signaling messages that as a general rule get transmitted via the fixed links. The paper’s aim is to analyze the perfor-mance of mobile relays in loaded conditions comparing this to the standard direct mode. We propose an analytical model to compute the signaling rate. We parametrize it with experiments done on a testbed with real radio transmissions and show that signaling has no major impact on performance. We then evaluate the QoS experienced by passengers by means of simulations for two representative services: Web browsing and voice communications. The packet loss ratio for voice communications is reduced at the expense of a slight end-to-end latency increase thanks to mobile relays. During the high load conditions there is a significant reduction in the load time of a Web page and the throughput is increased.
Keywords ; LTE, EPC , 4G, mobile relay, QoS, signaling, handover, mobility management, perfor-mance analysis, railways
1
Introduction
The use of wireless broadband services has risen significantly with the deployment of Long Term Evolution (LTE) networks and the generalization of smart phones, tablet computers and other new mobile devices. People make intensive use of these devices when they are on public transport vehicles such as buses, trams, or trains.
According to Ericsson’s mobility report [14], the number of mobile broadband subscriptions grew 10 percent year-on-year, increasing by 120 million in Q3 2019. The number of smartphone subscriptions is forecast to reach 7.4 billion in 2025, or 83 percent of all mobile subscriptions.
The quality of service in public transportation remains far from adequate. Vehicles are usually well shielded with coated windows, which leads to a rather high electromagnetic penetration loss between outdoor and in-vehicle. Commonly encountered, the User Equipments (UEs) moving within public trans-port vehicles are connected to Evolved Node B (eNB) via wireless links, in which the penetration loss critically attenuates the signal quality and downgrades the accomplishable data rate.
Public transportation is vital for the development of major cities, especially in the context of global warming. ”Soci´et´e du Grand Paris” (SGP) will create 200 km of subway lines called ”Grand Paris Express”. The metros will connect the main economic and logistical activity zones, including the three Paris airports. As part of the service, SGP would like to give an incomparable customer experience regarding the internet access during their trip to the expected 2 million daily passengers. SGP is thus promoting the emergence of innovations to reach this goal.
Deploying mobile relays with both an outdoor antenna to communicate with the cellular network and an indoor antenna to provide good coverage to passengers is a natural solution to provide a high Quality of Service (QoS). However, the mobile relay is like a remote base station wirelessly connected to the network infrastructure, which should control it. Thus, there are signalling exchanges between the relay and the fixed network. The question is to check that the capacity gain brought by mobile relays is not compromised by additional signalling.
By performing real radio transmissions with a testbed in [22] we proved that a mobile relay architecture can be easily implemented with standard Evolved Packet Core (EPC) and with full compatibility with 3GPP recommendations. We evaluated the performance of this relay architecture by means of simulation in loaded conditions in [21]. In addition to a Voice over Internet Protocol (VoIP) service, we considered a simple client-server protocol. We found that the mobile relay architecture can improve the QoS but we did not simulate real handovers.
Our objective in this paper is to conduct a more in-depth study of mobile relay performance. From a general point of view, the bit rate of mobile networks is limited by the radio interface. With mobile relays, there are two radio interfaces: the access radio interface in the train is the same as for a standard network and can provide high bit rate due to short range transmissions, while the backhaul radio interface is specific to the relay solution. Furthermore, it gathers the links between all terminals and the fixed network infrastructure. The backhaul is thus the bottleneck of the system. Though we consider the whole network, we focus on the backhaul link. In addition to our previous work [21, 22], we study the signaling load on the backhaul, we consider a Web service instead of a simple client-server exchange and we integrate handover.
Our contribution is two-fold:
we propose a general analytical model to compute the signaling load generated by terminal dis-connection and re-dis-connection due to inactivity, useable both for standard mobile networks and networks with relays,
we evaluate the quality improvement provided by mobile relays, with a particular focus on the periods for which this quality is low (i.e. when the metro or the train enters a new cell).
The remainder of this paper is organized as follows: in Section 1 we present the state-of-the-art of mobile relay in LTE. In Section 3 we depict the architecture and the protocol stack when mobile relays are used. In Section 4 we study the impact of signaling in the relay architecture. In Section 5 we describe our simulation scenario, including the traffic models, and we present our QoS parameters. In Section 6 we present and analyze the simulation results. Section 7 concludes our paper.
2
State of the art on mobile relays
Several studies related to mobile relays for railways have been found in the literature. Since there are many sub fields of research related to mobile relays, we have classified this state-of-the-art into several families based on their common characteristics.
2.1
Mobile Relay Architectures
The concept of mobile wireless access points was proposed in the early 90’s in the first European projects [2]. However, there was neither real implementation nor deployment for 25 years. There has been a resurgence of interest with the advent of LTE-EPC.
The Third Generation Partnership Project (3GPP) considered several possible architectures for mobile relays in [18]. Some of the suggested solutions compel the modification of several protocols which leads to an eminent standardization effort. Nevertheless, the first alternative called Alt-1 described in [18]
is founded on two facts: nodes of the EPC, such as Mobile eNB (eNBm), Mobile Management Entity (MME), just need Internet Protocol (IP) connectivity and, second, IP connectivity can be simply supplied by an LTE/EPC network.
A solution based on mobile relays was studied in [39]. Parameters such as Doppler frequency shift, penetration loss, system capacity planning and mobility management in high-speed railways were ana-lyzed.
In [10] the relay node architectures Alt-1 and Alt-2 are studied. The authors provide a short analysis of Alt-1 and Alt-2 in terms of performance. The authors propose a Proxy Mobile IP (PMIP) mechanism with existing LTE Rel-10 relay architecture, in order to support mobile relay with minimum standardization impacts. In [15] an evaluation of the backhauling relay in LTE is performed. The backhaul is done by an LTE dongle that performs a second GPRS Tunneling Protocol (GTP) encapsulation. The authors claim that the self-backhauling network makes it possible to extend the radio coverage of the conventional LTE network and can improve the throughput of the network.
In [6] the authors study the effect of amplify-and-forward mobile relays on coverage under high mobility scenarios, as well as the loss in throughput for indoor UEs compared to outdoor UEs. They consider two scenarios: with mobile relays and without mobile relays. The performance of mobile relays in terms of coverage is evaluated. They show that the gain of mobile relays attains 17 dB and 12 dB for Reference Signal Received Power (RSRP) and Reference Signal Code Power (RSCP), respectively. On the other hand, throughput exhibits a large gap between outdoor and indoor UEs under the ”no mobile relay” scenario.
A carrier aggregation-supported mobile relay for railway LTE-A networks is proposed in [4]. The performance of this scheme is evaluated in terms of average user throughput, packet loss and outage probability. The results presented by the authors show that better performance can be accomplished by applying dual backhaul links with a carrier aggregation scheme.
2.2
QoS and Performance studies
The performance of multiuser Multiple-Input-Multiple-Output (MIMO) in base stations and moving relay nodes in LTE is evaluated in [26, 27, 34]. According to the authors, both on-train users and macro cell users get better throughput by deploying MIMO. In [7, 8] a performance study of mobile relays in LTE and LTE-A networks is presented for railway scenarios. The authors investigate the issue of mobile relay capacity improvement for on-board train users and its impact on the overall network performance. The authors show that the addition of mobile relay nodes can improve the overall cell network performance in the railway environment. In [11], stochastic geometry is used to compute the throughput and the energy consumption of a network with mobile relays. However, the analysis is based on snapshots and does not consider the dynamic nature of the traffic.
In [29], the authors present an experimental performance analysis in extreme traffic and density conditions for mobile relays. This article focuses on a load-stress test specifically designed for the two-hop architecture that enables on-board connectivity in high-speed trains. In [23] the authors propose a mechanism to efficiently select the appropriate number of mobile relay nodes and receive antennas in relation to the throughput performance and capital expenses in the train. According to the authors, the use of multiple mobile relay nodes and antennas on the high speed train enables spatial multiplexing gains and reduces the handover failure rate since multiple relay nodes will not perform handover processes at the same time. However, this method seems to be expensive in terms of having multiple relays in trains. There is also no information about the user load in their experiments. In [37] a study focusing on the resource allocation problem for local users (low-mobility users) and the mobile relay in a high-speed train in the same Orthogonal Frequency-Division Multiple Access (OFDMA) system is presented. Under this mobile relay architecture, passengers communicate with base stations via a mobile relay. Then all passengers in the train can be treated as one large user represented by the mobile relay. The authors focus on the problem in two cases where perfect Intercarrier Interference (ICI) cancellation and no ICI cancellation are applied to the mobile relay. A resource allocation for high-speed trains equipped
with multiple moving relays in OFDMA systems is studied in [20]. The authors propose a solution to minimize the total transmit power consumption, while serving the passengers by meeting their required throughput. According to the authors, their proposed scheme using moving relays outperforms some previously proposed algorithms, as well as direct transmission. A recent study [38] focuses its research on an asymmetric mobile relay architecture for High-Speed Trains (HST) in 5G networks. In order to avoid high penetration losses of the direct link between the base station and the UEs inside carriages, a mobile relay is deployed at the HST. In the relay architecture the authors propose the use of sub-6GHz frequency for the BS-relay link and the adoption of a millimeter wave frequency fot the relay-UE link.
2.3
Signaling Load with mobile relays
To the best knowledge of the authors, there is no study on the signaling load in wireless networks when a mobile relay is used. More generally, there are only a few publications on signaling load in LTE/EPC. In [31], a mathematical model based on queuing networks is proposed in the case of virtual MME. Though the model could be adapted for standard MME, the reading time of a Web page is assumed to be exponentially distributed. Another close model is defined in [30] to analyze the performance of a dynamic auto-scaling algorithm of control plane resources. The authors assume that a terminal goes back to idle mode at each reading period, which is not true when the reading time is short.
2.4
Handovers in Mobile Relay Nodes
Several studies focus on handover performance on mobile relays. In [28] a study tackles the handover problem within a relay architecture for high-speed rail in LTE-A networks. The authors propose a new handover scheme. Based on the fact that a train travels in fixed trajectories, the proposed measurement procedure can shorten the handover time, according to the authors. In [33] the authors study handover performance based on dual antennas and mobile relay for high speed railways. This work focuses on reducing the handover outage probability.
In [24] another study focuses on minimizing handover failure and link outage probabilities. According to the authors, the proposed mechanism can reduce unnecessary handovers, handover failure, and link outage probability. In [9], a handover authentication mechanism based on trajectory prediction for mobile relays is proposed. Compared with the current 3GPP standards and other related schemes, according to the authors this scheme effectively reduces handover delays and at the same time provides strong security protection.
A handover scheme for a dual-link system architecture is proposed in [36]. This mechanism aims to minimize the communication interruption during handover. The proposed scheme uses two antennas to prevent the communication from being interrupted during handover. The authors analyze their proposed mechanism in terms of handover probability, handover failure probability and communication interruption probability. In [25], the authors seek to find an appropriate power allocation scheme to achieve a trade-off at handover between the transmission rate and the delay. According to the authors, the proposed power allocation scheme can reduce delay at the cost of slightly reduced capacity.
The authors of [40] show that the communication interruption is longer than the time to switch the processes in the physical and the Medium Access Control (MAC) layers due to queuing mechanisms. They propose an improved switch mechanism in order to ensure the continuity of communication.
Although fields such as handover improvement, architecture modifications and allocation algorithms for mobile relays are proposed among the aforementioned studies, none of them has studied in detail the Alt-1 3GPP alternative in terms of signaling and quality of service. To the best of our knowledge, there are no studies related to the effect of this relay architecture on the main services used by passengers, such as Web browsing and VoIP calling.
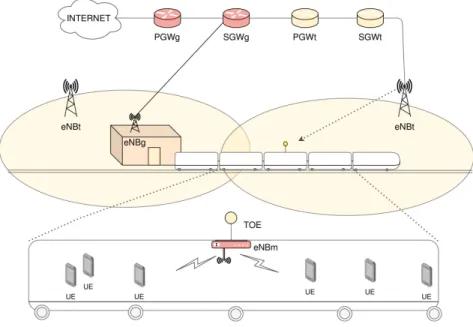
Figure 1: Mobile relay architecture
3
Relay Architecture
3.1
Overview of the architecture
Our mobile relay solution is based on 3GPP Alt-1 [17]. We chose this solution because the other ones (namely Alt-2 to Alt-4) need additional software development. Two EPC are used. The first one is called EPCt for track and all nodes are identified with the same suffix (eNBt, MMEt, SGWt, etc.). No user terminal can access this network. The second network is the general network (identified by suffix g, MMEg, SGWg, PGWg), which manages passenger terminals. The relay is made of a UE called Transport Operator terminal Equipment (TOE) that can access the EPCt and an embedded base station called eNBm (suffix m for mobile). It is important to highlight that eNBms have access to the general network through the track network: an eNBm is connected to a TOE and can thereby exchange messages with the Global Mobile Management Entity (MMEg) and the Global Serving Gateway (SGWg). In stations, some eNB provide coverage of the platform: they are directly connected to the general network and are thus called eNB connected to the global network (eNBg).
This architecture is 100% compatible with the 3GPP recommendations and does not require any modification of the protocol stacks or the hardware (Fig 1). Note that any eNBm have an S1 interface with an SGWg and can have an X2 interface with an eNBg. Messages exchanged on these interfaces are transmitted on the backhaul link (between the TOE and the Track eNB (eNBt).
EPCt is used as a transport network for EPCg. Note that several EPCgs can be connected to the same EPCt and thus use the same shared relay infrastructure. EPCt can be deployed by a specific operator or by a mobile network operator as it is done with Radio Access Network (RAN) sharing.
One important benefit of mobile relay is that mobile management is no longer done on an individual terminal basis, but rather at the relay level. When a terminal is attached to the network through the relay, the terminal is considered as being under the coverage of the mobile eNB and is fixed as long as the user stays in the train. If the train moves to another cell, a single handover command is sent to the TOE but applies for all terminals connected to the mobile eNB.
S1-AP IP (user) GTP-U UDP IP SCTP IP PDCP PDCP RLC RLC MAC Physical layer (radio)
Protocol Stack on the backhaul (TOE-eNBt) User Data eNBm-MME-g S1-MME signaling User IP payload IP header UDP header GTP-U header IP header MAC/RLC/PDCP header S1-AP message that possibly includes a NAS message SCTP header IP header MAC/RLC/PDCP header Headers for a user packet on the backhaul Headers for a signaling message on the backhaul 6 20 8 12 20 6 20 44 bytes bytes
Figure 2: Protocol stack and different headers on the backhaul
3.2
Analysis of the header sizes
As shown in figure 2, the counterpart of mobile relays is additional headers. Due to the use of two EPC networks there is an additional level of encapsulation and thus extra-headers (right part of figure 2) compared to a standard architecture.
In a standard radio interface, a user IP packet is transported by Packet Data Convergence Protocol (PDCP) and the header size due to PDCP, Radio Link Control (RLC) and MAC is typically 6 bytes. With IPv4, the IP header is 20 bytes. The header size including IP is thus 26 byte. With a relay, the tunnel is set over the radio backhaul. The following headers are thus added to each tunneled packet: 12 bytes for GTP [16] (or 8 bytes if there is no numbering), 8 bytes for User Datagram Protocol (UDP) and 20 bytes for IP. The total header size is thus 26 + 40 = 66 bytes.
For Radio Resource Control (RRC) signaling messages, the header is also 6 bytes for a standard radio interface. Most signaling messages include a Non-Access Stratum (NAS) part and are thus exchanged between the terminal and the MME. When a mobile relay is used, they are exchanged between the terminal and the MMEg through the backhaul. The additional header is due to the use of IP, Stream Control Transmission Protocol (SCTP) and S1 Application Protocol (S1-AP) protocols. The structure of SCTP messages is complex [35]. We assume that a message includes the standard SCTP header (12 bytes), an acknowledgement chunk (16 bytes) and a data chunk (the header is 16 bytes), which gives a total of 44 bytes. From IP to S1-AP (excluded), the total header size is thus 6 + 20 + 44 = 70 bytes.
4
Signaling Analysis
4.1
Overview of the test-bed
4.1.1 General architecture
The test-bed is built on the Amarisoft solution [5], which is fully compatible with off-the-shelf terminals. Digital signal processing and all the protocol stacks in their entirety are pure software operations running on a standard PC. The high-frequency radio signal is generated and sampled by a radio module. We use several instances of Amarisoft: one on a PC, which acts as the eNBg; a second one with an LTE-dongle
and a radio module, which acts as a relay (eNBm and ToE); and a third one, which acts as the eNBt and includes core network functions (MMEt, SGWt, PGWt, MMEg, SGWg and PGWg) and which is connected to the local fixed network and the eNBg (see figure 3). An additional computer is used as a controller to have automatic tests.
Figure 3: Implementation of the test-bed
The transmission is made in frequency division duplex mode in the 2.6 GHz band. In order to avoid interference between the access and the backhaul links, two separate carriers are used. The bandwidth for each carrier is 5-MHz to avoid processing overload in the computer.
4.1.2 Tested scenarios
Our focus is on the signaling load. The main part is due to mobility management. With mobile relay, there is only one handover for all terminals when a moving train enters a new cell. The signaling load is thus very low. Furthermore, this type of handover was analyzed in our previous work [22] and we do not consider it in this paper. However, at a station there are multiple mobility scenarios as shown in Figure 4, which should be studied.
We thus consider the following scenarios:
a user with a terminal in idle mode enters a train, a user with a terminal in idle mode leaves the train,
a user with an active session (terminal in connected mode) enters a train, known as an on-boarding handover,
a user with an active session leaves the train, known as an off-boarding handover,
a user can of course stay in the train but this does not in itself generate specific signaling.
The sporadic nature of data flows also generates signaling between an eNB and the core network. We thus consider the following cases:
a user does not use his/her terminal for a while and the eNBm triggers an RRC release, putting the terminal back in idle mode,
a user uses his/her terminal after a pause and the RRC is resumed, a procedure known as a Service Request.
4.2
Size of signaling messages
Table 1: Signaling for on-boarding handover on the S1 (example)
Source Desti-nation
Back-haul
Proto-col Size Name of the message eNBg eNBm D X2AP 1128 HandoverRequest eNBm eNBg U X2AP 138 HandoverRequestAcknowledge
eNBg eNBm D X2AP 39 SNStatusTransfer eNBm MMEg U S1AP 69 PathSwitchRequest MMEg eNBm D S1AP 56 PathSwitchRequestAcknowledge
eNBm eNBg U X2AP 19 UEContextRelease eNBm MMEg U S1AP 108 Tracking area update request MMEg eNBm D S1AP 53 Tracking area update accept
eNBm MMEg U SCTP 0 SACK eNBg eNBm D SCTP 0 SACK
Total size D 1276
U 334
Number of D 4 AP messages U 4
We ran each procedure listed in section 4.1.2 on the testbed. We analyzed the number of messages and the size of each message on the S1-interface between the eNBm and the MMEg or on the X2-interface between the eNBm and the eNBg. Note that we only consider messages transmitted on the backhaul link because it is the interface specific to mobile relaying. Signaling on other interfaces is exactly the same as that in a standard mobile network. An example is shown in table 1 for on-boarding handover. For each procedure we count the number of S1AP and X2AP messages and the total number of bytes for downlink and uplink. We assume that pure SCTP messages (e.g. SACK) are piggy-backed by application messages. We thus assume that the final SACK shown in table 1 for a given UE are included in signaling messages concerning other UEs. As explained in section 3.2, the additional header size from the physical layer up to SCTP is 70 bytes. From table 1, we get a total number of uplink signaling bytes for on-boarding handover of 334 + 4 × 70 = 614 (and 1276 + 4 × 70 = 1556 for downlink). The results for all procedures are computed with the same method and are shown in table 1.
Table 2: Signaling sizes for different scenarios
Downlink Uplink Scenario Number of messages Total number of bytes Number of messages Total number of bytes idle-mode on-boarding 3 399 2 233 idle-mode off-boarding 0 0 0 0 on-boarding handover 4 614 4 1556 off-boarding handover 2 1420 3 534 RRC disconnection 2 184 1 91 RRC connection 2 237 1 232
4.3
Signaling for On-boarding and Off-boarding
In this subsection, we evaluate the signaling load when passengers enter or leave a train at a station. As shown in table 2, there is far less signaling for on and off boarding for a terminal in idle state than in connected state. We thus consider a scenario in which all passengers have a terminal in connected state, which is clearly a worst case scenario. Based on the estimation of SGP, the train stop was assumed to be 45 seconds. In peak hours, there are up to 1000 passengers in a train. Up to half of the people get off at an important station and the same amount get on. We thus assume 500 off-boarding and 500 on-boarding handovers.
The average signaling bit rate Sd in kbps on the downlink is thus (from table 2):
Sd= 500 × 8 ×
614 + 1420
Similarly, the bit rate Su on the uplink is:
Su= 500 × 8 ×
1556 + 534
1000 × 45 = 186 kbps. (2)
An upper bound of the signaling rate due to on and off boarding is thus 190 kbps both for the uplink and the downlink. This signaling is transmitted when the train is in a station and thus fixed. The link budget can be easily optimized. With a 20-MHz FDD radio interface and a 2 × 2 MIMO, the maximum bit rate is 150 Mbps. If we assume that the average capacity is 50% of the maximum bit rate, the amount of signaling is thus 0.25% of the capacity, which is quite low.
4.4
Activity model of terminals
In this sub-section, we characterize the signaling load due to the sporadic nature of data flows: there are frequent RRC disconnections and reconnections. We first present the analytical model and then use it to compute the signaling load.
4.4.1 Source traffic model
For any positive random variable tX, let fX(t), FX(t) and FX(t) be its probability density function
(PDF), cumulative distribution function (CDF) and complementary CDF (CCDF), respectively. Note that ifR∞
0 FX(t)dt exists, then this integral gives the expectation E[tX] of tX.
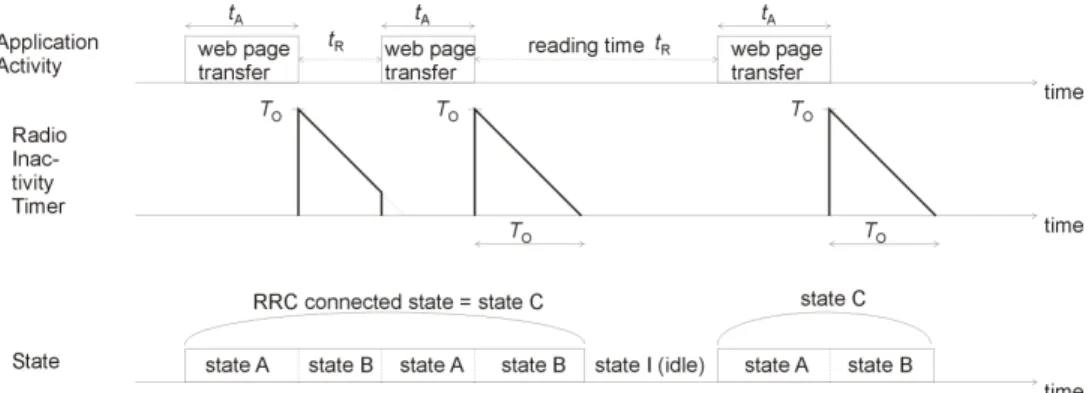
We consider the model inside a Web browsing session as illustrated in the top part of figure 5 (see also figure 7). The user downloads Web pages: the time to download is modelled as a random variable tA
(A stands for activity). The user then reads the page and we similarly define tR (R stands for reading).
The distributions of tA and tR can be general. The only assumption we make is that tR and tA are two
independent variables: the value of tA has no influence on tR.
As long as the download is progressing, an RRC connection is maintained. Just after the end of the loading phase, an inactivity timer is launched. Let TO be the initial value of the timer. If another Web
page is requested before the timer expires, the UE stays in RRC Connected state. In other cases, a radio resource release procedure is triggered and the terminal switches to state I (for idle). As soon as a new transfer is activated, a Service Request Procedure is executed. An example of this scenario is given in figure 5.
A terminal can be in 3 states, namely A, B and I, as shown in figure 6. State B corresponds to at most the first TOseconds after the end of the page transfer. Note that the terminal is in RRC connected
state for both A and B. We thus define state C as including both states A and B.
Our objective is to compute the probability for a terminal to be in idle state and the average number of service request procedures per time unit. Note that the average number of radio resource release procedures is equal to the average number of service request procedures at the equilibrium.
4.4.2 Idle state probability and average service request rate
We first consider a UE that switches to idle mode. When entering state I, TO of the reading phase has
already been used in state B. Thus, tI= tR− TO. Hence, by using the formula of conditional probabilities
P(tI> t) = P[tR> t + TO/tR> TO] =
FR(t + TO)
FR(TO)
. (3)
For any positive random variable, the mean is the integral of the CCDF if this integral converges. The mean idle time is thus:
E[tI] = Z ∞ 0 P(tI> t)dt = R∞ TOFR(t)dt FR(TO) . (4)
Figure 5: Illustration of activity and reading times
Figure 6: Activity model with related RRC states
We now want to determine E[tC]. A UE can stay in state C while switching an unlimited number of
times from state A to state B and reciprocally. The finite sate machine that corresponds to states A, B and C and the possible transitions is a memoryless process. We can use renewal theory [12]: let consider a terminal that was in idle state and for which a transmission phase starts. The initial state is A. The expected remaining time is E[tC]. The UE makes at least one transmission during E[tA] and then
with probability P[tR ≥ TO] = FR(TO), the UE stays in state B during TO and then switches to
idle state,
with probability P[tR< TO] = FR(TO), it stays in addition in state B during E[tR/tR< TO] and
then switches again to state A. Thus, the expected remaining time is E[tC].
From the above, we get:
E[tC] = E[tA] + FR(TO)TO+ FR(TO) (E[tR/tR< TO] + E[tC]) . (5)
By definition, E[tR/tR< TO] =
RTO
0 tfR(t)dt/FR(TO). By integration by parts, we get:
E[tR/tR< TO] = −FR(TO)TO+ RTO 0 FR(t)dt FR(TO) . (6)
Combining (5) and (6) and after some elementary computational steps, we get
E[tC] = E[tA] + RTO 0 FR(t)dt FR(TO) . (7)
When we consider states I and C, we have a simple 2-state process where the terminal is alternately in one of the two states. The average number of transitions λt per unit time from RRC idle state to
RRC connected state is thus λt= 1/(E[tC] + E[tI]). From (4) and (7), we deduce
λt=
FR(TO)
E[tA] + E[tR]
. (8)
The probability ΠI of being in state I is E[tI]/(E[tC] + E[tI]). We get
ΠI=
R∞
TOFR(t)dt
E[tA] + E[tR]
. (9)
The authors of [32] carried out a very large measurement study but on fixed computers. They found that reading time follows a log-normal distribution. The average reading time is 39.7 seconds and the standard deviation is 324.92 seconds. This corresponds to µ = 1.5717 and σ = 2.0541 and not to µ = −0.495204 and σ = 2.7731 as indicated in [32]. From section 6.1, we get E[tA] = 10 seconds. This
value was obtained for a moderate number of passengers (100). If there are more passengers, E[tA] is
larger and the number of disconnections/reconnections per unit time is smaller. Hence, regarding the signaling load, we consider the worst case.
We consider a range from 0 to 10 seconds for radio inactivity timer TO. Using (8) and (9), we compute
the service request rate and the probability for a terminal to be in idle state, respectively, as shown in table 3.
Table 3: Service Request rate and idle-state probability for different timer values when the reading time is a log-normal random variable with mean 39.7 s and E[tA] = 10 s
Initial value of the timer (TO) 0 s 2 s 5 s 10 s Idle state probability 0.79 0.76 0.73 0.69 Service Request rate (s−1) 1/50 1/75 1/101 1/138
A commonly agreed value for TO is 5 seconds. In that case, λC= 1/101 service requests per second
for a given terminal. For each connection request, there is a corresponding resource release procedure. For a train with 1000 passengers (all using their smart phones), there are 2 × 1000/101 = 19.8 signaling requests per second. The corresponding signaling bit rate is deduced from table 2. We get 1000 × 8 × (184 + 237)/101 = 33.4 kbps on the downlink and 1000 × 8 × (91 + 232)/101 = 25.6 kbps on the uplink. Considering a a 20-MHz system and a 75-Mbps capacity, this represents less than 0.05 % of the bit-rate. To conclude, if we consider both user mobility (see 4.3) and the sporadic nature of the data flows (see 4.4), the signaling load represents less than 0.3 % of the backhaul capacity. It is thus quite low and does not have a major impact on the performance of the system. We thus neglect it in section 5.
5
Performance Analysis in Loaded Conditions
In this section, we analyze and test the achievable benefits brought by the deployment of mobile relays in loaded conditions. Our benchmark is a network without any relay, which we call direct mode. We consider two representative services, namely Web browsing and telephony.
5.1
Transmitted Services
5.1.1 Web browsing
We consider a Web browsing service as shown in figure 7. The UE sends a request for a Web page to a server. The page generated by the server consists of one main object (which can be seen as files) and a random number of inline objects, which can be texts, photos or videos. Once the reading time is elapsed,
UE
Server
HTTP request inline object new HTTP request Reading time main object inline object time trq,u tfp,u tlp,u Server response time Reception time Load timeFigure 7: Web service model
a new request is sent to the server by the UE. The application protocol is HyperText Transfer Protocol (HTTP) over Transmission Control Protocol (TCP).
The Web browsing model is the one defined in [32]. The parameters we used for the simulation are given in table 4 and are similar to the ones in table II of [32]. Note that the authors do not base the fitting between the measurements and the parameters of the r.v. on the mean and the standard deviation. We thus recompute the parameters to get exactly the same means and the standard deviations as in [32]. The average reading time is 39.7 seconds.
Table 4: Parameters of the Web model
Element Random Variable Mean Std Deviation Main object size Weibull λ = 19104, k = 0.772 22 200 bytes 29 100 bytes Number of inline objects Exponential µ = 31.93 32.4 31.9 Inline object size Log-normal µ = 8.913, σ = 1.245 16 200 bytes 31 400 bytes Total page N.A. 548 000 bytes 1 520 000 bytes
5.1.2 Voice calling service
In 4G networks, voice calling is based on VoIP. End users are generally sensitive to the one-way delay and the packet loss rate. In order to avoid any problems due to possible echoes and to keep an excellent interactivity between the two parties, a maximum of 150 ms one-way latency is recommended by the ITU-T G.114 [3].
Since this includes the entire voice path, part of which may be on the public Internet, the LTE/EPC network should have a transit latency down from 150 ms to guarantee a decent QoS.
The GSM Enhanced Full Rate (EFR) is one of the most representative speech codecs [19]. A 244-bit data block is sent every 20 ms, this gives a rate of 12.2 kbps. There is generally a Cyclic Redundancy Check (CRC) that is added.
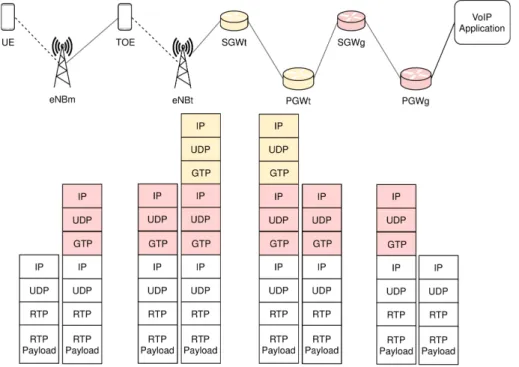
We simulate the aforementioned EFR codec or equivalently an AMR-WB codec in 12.65-kpbs mode. The source traffic generates a 32-byte payload every 20-ms. Voice is transmitted in Real-time Transport Protocol (RTP) packets. No voice activity detection is simulated. Therefore, the flow is constant bit rate. We consider the same header sizes as in section 3.2: the total header size for PDCP, RLC and MAC is 6 bytes and for GTP, UDP and IP is 40 bytes. The RTP header is 12 bytes. The headers on each interface are shown in Figure 8. We assume the calls are set up prior to the simulation and did not consider any call arrival and call release. No voice-call signaling is simulated.
Figure 8: VoIP packet headers in relay architecture.
5.2
QoS Parameters
For Web browsing, the main QoS indicator is the Web page load time but we also consider server response time and the throughput. All indicators are defined below. For VoIP, we consider end-to-end latency, jitter and packet loss ratio (with the standard definitions).
5.2.1 Server Response Time
This indicator is computed for each request u as
ηu= tfp,u− trq,u (10)
where, tfp,u is the time stamp of the first packet of the main object received by the UE and trq,uis the
5.2.2 Page Reception Time This indicator is computed as
ξu= tlp,u− tfp,u (11)
where tlp,uis the time stamp of the last packet received by the UE.
5.2.3 Web Page Load Time
The Web page load time is merely the sum of the server response time and the page reception time:
τu= ηu+ ξu (12)
5.2.4 Throughput
This parameter measures the throughput per request. Its value is obtained when downloading a Web page. This parameter is computed as:
αu=
Bu
tlp,u− tfp,u
(13) where Buis the number of bytes received after request u.
5.2.5 Throughput in worst conditions
It is well known that user perception is mainly influenced by the lowest quality they experience. The worst case is represented by the transition from one cell to another because the received signal is weak and also because the short interruption due to handover may induce a reduction of the flow by TCP. We do not measure the handover duration because it is not significant in itself. However, we consider the throughput only for page transmissions that experience a handover. Let tH0 be the time at which a
handover is made. We compute αu with (13) only if tfp,u≤ tH0 and tlp,u≥ tH0.
5.3
Simulation Environment
To perform our tests we used the network simulator version 3 (ns-3) [1]. The ns-3 LTE module simulates the LTE model and the EPC model. The LTE model includes the LTE Radio Protocol stack (RRC, PDCP, RLC, MAC, PHY) and the EPC model includes core network interfaces, protocols and entities. These entities and protocols reside within the SGW, PGW and MME nodes, and partially within the eNB nodes. We use the standard ns-3 LTE model with direct transmission between UEs in the train and the network as the reference mode.
We implemented the mobile relay architecture module in ns-3 based on the classic LTE module (see Fig. 1). The encapsulation and decapsulation mechanisms are entirely simulated. We tested the performance of the mobile relay architecture and evaluated it against a direct transmission scenario.
In our scenario a train moves in a straight line at a constant speed of 100 kmph. Base stations (eNBt) are uniformly deployed along the track and have a 600-m radius. The inter-site distance is thus 1200 m. X2-based handovers are activated only for eNbts. Terminals are fixed within the train. We do not simulate any stops at stations. This is necessary to have enough Web service requests in the same conditions and to guarantee the statistical significance of the results.
The eNbt and the eNbm transmit on different frequencies. Therefore, inter-cell interference is avoided. At each simulation the train goes through 20 eNBts.
Three in-train loads are considered : 20, 60 and 100 mobile users. 60% of the passengers browse the Web and the remaining 40% carry out VoIP communications. The simulation parameters are described in detail in Table 5.
Table 5: Simulation Parameters
Parameters Value System Type FDD Temperature 290 K Simulation Time 100 s Train penetration loss 15 dB
For TOE and eNbt (Backhaul link) Propagation Loss Model Kun2600 MHz Number of TOEs 1
Number of eNbt 20 eNbt Cell’s radius 600 m eNbt Tx Power 27 dBm TOE Tx Power 23 dBm TOE Noise Figure 7 dB eNbt Noise Figure 3 dB Bandwidth for eNbt 20 MHz Downlink Frequency for eNbt 2620.0 MHz Uplink Frequency for eNbt 2500.0 MHz Mac Scheduler Proportional Fairness Handover Algorithm Event A3 [13] For UEm and eNbm (Access link) Propagation Loss Model Friis Model Number of UEm 20 up to 100 Number of eNbm 1
eNbm Cell’s radius 100 m UEm movement speed 100 kmph eNbm Tx Power 27 dBm UEm Tx Power 23 dBm UEm Noise Figure 7 dB eNbt Noise Figure 3 dB Bandwidth for eNbm 20 MHz Downlink Frequency for eNbm 2655.0 MHz Uplink Frequency for eNbm 2535.0 MHz Mac Scheduler Proportional Fairness
6
Numerical Results
In order to analyse the obtained results, several figures represent the statistical distribution of values by using boxplots with the upper quartile, median and lower quartile. The points which fall more than 1.5 times the interquartile range above the third quartile or below the first quartile are known as outliers. The whiskers depict the maximum and minimum values excluding outliers
6.1
Web page load time
Figure 9 depicts the effect of the mobile relay in terms of page load time when the train contains 12, 36 and 60 users Web browsing (within a total of 20, 60 and 100 users). For 12 users the median is less than one second for both relay and direct modes. For 36 users the median is reduced from 10 to 5 s and is thus divided by 2. The maximum time is also divided by 2. For 60 users, the mean load time is drastically reduced from 20 to 7 s. The max value is reduced from 248 to 81 s. Users are generally very sensitive to such a reduction of the load time. In all cases, the maximum load time is always smaller in relay mode. An interesting fact to highlight is that the values of 60 users in relay mode are smaller than the direct mode with 36 users.
-2 -1.5 -1 -0.5 0 0.5 1 1.5 2 2.5 3 12 12(r) 36 36(r) 60 60(r)
Load Time [log10 of seconds]
Number of Users direct
relay(r)
Figure 9: Boxplot of Web page load time (log scale)
6.2
Throughput
Figure 10a shows the reached throughput for Web browsing. When the train contains 12 users, direct mode shows better performance than relay mode (e.g. 3.1 Mbps vs 2.9 Mbps for median values). Nev-ertheless, the final user does not experience a QoS degradation since there are enough resources to serve all users. On the other hand, relay mode provides higher minimal throughput than direct mode (e.g. 0.4 Mbps vs 0.2 Mbps). When the train contains 36 users, relay mode shows better performance than direct mode (e.g. 3.1 Mbps vs 6.5 Mbps for median values). The maximum and minimum throughput values are also higher in relay mode.
When the train contains 60 users, the relay mode shows better performance than direct mode (e.g. 4.2 Mbps vs 2.1 Mbps for median values). The maximum and minimum throughput values are also higher in relay mode; however, several outliers show higher throughput in direct mode. Those outliers are due to transmissions performed when the train is very close to the eNBt.
Figure 10b depicts the throughput only for users that started the transmission before the handover and finished the transmission after the handover. Results show that users in relay mode reach a throughput three times as high as those in direct mode, e.g. 0.7 Mbps vs 2.41 Mbps, 0.21 Mbps vs 0.64 Mbps and 0.15 Mbps vs 0.45 Mbps (for median values) for 12, 36 and 60 users, respectively. These results confirm the benefit of deploying a mobile relay on the QoS of sessions that experience a handover (see subsection 5.2.5).
6.3
Server Response Time
In order to have a better understanding of the behaviour of the system, we show the cdf of the server response time in figure 11. Due to the additional hop, the minimum response time is larger when a relay is included. The last-decile response time is also larger with a delay at low load as shown in table 6. However, at high load (60 UEs), the response time is divided by 3. The relay mode is less influenced by the load. In direct mode, the server response time can reach 3 s (last centile) though it is limited to 74 ms in relay mode.
Direct Relay Direct Relay Direct Relay 12 UE 12 UE 20 UE 20 UE 60 UE 60 UE
Last decile 19 38 20 38 139 39
Last centile 61 46 285 63 3062 74
Table 6: Last decile and last centile of the http server response time (in ms)
6.4
Web Pages Loaded
Figure 12 shows the average number of Web pages loaded in both relay and direct mode. Since the page load time is shorter in relay mode, the cycle period (see figure 11) is decreased for the same reading time. Users can make a larger number of requests (1021 vs 700 for 60 users). This reflects the fact that relay mode stimulates the use of mobile services. Our simulation results show an increase of 45%.
6.5
Latency of VoIP flows
Figure 13 shows the distribution of latency. Since packets have more hops in relay architecture, it is normal to have higher latency than in direct mode. However, the latency difference between the relay and the direct mode is reduced as the number of users increases. The difference in median latency is 5 ms for 8 users, 3 ms for 24 users and 1 ms for 40 users.
Since latency is lower down 40 ms, we can assume that a good voice calling interaction is guaranteed in view of the fact that the latency threshold is 150 ms. Furthermore, a simple Proportional Fairness (PF) scheduler is used. PF does not give any priority to VoIP packets. By using a dedicated bearer for VoIP packets on the backhaul, it is possible to grant a higher priority to VoIP packets and to limit the latency rise.
6.6
Jitter of VoIP flows
Figure 14 shows the jitter distribution. Relay mode demonstrates lower jitter. When the train has few users, there is not a big difference in jitter. Nevertheless, for 24 users, jitter is reduced from 16 ms to 13 ms and for 40 users, jitter is reduced from 27 ms to 24 ms in relay mode.
6.7
Packet Loss Ratio of VoIP flows
Figure 15 shows the packet loss ratio. In all cases, relay mode shows no packet loss (RLC mode is AM). On the other hand, direct mode shows a packet loss lower than 1% for 8 and 24 users, and up to 4% when the train is carrying 40 users.
For VoIP flow, both the packet loss and the jitter are reduced because the link budget is much better with a relay. In direct mode, the packet erasure rate for an individual transmission is not negligible. The retransmissions induce variable delays and thus jitter. In some cases, the packet cannot be decoded even after the maximum number of transmissions, which gives packet losses.
6.8
Short analysis of the handovers
Although this work does not focus on handover mechanisms in mobile relays, we noticed an important fact to highlight in addition to the presented results. Since in-train users are moving in the same direction, the direct connection between the eNBt and UEs leads to an increased handover failure rate. A Random Access (RA) procedure is performed at the beginning of the handover execution phase. During the
preparation phase, the target cell allocates a unique RA preamble. This uniqueness guarantees a collision-free access. The preamble is released once the RA procedure is finished in the target cell. Each cell has 64 preambles available, but only a limited part is reserved for this contention-less RA. In the case of preamble starvation, handovers are queued.
When the cell is highly loaded (i.e more than 60 users), this causes a connection drop in the worst case (long queuing) and QoS degradation due to a delay increase in the best case. In the direct-mode simulation, we increase the number of preambles for contention-less access to avoid drops and to compare relay mode with the best possible direct mode.
In relay mode since all the users are grouped, the eNBt performs the handover only for the TOE (seen as only one user). This means that there will be only one preamble used per train when performing the handover, no matter the number of UEs in the train.
7
Conclusion
This paper evaluates the performance of a mobile relay architecture for public transportation systems. We base our evaluation on a testbed with real radio transmissions and consider both the signaling issue and the throughput experienced by users. A number of conclusions can be drawn.
The additional overhead due to multiple encapsulations has no significant impact on performance, both for data and for signaling. Signaling uses a negligible part of the bandwidth. As the bit rate is dramatically increased due to a much better link budget, deploying mobile relays is a very efficient way to increase the QoS in public transportation.
The page load time is reduced, especially in high load conditions, compared to a direct transmission. The server response time is also shorter despite the fact that there is an additional hop. We show that these improvements lead to an increase in the number of pages visited and are thus prone to stimulate the usage of mobile services. VoIP also takes advantage of mobile relays, especially regarding packet losses.
The relaying architecture proposed in this article is based on tunneling, which is reused in 5G networks without major modification of GTP in the user plane. Furthermore 4G and 5G technologies can be mixed: 5G base stations can be connected to a 4G core network, and an eNB can be connected to a 5G core network. The next step of our work is to study how the new features of 5G can be used with mobile relays to provide an unprecedented user experience for passengers on public transportation.
References
[1] ns-3 simulator. Available at: http://www.nsnam.org/
[2] Mobile network subsystems. Common Functional Specification D730 Issue B, RACE (Research in Advanced Communications in Europe) Industrial Consortium (1991)
[3] One-way transmission time. ITU-T Recommendation G.114, International Telecommunication Union (2003)
[4] Addali, K.M., BenMimoune, A., Khasawneh, F.A., Saied, A.M., Kadoch, M.: Dual-backhaul links in lte - a mobile relay system for high-speed railways. In: 2016 IEEE 4th International Conference on Future Internet of Things and Cloud Workshops (FiCloudW), pp. 98–102 (2016)
[5] Amarisoft: Amari lte 100, software lte base station on pc. Available at: http://www.amarisoft.com/ [6] Berisha, T., Svoboda, P., Ojak, S., Mecklenbrauker, C.F.: Cellular network quality improve-ments for high speed train passengers by on-board amplify-and-forward relays. In: 2016 Inter-national Symposium on Wireless Communication Systems (ISWCS), pp. 325–329 (2016). DOI 10.1109/ISWCS.2016.7600923
[7] Calle-Sanchez, J., De-Antonio-Monte, D., Molina-Garc´ıa, M., Alonso, J.I.: Theoretical analysis and performance simulation of in-band lte mobile relays in railway environments. In: 2014 28th International Conference on Advanced Information Networking and Applications Workshops, pp. 725–730 (2014). DOI 10.1109/WAINA.2014.117
[8] Calle-Sanchez, J., Molina-Garc´ıa, M., De-Antonio-Monte, D., Alonso, J.I.: Performance evaluation of in-band lte mobile relays in high speed railway environments. In: 2014 44th European Microwave Conference, pp. 139–142 (2014)
[9] Cao, J., Ma, M., Li, H., Fu, Y., Niu, B., Li, F.: Trajectory prediction-based handover authenti-cation mechanism for mobile relays in lte-a high-speed rail networks. In: 2017 IEEE International Conference on Communications (ICC), pp. 1–6 (2017)
[10] Chen, J., Mai, Y.: Relay node mobility support in the lte-advanced networks. In: 2013 22nd Wireless and Optical Communication Conference, pp. 293–297 (2013)
[11] Chen, Y.Y., Yan, F., Lagrange, X.: Performance analysis of cellular networks with mobile relays under different modes. Telecommunication systems 66(2), 217–231 (2017)
[12] Cox, D.: Renewal theory. London: Methuen & Co (1970)
[13] Dimou, K., Wang, M., Yang, Y., Kazmi, M., Larmo, A., Pettersson, J., Muller, W., Timner, Y.: Handover within 3gpp lte: Design principles and performance. In: IEEE Vehicular Technology Conference Fall (VTC 2009-Fall), pp. 1–5 (2009)
[14] Ericsson: Ericsson mobility report. https://www.ericsson.com/mobility-report (2019)
[15] Gamboa, J., Demirkol, I.: Softwarized lte self-backhauling solution and its evaluation. In: 2018 IEEE Wireless Communications and Networking Conference (WCNC), pp. 1–6 (2018)
[16] 3rd Generation Partnership Project: General packet radio system (gprs); tunnelling protocol user plane (gtpv1-u) (release 8). V8.5.0 Technical Specification 29.281, 3GPP (2010)
[17] 3rd Generation Partnership Project: Relay architectures for e-utra (lte-advanced), (release 9). V9.0.0 Technical Report 36.836, 3GPP (2010)
[18] 3rd Generation Partnership Project: Evolved Universal Terrestrial Radio Access (E-UTRA); Study on mobile relay (Release 12). V12.0.0 Technical Report 36.836, 3GPP (2014)
[19] 3rd Generation Partnership Project: Universal mobile telecommunications system (umts); lte; codec for enhanced voice services (evs); (release 14). V14.2.0 Technical Specification 26.445, 3GPP (2018) [20] Ghazzai, H., Bouchoucha, T., Alsharoa, A., Yaacoub, E., Alouini, M., Al-Naffouri, T.Y.: Transmit power minimization and base station planning for high-speed trains with multiple moving relays in ofdma systems. IEEE Transactions on Vehicular Technology 66(1), 175–187 (2017)
[21] Iturralde, M., Galezowski, T., Lagrange, X.: Performance of mobile relays in loaded conditions for railway transportation. In: 2018 16th International Conference on Intelligent Transportation Systems Telecommunications (ITST) (2018)
[22] Kerdoncuff, T., Galezowski, T., Lagrange, X.: Mobile relay for lte: proof of concept and performance measurements. In: Vehicular Technology Conference (VTC Spring), 2018 IEEE 87th (accepted paper). IEEE (2018)
[23] Laiyemo, A.O., Pennanen, H., Pirinen, P., Latva-aho, M.: Effective deployment of cooperative moving relay nodes in a high speed train. In: 2016 Wireless Days (WD), pp. 1–6 (2016). DOI 10.1109/WD.2016.7461448
[24] Liu, Z., Fan, P.: An effective handover scheme based on antenna selection in ground–train distributed antenna systems. IEEE Transactions on Vehicular Technology 63(7), 3342–3350 (2014)
[25] Liu, Z., Zhou, E., Fan, P., Hao, L.: Tradeoff of capacity and handover performance in high speed railway wireless communications. In: 2016 IEEE 83rd Vehicular Technology Conference (VTC Spring), pp. 1–5 (2016). DOI 10.1109/VTCSpring.2016.7504508
[26] Oliva, D., Alonso, J.I.: A two-hop mimo relay architecture using lte and millimeter wave bands in high speed trains. In: 2018 IEEE Wireless Communications and Networking Conference (WCNC), pp. 1–6 (2018). DOI 10.1109/WCNC.2018.8377369
[27] Oliva S´anchez, J.D., Alonso, J.I.: A two-hop mimo relay architecture using lte and millimeter wave bands in high-speed trains. IEEE Transactions on Vehicular Technology 68(3), 2052–2065 (2019) [28] Pan, M., Lin, T., Chen, W.: An enhanced handover scheme for mobile relays in lte-a
high-speed rail networks. IEEE Transactions on Vehicular Technology 64(2), 743–756 (2015). DOI 10.1109/TVT.2014.2322374
[29] Parichehreh, A., Spagnolini, U., Marini, P., Fontana, A.: Load-stress test of massive handovers for lte two-hop architecture in high-speed trains. IEEE Communications Magazine 55(3), 170–177 (2017)
[30] Prados-Garzon, J., Laghrissi A.and Bagaa, M., Taleb, T.: A queuing based dynamic auto scal-ing algorithm for the lte epc control plane. In: 2018 IEEE Global Communications Conference (GLOBECOM 2018), Abu Dhabi, UAE (2018)
[31] Prados-Garzon, J., Ramos-Munoz, J., Ameigeiras, P., Andres-Maldonado, P., Lopez-Soler, J.: Mod-eling and dimensioning of a virtualized mme for 5g mobile networks. IEEE Transactions on Vehicular Technology 66(5), 4383–4395 (2017)
[32] Pries, R., et al.: An http web traffic model based on the top one million visited web pages. In: Euro-NF Conference in Next Generation Internet (NGI), 2012 IEEE 8th, pp. 133–139. IEEE (2012) [33] Qian, X., Wu, H., Meng, J.: A dual-antenna and mobile relay station based handover in distributed antenna system for high-speed railway. In: 2013 Seventh International Conference on Innovative Mo-bile and Internet Services in Ubiquitous Computing, pp. 585–590 (2013). DOI 10.1109/IMIS.2013.103 [34] Sanz-G´omara, A., Mar´ın-Garc´ıa, J.A., Alonso, J.I.: Performance evaluation of mimo architectures with moving relays in high-speed railways. In: 2018 48th European Microwave Conference (EuMC), pp. 716–719 (2018). DOI 10.23919/EuMC.2018.8541728
[35] Stewart, R.R.: Stream control transmission protocol. RFC 4960, RFC Editor (2007). URL https://rfc-editor.org/rfc/rfc4960.txt
[36] Tian, L., Li, J., Huang, Y., Shi, J., Zhou, J.: Seamless dual-link handover scheme in broadband wire-less communication systems for high-speed rail. IEEE Journal on Selected Areas in Communications 30(4), 708–718 (2012)
[37] Zhang, C., Fan, P.: Providing services for the high-speed train and local users in the same ofdma system: Resource allocation in the downlink. IEEE Transactions on Wireless Communications 15(2), 1018–1030 (2016). DOI 10.1109/TWC.2015.2481431
[38] Zhang, J., Du, H., Zhang, P., Cheng, J., Yang, L.: Performance analysis of 5g mobile relay systems for high-speed trains. IEEE Journal on Selected Areas in Communications pp. 1–13 (2020)
[39] Zhu, X., Chen, S., Hu, H., Su, X., Shi, Y.: Tdd-based mobile communication solutions for high-speed railway scenarios. IEEE Wireless Communications 20(6), 22–29 (2013). DOI 10.1109/MWC.2013.6704470
[40] Zufang, D., Suoping, L., Jaafar, G., Xiaokai, C.: Improvement and queuing analysis of the handover mechanism in the high-speed railway communication. Telecommunication Systems 73(3), 383–395 (2020). DOI 10.1007/s11235-019-00651-y
0 1 2 3 4 5 6 7 8 9 10 11 12 13 14 12 12(r) 36 36(r) 60 60(r) Throughput [Mbps] Number of Users direct relay(r)
(a) Throughput for all users
0 0.5 1 1.5 2 2.5 3 3.5 12 12(r) 36 36(r) 60 60(r) Throughput [Mbps] Number of Users direct relay(r)
(b) Individual throughput for downloads that experience a handover
0.5 0.6 0.7 0.8 0.9 1 -2 -1.5 -1 -0.5 0 0.5 1 CDF
Server Response Time [log10 of seconds] direct 60 UE relay 60 UE direct 36 UE relay 36 UE direct 12 UE relay 12 UE
Figure 11: CDF of the http server response time (in log scale)
0 200 400 600 800 1000 1200 12 36 60
Web Pages Loaded
Number of Users direct
relay
5 10 15 20 25 30 35 40 8 8(r) 24 24(r) 40 40(r) Latency [ms] Users direct relay(r)
Figure 13: Boxplot of latency of VoIP flows
0 5 10 15 20 25 30 8 8(r) 24 24(r) 40 40(r) Jitter [ms] Users direct relay(r)
0 0.5 1 1.5 2 2.5 3 3.5 4 8 8(r) 24 24(r) 40 40(r) PLR [%] Users direct relay(r)