HAL Id: hal-01132247
https://hal.archives-ouvertes.fr/hal-01132247
Submitted on 16 Mar 2015
HAL is a multi-disciplinary open access
archive for the deposit and dissemination of
sci-entific research documents, whether they are
pub-lished or not. The documents may come from
teaching and research institutions in France or
abroad, or from public or private research centers.
L’archive ouverte pluridisciplinaire HAL, est
destinée au dépôt et à la diffusion de documents
scientifiques de niveau recherche, publiés ou non,
émanant des établissements d’enseignement et de
recherche français ou étrangers, des laboratoires
publics ou privés.
First steps for operational dense and high-resolution
mapping of shallow water using dedicated robots
Loïca Avanthey, Antoine Gademer, Laurent Beaudoin, Michel Roux
To cite this version:
Loïca Avanthey, Antoine Gademer, Laurent Beaudoin, Michel Roux. First steps for operational dense
and high-resolution mapping of shallow water using dedicated robots. Ocean and Coastal Observation:
Sensors and observing systems, numerical models and information Systems (OCOSS), 2013, Nice,
France. �hal-01132247�
First steps for operational dense and
high-resolution mapping of shallow
water using dedicated robots
L. Avanthey
§†, A. Gademer
†, L. Beaudoin
†, M. Roux
§ ⇤†
ESIEA
§Institut Mines-T´el´ecom
Laboratoire ATIS
T´el´ecom Paristech CNRS - LTCI
9 rue V´esale, 75005 Paris,
France
46, rue Barrault - 75013 Paris,
France
Abstract
Acquiring dense and high resolution 3D data in operational conditions is a real challenge during exploration of underwater or subaquatic areas for environmental, archaeological, defense and security applications. In order to achieve these goals, the use of small automated robots can be seen as an efficient solution. In this paper, we focus on local areas in shal-low water and we present an overview of our devevelopment for seafloor mapping. We introduce a dedicated robot and detail the first steps of the developpement of a dedicated payload: a stereo rig and a 3D recon-struction system. The last part discusses our first operationnal results and future work.
1
ROBOTS FOR DENSE AND HIGH-RESOLUTION
MAPPING IN SHALLOW WATER
1.1
The underwater and subaquatic areas
Dense mapping of the seafloor (surface and landcover) with a high precision can be critical for many applications such as defense and security [Corfield et Hillenbrand, 2003], industry [Danson, 2003], environment [Gademer, 2010] or archeology [Warren et al., 2007].
Yet those represent very large areas as both oceans and seas cover about 70,8% of the Earth’s surface [Christ et Wernli, 2008] and in addition, the task of acquiring data underwater is more difficult than in the air.
⇤Thanks to the French Direction G´en´erale de l’Armement (DGA) for the funding of this
thesis, to Charenton-le-Pont city for diving and swimming pools access and to Fischer Con-nectors Society.
Indeed, the main issues come directly from the restriction of electromagnetic waves propagation due to the nature of the medium [Rives et al., 1978]. Re-fraction, absorption, di↵usion, added to the distance and a dependance on the air / water interface make it difficult for spatial altimetry or aerial bathymetry to give highly accurate data. So, in order to acquire more accurate and dense data of a local area we have to perform in situ remote sensing.
However underwater environment is rather hostil. In situ limitations are related to high pressure and salt corrosion which are particularly problematic to both human and material [Christ et Wernli, 2008]. Indeed, pressure increases with depth by about 1 bar (one kilogram per square centimeter) every ten meters. At the bottom of oceans, a square centimeter has to support a pressure force around 200 kilograms and it can be up to 1 ton in ocean trenches. As for salt, by transforming the water into an electrolyte, it activates corrosion: some materials can therefore be damaged in a short time and that can easily lead to leaks or mechanical malfunctions.
The restriction of electromagnetic waves propagation also causes in situ problems as it results in poor visibility (less than 15 meters most of the time, made worse by turbidity, often blurred) and in colors alteration but also and more importantly in low rate communication (if wireless) and in imprecise localisation (due to the inability to directly use global positioning methods such as GPS).
Last but not least, the fact that it is a natural environment is a difficulty in itself for acquisition. Currents, waves and tides make it impossible to stand still, unless to land at the bottom and be anchored there. These events also promote the sudden changes of the environment properties. Indeed the underwater environment is not homogeneous and strongly depends on the balance between temperature, salinity and pressure.
It is also inhabited by fauna and flora. This adds a lot of movements in the study areas: independent movements for wildlife or movements following the motion of the medium for plants like the leaves of a tree in the wind. Added to the imprecise mouvements of the acquisition vector itself, this can lead to inaccurate measurements.
1.2
Acquiring 3D Data
On the other hand the density of the water medium improves the propagation of sound waves comparing to air, that is why acoustic based sensors (such as sonar) are traditionally used for mapping the seabed. But these sensors are mainly dedicated to recover the distance from the sensor to the sea bottom and they therefore essentially produce contour lines. Thus, to achieve dense and high-resolution mapping of sea bottom and landcover, we can not rely solely on these sensors. To overcome this, we can use optical sensors, but because of the limited visibility, it is necessary to be very close to the studied surface. This constraint significantly increase the time requiered to achieve the cartography of undersea areas.
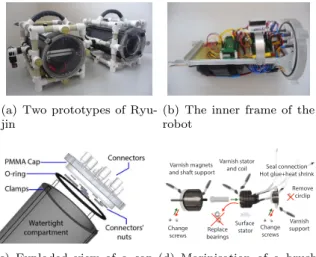
(a) Two prototypes of Ryu-jin
(b) The inner frame of the robot
(c) Exploded view of a cap and closure system
Varnish magnets and shaft support
Change screws bearingsReplace
Change screws Varnish stator and coil Varnish support Remove circlip Surface stator Seal connection Hot glue+heat shrink
(d) Marinisation of a brush-less motor
Figure 1: Prototypes of the robot and technical parts.
1.3
The use of robots
These missions of data acquisition can be qualified as 3D jobs (Dull, Dirty and Dangerous), where the dull part essentially takes place in the vastness of the areas to meticulously observe and in the temporal repetition. As to the dirty & dangerous part, it takes place in the difficult and dangerous accesses to some study areas where the pressure is huge or the path steep.
Thus, the use of underwater robots appears to be an efficient and promising solution for these missions, especially as they allow the automation of certain tasks and the use of dedicated payload.
In this article, we will focus on dense and high-resolution mapping of local areas in shallow water (less than 100 meters deep). In the first place, we will present the dedicated robot developped specifically to be easily operated, cus-tomizabled, and readily reproductible. Then we will detail the dedicated hard-ware stereo payload. Once the data acquired, the next section will deal with the 3D reconstruction system in the very specific case of underwater imagery. The last section will discuss the first operationnal results and perspectives.
1.4
Small underwater robots for scientific missions
The choice of the robot is very important for the operational side of data acquisition: it must be easily reconfigurable depending on the mission, easy to carry on the study areas, have sufficient autonomy and maneuverability, and be a↵ordable in order to multiply the units for spare or collaboration squad.
Sizes and prices of robots on the market are quite substantial, involving a significant operational cost of transport (truck, etc.), handling (cranes, boats, etc.) and maintenance (advanced technology, expensive specialized equipment,
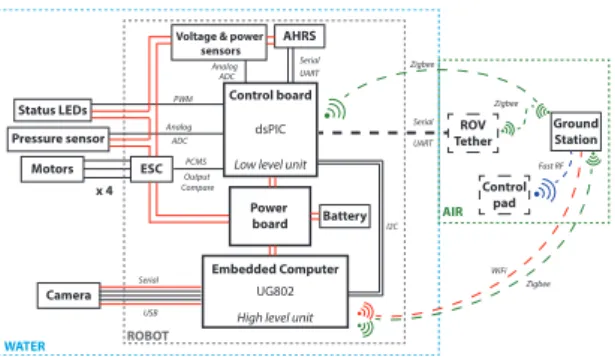
Control board
dsPIC Low level unit
Embedded Computer
UG802 High level unit
Power board ESC Motors Camera Battery AHRS Pressure sensor Status LEDs
Voltage & power sensors USB Output Compare UART ADC Serial PCMS Serial ADC Analog Analog PWM UART Serial ROV Tether Ground Station x 4 WATER ROBOT AIR I2C Zigbee Zigbee WiFi Control pad Fast RF Zigbee
Figure 2: Block diagram of the robot.
etc.). The technical choices related to this issues impose constraints on which payload can be installed (compatibility with the existing connections) as well as their disposition on the robots (size, weight, place, orientation, etc.). Among the few small robots (< 20 kg) that are available at low cost nowadays, very few are dedicated to perform scientific missions: they rarely exceed 30 meters depth and have mostly no automation at all. So we decided to design a robot dedicated to mapping missions, called Ryujin [Beaudoin et al., 2012], illustrated in figures 1(a) and 3(a).
2
A DEDICATED HYBRID UNMANED
UNDERWATER VEHICLE (UUV)
2.1
Main technical features of the development of the
robot
Inspired by the philosophy of the MIT’s Seaperch project [Bohm et Jensen, 1997; Sea, 2011], we have developped a small lightweight platform with cheap materials and simple mechanics.
The watertight compartment consists of a PVC tube with two PMMA trans-parent caps, machined with a CNC. The whole is held by clamps, thus no specific tools are required to open or close the compartment as illustrated in figure 1(c)).
The inner frame, shown in figure 1(b), holds the intelligence and power parts. Ryujin fully benefits of the decrease of electronics components size and cost for its homemade control and power boards as well as for critical sensors like pressure sensors that provide information on the depth of the vehicle or at-titude and heading reference systems (AHRSs). As for the embedded computer used to perform high-level tasks such as images processing, we nowadays have acces to both small and cheap units (about one or two times the size of a stick of gum, < 50 g, < 120 e) presenting quite good performances (> 600 MHz, > 256 Mo RAM) like the well-known Raspberry Pi or other like the UG802 (an android TV dongle) we are using and on which we installed a linux. But most
runs on ARM architecture, which often causes problems concerning drivers as they are not always ported. Moreover the ease of interfacing with other systems di↵er greatly from a model to the other.
The Fischer connectors on the rear cap allow the communication between the embedded units and the submerged blocks that are mounted on the outer frame. Made of PVC pipes and fittings that interlock, the outer frame is totally immersed and can easily take di↵erent configurations. We sealed the connectors with resin and the wet connections are carefully made with hot glue and heat shrink (so that we can change them, unlike resin which is definitive).
One of the outer blocks is crucial in the design of the robot as it concerns the propulsion system. Most of the cheaper sealed motors are fairly large which consequently constrains the size of the robot. To solve this problem we diverted brushless motors to make them run in total immersion in salt water [Avanthey et al., 2011]. By removing this size constraint, we were able to design the robot exactly with the size we wanted. We use almost the same brushless motors as those of our Unmanned Aerial Vehicles [Gademer et al., 2010a,b], except that they have a higher torque (more appropriate to water environment). Without protection, the motor we tested ran for a hundred hours in fresh water before seizing up and another one stopped working after only 10 hours of immersion in salt water (about 40 g/L).
To marinise the system, we have changed some parts like the screws and we covered the other sensitive parts with marine varnishes like the stator (previ-ously surfaced to give room), the coil, the magnets and parts of the cage. The most important step was the replacement of the ball-bearings guiding the shaft by a home-made POM bearing. This process is illustrated in figure 1(d). It is a crucial part in the motor system but also the most fragile one when exposed to water and salt.
After these modifications, we have run a motor again in salt water and stopped the test after 200 hours as the engine showed no signs of wear. The marinization of brushless motors is rather convincing and we use them since, either in pool or in seawater, without encountering any problems. As these motors are powerful, we restrain them at about 20% of their power, which is more than enough.
2.2
Ryujin: an hybrid underwater prototype
The resulting prototypes have a size of 20⇥ 20 ⇥ 30 cm, weight about 9 kg and present an autonomy of about two hours and a theorical pressure resistance up to 11 bars (100 meters, tested up to 15 meters) for a very low cost (about 1200 e to build one). They are highly customizable and can be equipped with a payload fitting the mission.
Ryujin is an hybrid robot, that means it can be used in Autonomous Un-derwater Vehicle (AUV) mode as well as in Remotely Operated Vehicle (ROV) mode.
In AUV mode, the robot has an automatic depth (relative to pressure) and course (relative to the magnetic north) control. These control loops are based on PID controllers, described by equation 1. They must allow the vehicle to
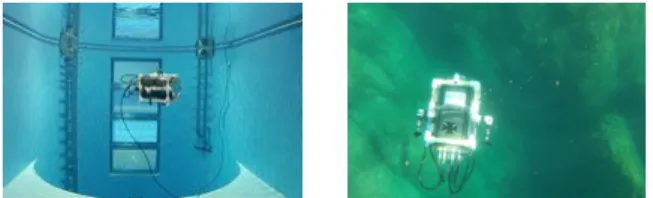
(a) Ryujin in the diving pool of Charenton-le-Pont and in seawater at Cap de Nice (Mediterranean)
(b) Ground station depth monitoring
-Step down from 1 to 15 meters -7 -6 -5 -4 -3 -2 -1 0 0 1000 2000 3000 4000 5000 6000 7000 8000 9000 -7 -6 -5 -4 -3 -2 -1 0 0 1000 2000 3000 4000 5000 6000 7000 8000 9000 Measured depth Target Human perturbation (c) Depth control
record with human
perturbations
Figure 3: The underwater vehicle in use and its monitoring tools.
not only reach the given order but to keep by it whatever disturbances encoun-tered in the environment (current, density change, buoyancy, etc.). The depth control loop has been tested in a diving pool with more or less strong human disturbances by contact to ensure that the robot returns to its position within a reasonable time with minimal oscillations around the setpoint [Avanthey et al., 2013]. The depth logs are presented in figure 3(c). Unlike UAVs which operate in the air at a very fast speed and therefore strongly depend on the propor-tional (KP), we observed that in water, this coefficient is almost neglected in
favor of the integration coefficient (KI), mostly because of the density of the
medium and the resulting inertia. As for the derivative coefficient (KD), it is
equally important. Concerning the other parameters, neutral is the constant thrust to sustain the vehicle and " is the di↵erence between the measure and the targeted set point.
Order = neutral + KP ⇥ " KD⇥ "
dt + KI⇥
Z
"dt (1)
For the time being, the AUV mission plans use dead reckoning processes and the robot does not dispose of sonic modem communication. Therefore, when in AUV mode, it is possible to communicate with it only when it is on the surface. The communication with the low-level unit (control and sensors) is done via ZigBee protocol and we use the WiFi protocol with the high-level unit (vision). We will add more automation in the future such as vision or accoustic based navigation.
When in ROV mode, the robot is controlled by a ground operator which communicates with the robot through a cable which transmits the data. The end of the ROV cable can be anchored to the ground but to improve flexibility
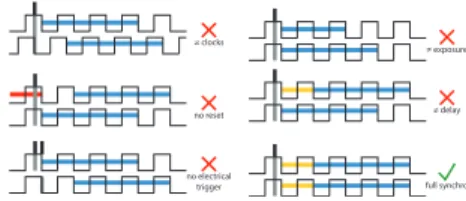
≠ clocks
no reset
≠ exposure
≠ delay
no electrical
trigger full synchro
Figure 4: Cases of synchronisation (high-low mode).
it can also be anchored on a surface vehicle that stay right above the robot. All data are centralized on a ground station which distributes them to the di↵erent actors. The information from the robot (as the current depth, the battery level, etc.), passes through the cable and is received via the ZigBee protocol by the station which displays it in real-time in the control interface. Similarly, orders from the operator by either the control handle (FAST RF) either directly by the control interface, are transmitted in real time to the robot.
When performing data acquisition, the distance to the observed area is important as we will see later, and so it is necessary to maintain a stable depth. Since it is difficult to maintain manually a constant depth, especially when disposing of an indirect view of the scene, the ROV mode is often semi-automated to assist the human operator. Thereby it can borrow on demand the automatic depth or course control of the AUV mode. To keep a certain maneuverability the operator can at any time regain control of these automated functions.
3
A DEDICATED STEREO RIG AND 3D
RECONSTRUCTION SYSTEM
3.1
Features of a stereo rig adapted to underwater
envi-ronment
The next step concerns the acquisition and processing of the optical images. Since years, a lot of works have been done to extract 3D information from images [R. et A., 2000]. But classical reconstruction systems are typically used on fixed scenes (objects) or rather rigid areas (indoor area, urban area, etc.). Therefore those systems often find themselves in trouble dealing with outdoor scenes [Kramm, 2008] due to the dynamics of the observed environnement or of the camera, alteration of colors, turbidity, blur, etc..
Amongst them, the synchronized stereo system seems the most robust to these constraints. Synchronisation is a key element to reconstruct dynamic scenes [Hogue et al., 2006]. Indeed, the majority of reconstruction algorithms relies on the fact that the left view corresponds strictly to the same scene as seen by the right image. If the images are not taken simultaneously, then this a priori become false. To be e↵ective, the synchronization must be done at two levels (same acquisition start and same acquisition duration) and must be
Figure 5: Synchronisation estimation with targets.
accompanied with a precise datation to combine it with other data that can help the accurate repositioning of the acquisition in the relative space.
It is impossible to have a real perfect synchronisation in practice but what is important is that the higher shift that can occured in the area during the synchronisation time should be lower than one pixel.
Many analog cameras have the ability to be precisely synchronized (line by line during the acquisition). However, it is very difficult for the majority of the models to precisely date the frames. Digital cameras, on the other hand, can have a level of dating very interesting but it is harder to get a good synchronisation level with them. Indeed, only rely on electrically triggering the acquisition (an often used process) is not enough for full synchronization, even if the clocks are synchronized (figure 4). At least, to reach the two levels of synchronisation we mentioned, it takes in addition a fixed starting time of acquisition after the reception of the trigger (time to prepare the camera), a fixed exposure time and if possible a transfer time roughly equivalent for each camera of the rig as summarized in equation 2. The latter is mainly used to calculate the maximum frequency of shots. It is a parameter that will influence the speed of the vector (to obtain a certain overlap rate) as well as the exposition time (to prevent motion blur). The camera must also allow to disable all the automatic functions (white balance, auto-shutter, etc.) that could influence these durations or di↵erentiate the quality of the images in a stereo pair [Matthews, 2008].
Tacq = Tpreparation+ Texposure+ Ttransf er max (2)
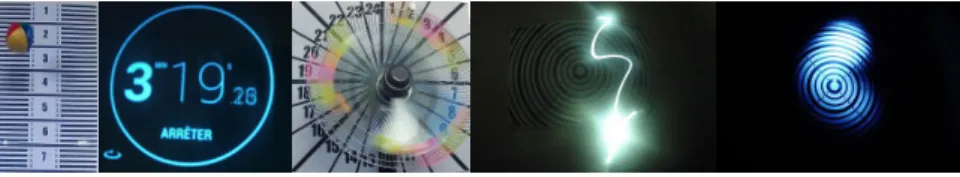
It is possible to estimate the level of synchronization of the system experi-mentally. The simplest test, which also allows to measure the accuracy of the acquisition frequency is to take pictures of a digital counter (at least to the hundredth of a second, if possible thousandth).
As seen in figure 5, other tests like taking pictures of a falling ball, of color blades turned by hand, of a flash that spreads on a flat surface, of a light that moves in the dark, of a flag in the wind or of water propulsion, are based on position. So they require to minimize as much as possible the disparity that will disturbs the comparaison of the two views. Then we must use the smallest base possible (distance between the two cameras) and be far enough from the observed scene. It is more advisable to use graduate targets to help the measurement.
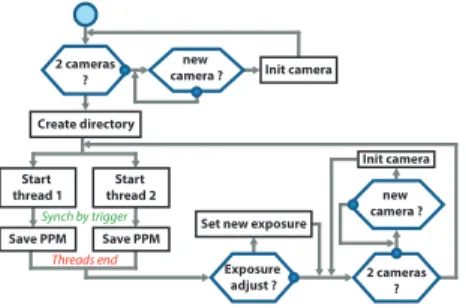
Init camera Create directory Start thread 1 Start thread 2 Synch by trigger Threads end
Save PPM Save PPM Set new exposure
Init camera 2 cameras ? new camera ? Exposure adjust ? 2 cameras? new camera ?
Figure 6: Flowchart of the acquisition process used.
(a) The two stereo rigs and the individual cameras (top: uEyes, bottom: Go-Pro)
(b) Robot equipped with the payload
Figure 7: Payload for underwater stereo pairs acquisition.
They will be constrained by the choice of the GSD (Ground Sample Distance, GSDmm). Following the methodology of Extended Ground Truth [Gademer
et al., 2013], the choice of GSD will allow (with the parameters of the cam-era: resolution Rpix, focal length fmm, width of the optical chamber Lmm) to
calculate the maximum height (Hmm) relative to the target (equation 3). The
maximum height will then constrain the maximum base of the system in order to obtain an overlap of at least 60% (equation 4), a classic and recommanded choice in stereoscopy. Then these two parameters can be adjusted given the desired depth accuracy and the desired travel speed which influences the time needed to cover an area, the global overlap and the motion blur.
Hmm=Rpix⇥ fmm
Lmm ⇥ GSDmm
(3)
Bmm= Rpix⇥ GSDmm⇥ (1 60) (4)
3.2
Hardware part: the stereo rig
Because of the lack of ”on the shelf” solutions (waterproof, small, controllable, synchronisable, a↵ordable, etc.), we build our own rig dedicated to the appli-cation.
We opted for a static rig to simplify the 3D reconstruction process. It can take images of the study area from nadir: either mount in parallel with the vector to observe sea-bottom and landcovers or right-angle oriented for observing underwater cli↵s, boat hulls, pipelines, wrecks or dams for examples. We build two di↵erent rigs: one with uEye cameras and later the other one with GoPro Hero2 cameras. Both are represented in figure 7.
The uEyes are fully configurable and have a decent resolution (pixel size about 5.3 µm in full resolution), a good synchronisation rate (+/ ten thou-sandth of a second) and an accurate timing (one-thouthou-sandth of a second). However the focus is manual and has no mechanical fixation. In addition the optical we have possesses little depth of field (and thus the focused area is very small).
The uEyes does not have internal storage capacity: to operate they need an embedded computer in order to trigger the shooting and retrieve then save the acquired images. The acquisition program, shown in figure 6, takes into account the reduced computational power of embedded computers. To achieve the best synchronization rate, it uses a thread for each camera while the dsPIC of the motherboard generates the trigger indicating that the next acquisition should start. We can thus acquire a synchronized pair of images every half second. The program is robust to the restart of the robot or to the disconnec-tion of one or both cameras. All automatic settings has been disabled (they are initialized with fixed values that can be changed depending on the mis-sion). Yet, brightness variations in outdoor areas are common (passing clouds, shaded and sunny areas, more or less reflective surfaces, etc.) and often brutal. Therefore, with a fixed exposure time, we may find ourselves with images ei-ther overexposed or underexposed. To overcome this, we take a measure of the automatic exposure every five acquisitions to adjust our parameter. Besides, we also observed a color di↵erence between the two sensors, but we have not yet set this problem. That can be embarrassing for the algorithms we are using in the 3D reconstruction system as we shall see in the next section.
We installed both cameras in individual dive housings from Prismatec, equipped with sealed connectors that allow them to communicate with the robot. They use the USB protocol which implies that the sealed cables and all others which are part of the connection must be twisted so that data can transit without loss.
As we have met many technical problems to finalize this rig, we did not had the time to test it during our pool sessions. Therefore, it was prooftested during the acquisition mission with the results we will discuss later.
As for the GoPro cameras, they present a better resolution (pixel size about 1.65 µm in full resolution), a decent synchronisation rate with the synchroni-sation cable (+/ one hundredth of a second) and an honorable dating (up to a second). However they are not meant to be configured or controlled by a robotic platform. Indeed, some functions are automatic and can not be deac-tivated (white balance, ISO, etc.) although they can be minimized (it would require to look in the firmware to see if it is possible to completely disable them). The focus changes are really frequent and can be a problem when there
Harris Detector
L_img Undistort List of points R_img Undistort
L_img
R_img DetectorHarris List of points
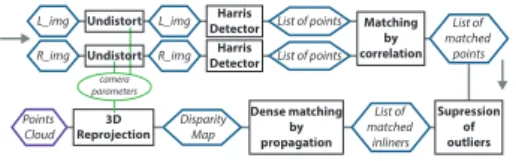
Matching by correlation List of matched inliners Dense matching by propagation Disparity Map 3D Reprojection Points Cloud camera parameters List of matched points Supression of outliers
Figure 8: Flowchart of the 3D reconstruction process used.
is a lot of movements (blur). The di↵erence of color between two cameras is also present even when using the synchronisation cable. In addition, the wa-terproof case welcoming both cameras have a very small base (3.46 cm) and do not have optical adapted to the underwater environment. It would be therefore necessary to self-made a synchronisation cable and put both cameras in slave mode so that they can be controlled by an electronic card. It would require as well to equip the dive housings with sealed connectors. We have not yet been able to acquire a synchronisation rate up to the original one with this configu-ration so in this article we have used the GoPro rig as seen in figure 7, without external control and with maximum half a second between both images using the timelaps mode. In addition to monitoring, we will also need to recover the data and meta-data on the embedded computer for processing but this will be for future work.
3.3
Software part: the 3D reconstruction system
In our operationnal data acquisition schema, we consider the use of two soft-ware systems for 3D reconstruction. The first softsoft-ware is meant to be dedicated to produce accurate and dense results once the mission is done. It could es-sentially rely on existing software in a first phase. As for the second software, it is not meant to be very accurate. Indeed it could be use for providing an accurate feeback in near-real time on the progress of mapping and determine the completeness of data acquired on the area (compliance of the acquisition in terms of coverage and quality). Besides it could also be used to get an idea of the structure of the environment around the robot and help the navigation (positioning, pathways, etc.).
So far for this second software, we have work on a proof of concept based on slightly modified classic algorithms. It has not yet been built and optimized to perform in near-real time.
We use the well known Harris detector to select interest points on a stereo pair. The calculations are relatively fast and we find it quite appropriate to the underwater context as it focuses on really textured objects, unlike SIFT or SURF points that generally seek to spread over the whole image. So we obtain no points in water only areas (despite particles or lighting e↵ect which creates artificial texture) or where the absorption of light is too high (and then cause a near complete visual loss of relief). The use of this detector is also possible due to the rigidity of the stereo rig (no or very little rotation between the two views). We slightly changed the Harris algorithm in order to not set a threshold
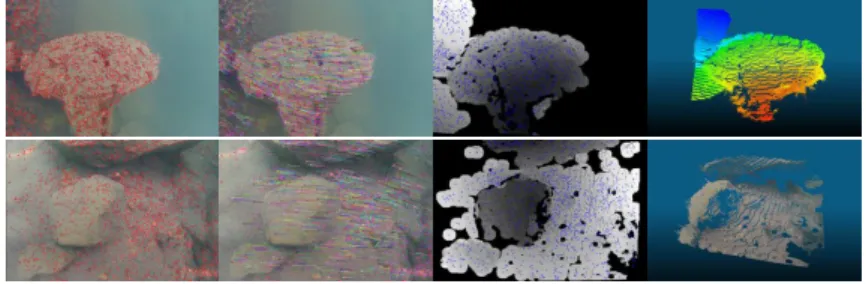
Figure 9: Example of the di↵erent steps of the 3D reconstruction software: Harris detector, matching by SSD (vector representation), disparity map by propagation and point cloud. Top: Plage Bleue, bottom: Lac Pavin.
(to define if a point is of interest) but iteratively adapt this threshold to obtain a number of points in a given interval. So whatever the shooting conditions, we are guaranteed to have the appropriate number of points (not too much, but enough) for the rest of the processing.
We perform a matching by correlation. We made several comparative tests with SURF, SIFT and ASIFT algorithms on underwater images taken under di↵erent conditions and the results we get in terms of inliners over an initial number of interest points are in general as good as those and often even better. This confirms the results presented in [M´eline, 2013] about the use of Harris points in the underwater environment.
In addition, we have noticed that the correlation with SSD (which is the less time consumming of the correlation criteria) on rigid submarine views mostly gives better results over ZNSSD or ZNCC. This is true if there is no strong color di↵erence between the views, in which case you must use ZNCC. When the matching is done, we supress the outliers with a simple algorithm that use statistic over the local vector flow (if a vector does not follow the mean local movement then it is likely an outlier).
We have tested the well known epipolar geometry rectification to then per-form dense matching, but finally we preferred to avoid this method which is very time consuming. Our images are almost in epipolar geometry because of the rigid rig, so instead we chose to use a spreading method inspired by [Lhuillier et Quan, 2000].
The inliners stand as seeds to help spreading the matching: a point next to an inliner should be found in all probability next to the corresponding point on the other image. If its correspondant is found, then the point becomes a new seed. We limit the spreading by a radius around the initial inliners in order to not infer too much on areas with no real texture.
Then we perform reprojection on the obtained disparity map to create the point cloud. The figure 8 presents the flowchart of the 3D reconstruction al-gorithm we use and the figure 9 presents examples of results on GoPro images (taken without a rig)1.
Camp IC II III Cap de Nice IV -8 -6 -7 -6 -6 -3 -5 -5 -3 -2 -5 -5 -3 -3 -3 -3 -3 -4 -4 -4 -4 -3 -2 -2 -2 -2 -2 -1 -1 0 -8
Figure 10: Acquisition mission at Cap de Nice (Mediterranean). From left to right : A space view (Google) and a sketch of the study area, ground camp and data acquisition.
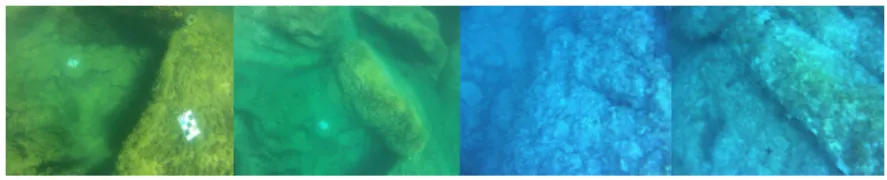
Figure 11: Examples of data acquired during the mission (left images from stereo pairs). Left: GoPro images, right: uEye images.
4
FIRST RESULTS AND PERSPECTIVES
We tested our developments in a field mission to collect data (figure 10). It took place at Cap de Nice (Mediterranean Sea), during three days at the end of August 2013. The chosen area for our first underwater field mission allows a rather clear water, a bedrock instead of sand (lots of relief) and an easy access to enough depth (3 to 30 meters) without the need of a boat.
The main objectives of the mission were:
1. to test Ryujin in real conditions. Indeed, so far the robot had worked around fifty hours in a pool since three years (counting leak testing), and twice five days in the port and saltwater pools of La Spezia at Sauc-E competition (2011 and 2012 editions).
2. to test the uEyes stereo rig in real conditions: synchronization, image quality, frequency of the acquisition versus speed of the vector, etc.. 3. to acquire stereoscopic pairs to cover an underwater area that ranges
be-tween 0 and 15 meters depth. Insofar as possible to acquire synchronized stereoscopic pairs.
4. to acquire the experience to properly demarcate an underwater area (pat-terns).
For the moment, the egolocalisation capabilities of the robot do not allow an automated movement in a turbulent medium. But to carry it out in ROV mode, it is necessary to have a real-time video feedback that we have not yet
been pre-processed (no contrast enhancement and so on) and were proportionally resized to
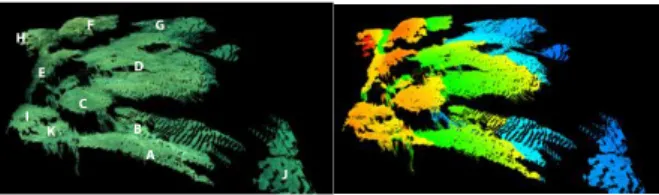
D C B A F E G J I K H
(a) Left image of a
stereo pair from the Go-Pro rig (annoted)
A B
C D
E F
(b) Point cloud from 18 views in full size processed with the IGN software Mic-Mac (' 85, 000 points) A B I K C D E F H G J
(c) Our resulting point cloud from the stereo pair 12(a) (' 300, 000 points).
Figure 12: Examples of point clouds produced from the acquired data (relative to the cameras).
developed. Indeed we have observed that when the pilot on ground is looking at the robot through the surface, it disappears enough to prevent the piloting beyond one meter deep and two to three meters away. We tested some control near the base, but the pressure sensor did not give very consistent values for some reason we do not understand yet and thus it prevent us to safely dive below the turbulent surface. Despite this we were able to do some tests which showed that the robot could move smoothly enough to perform the mapping even in a turbulent medium. In order to collect data we decided for the duration of the mission to lead the robot by hand with the help of a diver in order to cover the entire study area.
As for the uEyes stereo rig, we were able to validate its proper functioning and especially the quality of the synchronization. The first acquisition were not made under favorable conditions: it takes place in the evening and at the surface, so they were little light and a lot of swirl. Because of this the majority of the images were often blurred and sometimes too dark or too light, but they were perfectly synchronized (that is, the blur was perfectly synchronised). Unfortunately one of the cables broke the following morning and we have not been able to fix it. So we were not able to redo the acquisitions in the light of day with a diving cylinder to avoid the movements of the surface neither were we able to perform other tests on the quality of the images according to the settings of parameters.
Therefore, the images we collected were essentially taken with the GoPro stereo rig, and therefore a low synchronization rate, but a very good resolution. By covering the area, we collected about 20, 000 stereo pairs. Figure 11 shows
Figure 13: Example of the 3D reconstruction of a small object - a shell of abalone (Haliotidae) picked up on the study area (size about 5⇥ 3 cm). The inner side is challenging because of the nacre.
some samples of these shots and figures 12 and 13 show some examples of point clouds that can be extracted from those data2.
Finally concerning the patterns we used to mark the area, they have many uses: they stand as depth indicator (mesured when we drop them o↵) as well as landmarks when covering the area. But they also are usefull in post analysis: as distance scale and depth reference but also as daymarks for global positionning as they are numbered and oriented (when we see a pair with a pattern, we could know approximately where it was located in the covered area). The pattern must be rigid, weighted and dropped o↵ on di↵erent depth zones as flat as possible towards the robot path.
The patterns we had prepared consist of a white frame and large black tiles with two of di↵erent colors for the orientation of the pattern. The white frame has not proved to be appropriate. Indeed even if it made it easy to spot them by far (even from the surface) it most of the time caused overexposure on images (the tiles on the pattern were even sometimes impossible to see). To us, white seems a color to avoid on underwater patterns with the type of cameras we use (except in ultra clear water), so next we will try a light gray color.
Besides, we plan to add features on the plain tiles of our patterns, inspir-ing us with the patterns used by [Matthews, 2008], because we believe that they can serve as easy seeds for the spreading matching algorithm described in section 3.3.
Finally, we estimate that it takes about 10 patterns for an area of 1, 000 square meters (it should be increased if the study area presents a lot of di↵erent depth plateau).
5
CONCLUSION
From now, futur work will focus on:
• the improvement of the 3D reconstruction system and the validation of the obtained accuracy.
• aggregation of the local point clouds to obtain a global representation of the study area.
• optimization of the 3D reconstruction system to perform in near real time onboard.
• add a real-time video feedback to allow the control of the robot on studies area. It could be either embedded or from a surface vehicle equipped with an immersed camera. The tests of vision we have performed during the mission show that the robot, with its white frame, stands out very well from the underwater bedrock and is visible from the surface even at 15 meters depth.
• try to create an online database of underwater synchronized stereoscopic pairs from both uEyes and GoPros accompanied by land information (weather, water temperature, visibility, etc.) based on an accessible test area. This could not only allow to compare the results on the data (post-processing or simulation of real-time (post-processing), but also the results of acquisition or even coverage area when comming to the test area.
REFERENCES
Seaperch Construction Manual. K-12 educational outreach program, AUVSI Foundation and ONR (Office of Naval Research), 2011.
L. Avanthey, A. Barbier, V. Germain, R. Terrisse et V. Vittori : Ryu-jin AUV: SAUC’E 2011 Journal Paper. International Student Autonomous Underwater Vehicle Challenge - Europe, 2011.
L. Avanthey, A Gadermer et L. Beaudoin : AUV Ryujin 2013 - Tests en Fosse de Plong´ee. http://www.atis-lab.fr/robots-exploration/tests-de-lauv-hybride-ryujin-en-la-fosse-de-plongee.html , 2013. [online video].
L. Beaudoin, L. Avanthey, A. Gademer, V. Vittori, L. Dupessey et J.-P. Rudant : Aquatis and Ryujin projects: first steps to remote sensing of the sea bottom by small homemade Autonomous Underwater Vehicles. In International Geoscience and Remote Sensing Symposium - IGARSS, 2012. H. Bohm et V. Jensen : Build Your Own Underwater Robot and Other Wet
Projects. Westcoast Words, 1997.
Robert D. Christ et Robert L. Wernli : The ROV Manual: A User Guide For Observation Class Remotely Operated Vehicles. Elsevier Science, 2008. S. Corfield et C. Hillenbrand : Defence applications for Unmanned
Un-derwater Vehicles. In Ocean Science and Technology: Technology and appli-cations of Autonomous Underwater Vehicles. Taylor & Francis, 2003. E. F. S. Danson : AUV tasks in O↵shore Industry. In Ocean Science and
Technology: Technology and applications of Autonomous Underwater Vehi-cles, pages 127–138. Taylor & Francis, 2003. ISBN 0-415-30154-8.
A. Gademer : R´ealit´e Terrain ´Etendue: une nouvelle approche pour l’extraction de param`etres de surface biophysiques et g´eophysiques `a l’´echelle des individus. Th`ese de doctorat, Universit´e Paris-Est, 2010.
A. Gademer, L. Beaudoin, L. Avanthey et J.-P. Rudant : Application of the Extended Ground Thruth concept for risk anticipation concerning ecosys-tems. Radio Science Bulletin, 345:35–50, 2013.
A. Gademer, B. Petitpas, S. Mobaied, L. Beaudoin, B. Riera, M. Roux et J.P. Rudant : Developing a low cost Vertical Take O↵ and Landing Un-manned Aerial System for system for centimetric monitoring of biodiversity - The Fontainebleau Forest case. In International Geoscience and Remote Sensing Symposium - IGARSS, pages 600–603, 2010a.
A. Gademer, V. Vittori et L. Beaudoin : From light to ultralight UAV. In International Conference Unmanned Aircrafts System Forum - Eurosatory, 2010b.
A. Hogue, A. German, J. Zacher et M. Jenkin : Underwater 3D Map-ping: Experiences and Lessons learned. In Third Canadian Conference on Computer and Robot Vision (CRV), 2006.
S. Kramm : Production de cartes ´eparses de profondeur avec un syst`eme de st´er´eovision embarqu´e non-align´e. Th`ese de doctorat, Universit´e de Rouen, 2008.
M. Lhuillier et L. Quan : Robust Dense Matching using Local and Global Geometric Constraints. In RFIA’00, 2000.
N. A. Matthews : Aerial and Close-Range Photogrammetric Technology: Providing Resource Documentation, Interpretation, and Preservation. De-partment of the interior, bureau of land management, national operations center, denver, colorado, 2008.
A. M´eline : Fusion multimodale pour la cartographie sous-marine. Th`ese de doctorat, Universit´e de Montpellier, 2013.
Hartley R. et Zisserman A. : Multiple view geometry in computer vision. Cambridge University Press, 2000.
Claude Rives, Chenz et Christian P´etron : La prise de vue sous-marine. Fillipacchi, 1978. ISBN B003WVVHTC.
D. Warren, R. Church et K. Eslinger : Deepwater Archaeology With Autonomous Underwater Vehicle Technology. In O↵shore Technology Con-ference, 2007.