HAL Id: hal-00738224
https://hal.archives-ouvertes.fr/hal-00738224
Submitted on 4 Oct 2014
HAL is a multi-disciplinary open access
archive for the deposit and dissemination of
sci-entific research documents, whether they are
pub-lished or not. The documents may come from
teaching and research institutions in France or
abroad, or from public or private research centers.
L’archive ouverte pluridisciplinaire HAL, est
destinée au dépôt et à la diffusion de documents
scientifiques de niveau recherche, publiés ou non,
émanant des établissements d’enseignement et de
recherche français ou étrangers, des laboratoires
publics ou privés.
3D models-based semantic labeling of 2D objects
Raluca Diana Petre, Zaharia Titus
To cite this version:
Raluca Diana Petre, Zaharia Titus. 3D models-based semantic labeling of 2D objects. International
Conference on Digital Image Computing: Techniques and Applications (DICTA 2011), Dec 2011,
Australia. pp.152-157, �10.1109/DICTA.2011.32�. �hal-00738224�
3D Model-based Semantic Labeling of 2D Objects
Raluca-Diana Petre, Titus Zaharia
ARTEMIS Department; Institut TELECOM; TELECOM SudParis; Evry, France UMR CNRS 8145 - MAP5
Alcatel-Lucent Bell Labs France
{Raluca-Diana.Petre, Titus.Zaharia}@it-sudparis.eu Abstract—This paper tackles the issue of still image object
categorization. The objective is to infer the semantics of 2D objects present in natural images. The principle of the proposed approach consists of exploiting categorized 3D synthetic models in order to identify unknown 2D objects, based on 2D/3D matching techniques. Notably, we use 2D/3D shape indexing methods, where 3D models are described through a set of 2D views. Experimental results carried out on both MPEG-7 and Princeton 3D mesh test sets show recognition rates of up to 89%.
Keywords-indexing and retrieval; object classification; 3D mesh; 2D/3D shape descriptors.
I. INTRODUCTION
The last decade has been greatly influenced by the spectacular development of the digital technologies. Nowadays, the availability of low costs audio-visual (AV) acquisition and storage devices leads to very large collections of images and videos that can be shared by multiple users. Such databases are used in domains like media, commerce, academia, security or for personal purposes. In this context, a fundamental issue that needs to be addressed concerns the efficient handling of digital content. Retrieving specific resources (i.e., elements of interest for the user) is not possible when a large database is involved. The use of keywords is also restricted by the linguistic variety and needs a prior annotation of the digital content (involving human contribution). Manually labeling the AV material is not a solution that can be taken into account because of human subjectivity as well as time constraints.
The need for automatic object categorization methods appears as a crucial challenge. The objective is to determine automatically the semantic meaning of an object present in an image or video document. Most of the existing approaches are based on machine learning (ML) techniques and require large and already labeled training databases.
In this paper we present a method that avoids applying machine learning techniques when dealing with a large variety of objects. Instead of using ML, we propose to use categorized 3D models from existing 3D repositories in the classification process.
The paper is structured as follows. Related work is briefly presented in section 2. In Section 3 we present the 2D/3D shape-based indexing approach adopted. The object recognition framework is described in Section 4, while the experimental results are presented and analyzed in Section 5. Finally, Section 6 concludes the paper and opens perspectives of future work.
II. RELATED WORK
Research on automatic object classification is mainly based on machine learning (ML) techniques [1], [2]. The goal of ML algorithms is to automatically learn to recognize complex structures using a set of examples (so-called training set). There exist methods which require a set of labeled examples (so-called supervised ML algorithms) and also methods able to classify objects using a set of unlabeled examples (so-called unsupervised ML techniques).
In the case of supervised ML, the system disposes of a set of labeled objects divided into N classes. Based on these examples, the system finds the function which best discriminates between the N classes. Once the function is determined, it can be applied for each unknown object in order to determine to which category the object belongs. The supervised ML techniques may be highly accurate [3]. However, it may happen that the function is too appropriate for the training set and inadequate for new objects [4]. This phenomenon is known as overfitting and represents one of the main drawbacks of supervised ML approaches. A second limitation is the requirement of sufficiently large training sets containing labeled data. However, in terms of performances, the unsupervised methods are less accurate than the supervised machine learning methods. Some commonly used unsupervised machine learning methods are K-means, mixture methods and K-nearest neighbors… For some examples, the reader is invited to refer to [5], [6].
Generally, when a large number of classes has to be considered, the ML approaches need to exploit a large set of features. Thus, in such cases the computational complexity becomes intractable [7]. Also, if we take into consideration that an object may change its' appearance due to the pose variation, then the training set should include not merely different examples of objects from each class, but also different instances of each object, corresponding to different poses. The sensitivity to the object's pose of ML methods may be overcome by using a set of examples composed of 3D models.
In this paper we consider a different approach, consisting of introducing in the recognition process a priori 3D information, with the help of existing 3D models. In order to allow the matching between 2D and 3D content, the 2D/3D shape indexing is used. Such indexing techniques describe a 3D model by a set of 2D images, corresponding to 3D to 2D projections obtained with different viewing angles. The resulting projections are further described by exploiting 2D shape descriptors.
Regarding 2D/3D indexing, one of the most efficient methods (the Light Field Descriptor - LFD) is presented in [8]. The LFD uses 100 evenly distributed views; each projection is described using the contour-based Fourier coefficients [9] and the Zernike moments [10]. The same two descriptors are further combined with the Krawtchouk moments [11] and describe together the 18 views of the compact multi-view descriptor (CMVD) [12]. Also, the MPEG-7 [13] standard proposes two methods for 2D/3D indexing. Both algorithms use 3 or 7 views obtained using the principal axes of inertia of the model. The first method is region-based and supposes the decomposition of the support region function on the 2D-ART basis [14]. The second descriptor uses the contour information and its representation in the contour scale space (CSS) [15]. Another multi-scale curve representation is also proposed in [16]. Here, the shape is described by analyzing the variation in position of each contour sample when convoluting with different Gaussian filters.
The viewing angle selection problem was addressed in [17] and [18]. Here, the authors aim to reduce the number of views by selecting some prototypical projections among a large number of evenly distributed views.
As it can be observed, a rich state of the art on 2D/3D indexing algorithms can be found in the literature. However, all the above-presented methods are designed for 3D model retrieval and not for 2D to 3D matching and 2D object recognition.
However, 2D object classification using 3D models has been recently exploited in [19] and [20]. The first algorithm aims at categorizing 2D objects automatically segmented from videos, each object being represented by several instances of the object. The 3D models used in the recognition process are described using 20 projections (selected by k-means clustering of 500 evenly distributed views). The second algorithm, presented in [20], makes use of textured 3D models. A visual codebook of K=2000 clusters is built for each class of objects and used in the recognition process.
In this paper, we propose a new image recognition framework. Only the shape information of 3D models is used for recognition (in contrast with the algorithm proposed in [20] which also exploits the texture). Our choice is justified by the fact that, for a given class of objects, the shape represents a more constant feature, compared to the texture or the color which may vary for two similar objects. The recognition performances of the proposed algorithm are evaluated using test objects from 23 categories (compared to the work presented in [19] and [20] which test only 3, respectively 2 classes of objects). Finally, we propose a comparative evaluation of different 2D/3D indexing methods.
III. SHAPE-BASED 2D/3DINDEXATION
Let us first recall the general principle of 2D/3D indexing methods.
A. The principle of 2D/3D indexing methods
The underlying principle of 2D/3D indexing approaches is based on the following observation: two similar 3D models should present similar views when projected in 2D images
from similar perspectives (e.i. frontal projection, profile projection…). Thus, instead of describing a 3D object in the original 3D space, the model is represented as a set of 2D views associated to different projection angles (and under the assumption of a given projection model).
Such a strategy makes it possible to compare two different 3D models, but also to compare a 3D model with a 2D object present in 2D images.
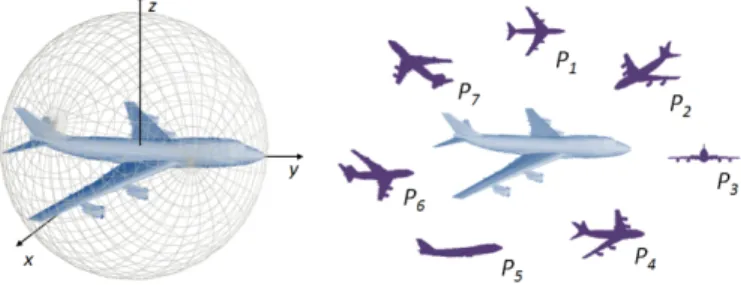
In order to obtain a unique set of views, whatever the object's size, position or orientation, each model M is first centered in the origin of the Cartesian system and resized to fit the unit sphere. Furthermore, the model is projected and rendered in 2D from N different viewing angles, resulting in a set of N projections, denoted by Pi(M). In our case, we have
exclusively used binary images corresponding to the projected silhouettes (Figure 1). Finally, each projection Pi(M) is
described by a 2D shape descriptor di(M). The set of all
descriptors {di(M)} yields the 2D/3D representation of the
considered 3D object.
Figure 1. Projecting a model. a. Viewing directions ni; b. Model projection according to the n1 direction; c. the resulting silhouette images.
In order to fully set up a 2D/3D indexing approach, several elements have to be specified. The first one is the set of viewing directions {ni} used to perform the projections. Also,
the number of images per model has to be carefully considered, since a large number of silhouettes provide more complete descriptions but also increases the computational cost of the subsequent matching algorithms. Finally, the choice of appropriate 2D shape descriptors is fundamental for ensuring a discriminant description.
The next section presents the different 3D/2D projection strategies as well as the 2D shape descriptors considered in our work.
B. The proposed 2D/3D indexing methods 1) The viewing angles selection:
Several strategies for selecting a set of viewing angles can be considered. A first approach, also proposed by the MPEG-7 standard [21], is based on the assumption that the most discriminant views are those corresponding to the principal planes (obtained with the Principal Component Analysis (PCA) [22] (Figure 2).
Moreover, the three principal planes define eight octants. If we consider their bisectors, four additional views can be added to the first three images in order to obtain a more complete representation. From now on, we will refer to these PCA-based
strategies as PCA3 and PCA7 (with 3 and respectively 7 views).
Figure 2. a. PCA-based positioning of the camera; b. The three projections on the principale planes; c. the four secondary views
A second approach for the viewing angle selection aims at obtaining a uniform camera distribution around the model. A first method, introduced in [8], consists of considering the vertices of a regular dodecahedron which results in 10 views. Two sub-cases can be further considered. The first case corresponds to the situation where object's axes of inertia are aligned with the coordinate system (for example, by using PCA). In the second case, the object has an arbitrary, random orientation (Figure 3). As the dodecahedron-based positioning of the camera is used for the Light Field Descriptor (LFD) [8], we will use the acronyms LFDPCA respectively LFD for denoting these two projection strategies.
Figure 3. Left: Dodecahedron-based positioning of the camera. The cameras are placed on the vertices of the dodecahedron and oriented toward
the 3D model. Right: the resulting views.
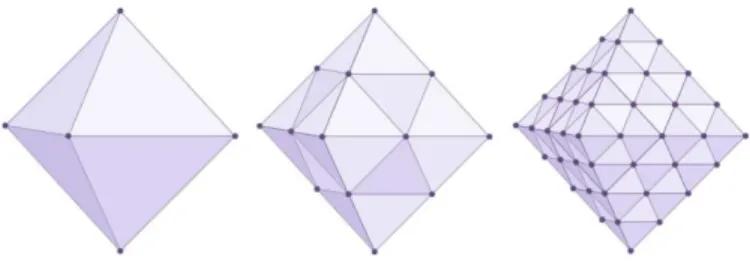
Finally, we have also considered a third projection strategy which combines the previous two, using at the same time the views on the principal planes (given by PCA) and a uniform distribution of the cameras around the object. In this case, the vertices of an octahedron are used are used to sample the unit sphere and thus define the viewing angles [23]. In order to obtain additional views, each face of the octahedron is successively subdivided. At the first level there are 3 viewing directions (which are the same of the PCA3 strategy). At the second level 9 views are obtained while at the third level 33 (Figure 4). From now on, we will refer to these techniques as
OCTA3, OCTA9 and OCTA33.
Figure 4. Octahedron-based camera positioning. The cameras are placed on the vertices of the octahedron and oriented toward the 3D model.
2) The 2D shape description:
The second part of the 2D/3D indexing process concerns the extraction of the 2D shape descriptors. As the views are binary images representing only the shape of the object (without internal contours, textures, shadows…), the only features that can be exploited are the exterior contour and the corresponding region of support. In our work, we have considered two contour-based and two region-based descriptors, briefly recalled here below.
Let us start with the Contour Scale Space (CSS or CS) descriptor [15] proposed by the MPEG-7 standard [24], [25], [13]. The CSS is obtained by successively convolving the contour curve with a Gaussian kernel. Using a multi-scale analysis process, the curvature peaks are determined, with curvature value and corresponding position in curvilinear abscise. The associated similarity measure between two CSS representations is based on a matching procedure which takes into account the cost of fitted and unfitted curvatures peaks [13].
The second approach adopted is the MPEG-7 Region Shape (RS) descriptor, based on the 2D Angular Radial Transform (ART) [14]. In this case, the object's support function is represented as a weighted sum of 34 ART basis functions. The decomposition coefficients constitute the descriptor. The distance between two shapes is simply defined as the L1
distance between the absolute values of the ART coefficients. Another region descriptor is based on the 2D Hough Transform (HT) [26]. Each point p corresponding to the silhouette of the object is represented in the (s, θ) space. If we consider a line l passing through the point p, then θ is the angle between the line l and the Ox axe, and s represents the distance from the coordinate system origin to the line. Therefore, the image can be represented in the (s, θ) cumulative space. The associated similarity measure between two HT representations is the L1 distance computed for the (s, θ) coefficients.
Finally, we propose a new descriptor, so-called Angle Histogram (AH). The shape contour is first sub-sampled in a number of successive 2D points. The angle histogram is created by computing the angles defined by each three consecutive samples. In our experiments, we have used a 18 bins histogram for an 180 interval. Different histograms are obtained, depending on the sampling steps. When the sampling step is small, the histogram will encode the details of the contour, while for big values the global features are extracted. The 2D AH results by concatenating five angle histograms obtained with different sampling steps. A simple L1 distance is
used as similarity measure.
Let us now describe the 2D shape recognition framework proposed.
IV. 2DSHAPE RECOGNITION FRAMEWORK
Figure 5 presents an overview of the 2D shape recognition framework.
A 3D categorized database is supposed to be available. Each model in the database is described by the four descriptors presented in Section III.B.2) for all the 6 projection strategies
retained (i.e., PCA3, PCA7, LFD, LFDPCA, OCTA9, OCTA33).
Figure 5. The 2D shape recognition framework.
As input to the system, we consider a binary image corresponding to an unknown object whose semantics needs to be determined. Such an object can be obtained with the help of some semi-automatic segmentation methods [27]. The 2D binary object is also indexed with all the 4 shape descriptors retained.
The distance d(O,M) between the 2D object O and the 3D model M is given by the minimum distance between the 2D object and all the projections Pi(M) of the 3D model.
( , ) min , ( ) . (1)
In order to retrieve the category of the input image, the system analyzes which are the most similar objects. Next, the categories that are the most represented among the first top retrieved 3D models are presented as candidate classes of the 2D object.
In order to measure the performance of this 2D shape recognition system, we have established an experimental evaluation protocol, described in the next section.
V. EXPERIMENTAL EVALUATION
The experiments have been carried out on two different 3D model databases. First, the MPEG-7 dataset [21], which is composed of 362 models divided into 23 semantic classes. Categories include humanoids, airplanes, helicopters, cars, race cars, trees (with and without leafs), rifles, missiles, pistols etc. These models present intra-class variability as well as inter-class similarity. The second 3D database we have used is the Princeton Shape Benchmark (PSB) [28], which includes 1814 models semantically categorized in 161 classes. Compared to the MPEG-7 database, this classification is more precise and presents a hierarchical tree structure which supports sub-classes, For example, a distinction between commercial airplanes, (e.g., biplanes, fighter jet, glider airplane...) is done for the “airplane” category. The PSB database includes various models representing aircrafts, animals, furniture, plants, sea vessels, musical instruments, tools, vehicles …
We have also created a 2D object database consisting of
N=115 images randomly chosen from the web (corresponding
to 5 images for each MPEG-7 category). When using the PSB, only 65 objects have been considered (corresponding to the 13 categories that are common for the MPEG-7 and the PSB databases). For each image, the objects of interest have been manually segmented from the available images.
Moreover, in order to dispose of a larger test set, we have created a synthetic image database, representing 3D/2D projections of 39 MPEG-7 objects (i.e., 3 models for each one of the 13 categories that are common for both MPEG-7 and PSB 3D models repositories). A number of 10 views, corresponding to the LFD viewing angle selection strategy, were generated for each of the 39 models, resulting in a synthetic image database of 390 views.
The performance measure adopted is the recognition rate (RR), defined as the percentage of cases where the correct category is assigned to the input image. In order to determine the class C(O) associated to a 2D object O, the NM most similar
3D models (M1… MN) from the database are considered. Each
model belongs to a category. We can thus identify a number of
NC most represented categories among the NM top retrieved
results (C1 … CNc). If one of these classes coincides with the
category to which belongs the image, then we can state that the recognition has succeeded.
The RR score is defined as a function of the number NC of
possible categories accepted, as described by the following equation:
( ) ∑ ( , ). , (2)
where
, 1; ( )0; … . (3)
In our experiments, we have taken into account one, two or three most represented categories (Nc = 1,2,3). In the case of Princeton database, where the number of existing categories is
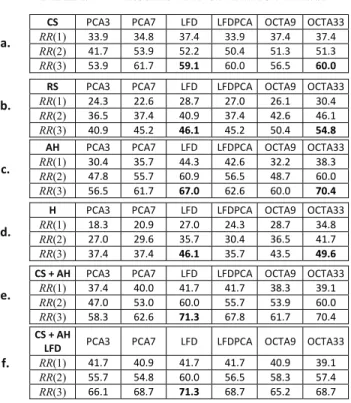
TABLE I. RECOGNITION RATE FOR THE MPEG-7DATABASE
a.
CS PCA3 PCA7 LFD LFDPCA OCTA9 OCTA33
RR(1) 33.9 34.8 37.4 33.9 37.4 37.4
RR(2) 41.7 53.9 52.2 50.4 51.3 51.3
RR(3) 53.9 61.7 59.1 60.0 56.5 60.0
b.
RS PCA3 PCA7 LFD LFDPCA OCTA9 OCTA33
RR(1) 24.3 22.6 28.7 27.0 26.1 30.4
RR(2) 36.5 37.4 40.9 37.4 42.6 46.1
RR(3) 40.9 45.2 46.1 45.2 50.4 54.8
c.
AH PCA3 PCA7 LFD LFDPCA OCTA9 OCTA33
RR(1) 30.4 35.7 44.3 42.6 32.2 38.3
RR(2) 47.8 55.7 60.9 56.5 48.7 60.0
RR(3) 56.5 61.7 67.0 62.6 60.0 70.4
d.
H PCA3 PCA7 LFD LFDPCA OCTA9 OCTA33
RR(1) 18.3 20.9 27.0 24.3 28.7 34.8
RR(2) 27.0 29.6 35.7 30.4 36.5 41.7
RR(3) 37.4 37.4 46.1 35.7 43.5 49.6
e.
CS + AH PCA3 PCA7 LFD LFDPCA OCTA9 OCTA33
RR(1) 37.4 40.0 41.7 41.7 38.3 39.1
RR(2) 47.0 53.0 60.0 55.7 53.9 60.0
RR(3) 58.3 62.6 71.3 67.8 61.7 70.4
f.
CS + AH
LFD PCA3 PCA7 LFD LFDPCA OCTA9 OCTA33
RR(1) 41.7 40.9 41.7 41.7 40.9 39.1
RR(2) 55.7 54.8 60.0 56.5 58.3 57.4
more important (161 classes), we have also computed the score RR(NC=10).
The parameter NM, which gives the length of the analysis
window, has been set to 20, which represents approximately the average size of the categories.
Table 1 presents the scores obtained using the MPEG-7 database, while tables 2 and 3 respectively show the recognition rates achieved for real and synthetic images using PSB.
For both databases, we observe a global behavior regarding the viewing angle selection. In most cases, the LFD and OCTA33 strategies led to the maximal performances in terms of recognition rate, whatever the considered descriptor.
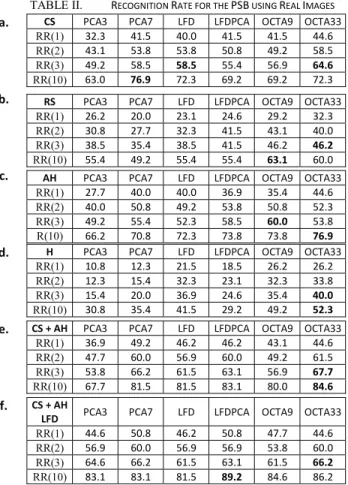
In the case of the MPEG-7 database, we achieve 60% recognition rate for the CS descriptor and 70.4% for the AH representation. In the case of PSB database, the same global behaviors were observed. CS and AH are the descriptors providing the highest recognition rates, with RR(3) scores of 64.6% and respectively 60% when classifying real objects and of 71.3% and 66.9% when synthetic views are used. When considering the RR(10) scores, the recognition rates of real images increase up to 76.9% for both CS and AH descriptors. In the case of synthetic query images, we achieved RR(10) scores of 83.1% and 82.3% with CS and AH descriptor respectively.
We have also tested our system when the two descriptors with the best performance (i.e., CS and AH) were combined (tables I.e., II.e and III.e.). The idea here is to attempt to exploit the possible complementarities between the two descriptors. Thus, when analyzing the first NM most similar models (which
determine the NC most represented categories), we have taken
into account not only the NM most similar models obtained with
the CS descriptor but also those obtained with the AH descriptor. In total, 2NM models were considered to determine
the NC most represented categories. Thus, the RR(3) scores for
real images have increased up to 71.3% when using the MPEG-7 database and up to 6MPEG-7.MPEG-7% when PSB was used. Also, the recognition rate of the combined descriptor has improved to 84.6% when analyzing the RR(10) score for real object images and to 88.5% when synthetic views were employed.
As the LFD strategy provides promising results, while using a small number of views per model, we have also tested the combination between the LFD and all the other projection strategies. Here again, we have analyzed both the models retrieved with the LFD projection strategy and those obtained when using PCA3/PCA7/LFD/LPFDPCA/OCTA9/OCTA33 (tables I.f., II.f. and III.f.). When using this combined strategy, we have reached RR(10) score of 89.2% when LFD is combined with LFDPCA.
The results presented above show the interest of integrating some a priori knowledge in the recognition process, driven from existing 3D models and exploited with the help of 2D/3D indexing techniques.
TABLE II. RECOGNITION RATE FOR THE PSB USING REAL IMAGES
a. CS PCA3 PCA7 LFD LFDPCA OCTA9 OCTA33 RR(1) 32.3 41.5 40.0 41.5 41.5 44.6 RR(2) 43.1 53.8 53.8 50.8 49.2 58.5 RR(3) 49.2 58.5 58.5 55.4 56.9 64.6 RR(10) 63.0 76.9 72.3 69.2 69.2 72.3
b. RS PCA3 PCA7 LFD LFDPCA OCTA9 OCTA33 RR(1) 26.2 20.0 23.1 24.6 29.2 32.3 RR(2) 30.8 27.7 32.3 41.5 43.1 40.0 RR(3) 38.5 35.4 38.5 41.5 46.2 46.2 RR(10) 55.4 49.2 55.4 55.4 63.1 60.0
c. AH PCA3 PCA7 LFD LFDPCA OCTA9 OCTA33 RR(1) 27.7 40.0 40.0 36.9 35.4 44.6 RR(2) 40.0 50.8 49.2 53.8 50.8 52.3 RR(3) 49.2 55.4 52.3 58.5 60.0 53.8 R(10) 66.2 70.8 72.3 73.8 73.8 76.9
d. H PCA3 PCA7 LFD LFDPCA OCTA9 OCTA33 RR(1) 10.8 12.3 21.5 18.5 26.2 26.2 RR(2) 12.3 15.4 32.3 23.1 32.3 33.8 RR(3) 15.4 20.0 36.9 24.6 35.4 40.0 RR(10) 30.8 35.4 41.5 29.2 49.2 52.3
e. CS + AH PCA3 PCA7 LFD LFDPCA OCTA9 OCTA33 RR(1) 36.9 49.2 46.2 46.2 43.1 44.6 RR(2) 47.7 60.0 56.9 60.0 49.2 61.5 RR(3) 53.8 66.2 61.5 63.1 56.9 67.7 RR(10) 67.7 81.5 81.5 83.1 80.0 84.6
f. CS + AH
LFD PCA3 PCA7 LFD LFDPCA OCTA9 OCTA33
RR(1) 44.6 50.8 46.2 50.8 47.7 44.6 RR(2) 56.9 60.0 56.9 56.9 53.8 60.0 RR(3) 64.6 66.2 61.5 63.1 61.5 66.2 RR(10) 83.1 83.1 81.5 89.2 84.6 86.2
TABLE III. RECOGNITION RATE FOR THE PSB USING SYNTHETIC IMAGES
a.
CS PCA3 PCA7 LFD LFDPCA OCTA9 OCTA33 RR(1) 29,5 42,8 47,7 45,1 45,4 50,0 RR(2) 42,3 55,6 62,1 57,4 57,9 65,4 RR(3) 49,7 61,0 66,9 65,4 63,6 71,3 RR(10) 65,9 76,7 79,5 79,0 78,7 83,1
b.
RS PCA3 PCA7 LFD LFDPCA OCTA9 OCTA33 RR(1) 28,2 27,9 40,8 34,1 33,6 45,4 RR(2) 36,7 42,1 54,6 48,7 49,5 59,7 RR(3) 40,0 50,5 57,9 55,4 54,6 64,6 RR(10) 51,8 65,4 75,6 70,0 67,7 77,9
c.
AH PCA3 PCA7 LFD LFDPCA OCTA9 OCTA33 RR(1) 25,6 35,4 39,2 39,7 36,2 40,8 RR(2) 34,9 49,0 54,6 53,3 48,7 56,9 RR(3) 40,0 55,1 60,3 61,3 54,9 66,9 RR(10) 59,7 72,6 77,4 75,9 72,1 82,3
d.
H PCA3 PCA7 LFD LFDPCA OCTA9 OCTA33
RR(1) 15,4 23,1 35,1 24,6 29,2 36,7 RR(2) 23,1 31,8 44,1 34,4 40,8 50,3 RR(3) 27,4 37,9 49,2 37,9 45,9 55,9 RR(10) 41,8 53,3 69,5 57,4 61,3 73,6
e.
CS + AH PCA3 PCA7 LFD LFDPCA OCTA9 OCTA33 RR(1) 35,1 46,4 48,7 51,3 48,7 54,6 RR(2) 45,4 59,7 64,6 64,1 59,0 69,7 RR(3) 51,3 66,4 70,8 71,0 66,4 74,4 RR(10) 67,7 80,8 83,1 81,5 80,0 88,5 f. CS + AH
LFD PCA3 PCA7 LFD LFDPCA OCTA9 OCTA33
RR(1) 44,4 48,5 48,7 51,8 51,5 52,3 RR(2) 61,3 63,6 64,6 66,9 64,1 69,2 RR(3) 67,9 71,0 70,8 74,1 72,3 75,1 RR(10) 83,6 86,2 83,1 85,4 85,9 88,5
Despite the fact that the highest scores are obtained when several candidate categories are taken into consideration (NC≠1), we believe that such a multiple response is still very
useful. Our framework can be used in order to reduce the number of candidate categories from 161 (in the case of PSB database) to NC. Therefore, if we integrate this approach within
existing machine learning techniques, we can significantly speed-up the recognition process. Such a mixed system would also allow achieving superior recognition rates.
VI. CONCLUSIONS AND FUTURE WORK
In this paper we have presented a novel recognition algorithm for semantic labeling of 2D objects extracted from still images. As the projection strategy and the 2D shape descriptors are key issues for the 2D/3D indexing methods, we have analyzed the performances of different such approaches. Thus, we observed that LFD and OCTA33 strategies provide better scores in most cases. When comparing the four descriptors that we have tested, we have observed that the two contour-based descriptors (i.e., CS and AH) provided highest recognition rates. Moreover, we have exploited their complementarities by combining them and thus improving the scores obtained with only one descriptor. We have also computed the recognition rates obtained when combining two indexing methods based on different projection strategies. As a result, the scores were further improved (up to 89.2% for RR(10) score) when we considered two viewing angle selection approaches.
In our future work we intend to extend the proposed approaches to 2D video objects. By using a tracking tool, the system will dispose of several views per query model. This additional information could greatly help the recognition process.
Furthermore, we plan to integrate an approach exploiting the internal edges of the shape in order to obtain more discriminant descriptions.
ACKNOWLEDGMENT
This work has been performed within the framework of the UBIMEDIA Research Lab, between Institut TELECOM and Alcatel-Lucent Bell-Labs.
REFERENCES
[1] Mitchell, T. M.,. Machine Learning. New York: McGraw-Hill. 1997. [2] Xue, M., Zhu, C., A Study and Application on Machine Learning of
Artificial Intelligence, International Joint Conference on Artificial Intelligence, pp. 272, July 2009.
[3] Deselaers, T., Heigold, G., Ney, H., Object classification by fusing SVMs and Gaussian mixtures, Vol. 43, Issue 7, pp. 2476-2484, July 2010.
[4] Pados, G.A., Papantoni-Kazakos, P., A note on the estimation of the generalization error and prevention of overfitting [machine learning], IEEE Conference on Neural Networks, volume 1, pp 321, July 1994. [5] M. Weber, M. Welling, and P. Perona. Unsupervised learning of models
for recognition. In Proc. ECCV, pages 18–32, 2000.
[6] R. Fergus, P. Perona, A. Zisserman. Object class recognition by unsupervised scale-invariant learning, Proceedings of IEEE Conference on Computer Vision and Pattern Recognition, Vol. 2 (2003), pp. 264-271, June 2003.
[7] Li, Ling, Data complexity in machine learning and novel classification algorithms. Dissertation (Ph.D.), California Institute of Technology, 2006.
[8] Ding-Yun Chen, Xiao-Pei Tian, Yu-Te Shen and Ming Ouhyoung, On visual similarity based 3D model retrieval, Computer Graphics Forum, vol. 22, no. 3, pp. 223-232, 2003.
[9] D. S. Zhang and G. Lu., An Integrated Approach to Shape Based Image Retrieval, Proc. of 5th Asian Conferenceon Computer Vision (ACCV), pp. 652-657, Melbourne, Australia, January 2002.
[10] R. Mukundan and K. R. Ramakrishnan, Moment Functions in Image Analysis: Theory and Applications, World Scientific Publishing Co Pte Ltd., September 1998.
[11] P.T.Yap, R.Paramesran and S.H.Ong, Image Analysis by Krawtchouk Moments, IEEE Transactions on Image Processing, Vol. 12, No. 11, pp. 1367-1377, November 2003.
[12] Petros Daras, Apostolos Axenopoulos, A Compact Multi-View descriptor for 3D Object Retrieval, Seventh International Workshop on Content-Based Multimedia Indexing, pp.115-119, June 2009.
[13] ISO/IEC 15938-3: 2002, MPEG-7-Visual, Information Technology – Multimedia content description interface – Part 3: Visual, Singapore, March 2002.
[14] W.-Y. Kim, Y.-S. Kim, New Region-Based Shape Descriptor, ISO/IEC MPEG99/M5472, Maui, Hawaii, December 1999.
[15] F. Mokhtarian, A.K. Mackworth, A Theory of Multiscale, Curvature-Based Shape Representation for Planar Curves, IEEE Transaction on Pattern Analysis and Machine Intelligence, Volume 14, No. 8, pp. 789-805, August 1992.
[16] T. Napoléon, T. Adamek, F. Schmitt,N.E. O'Connor, Multi-view 3D retrieval using silhouette intersection and multi-scale contour representation, SHREC 2007 - Shape Retrieval Contest, Lyon, France, June 2007.
[17] C. Cyr and B. Kimia, 3D object recognition using shape similarity-based aspect graph, Proc. 8th IEEE Int. Conf. Comput. Vision, Vancouver, BC, Canada, Volume 1, pp. 254–261, 2001.
[18] H. Yamauchi, W. Saleem, S. Yoshizawa, Z. Karni, A. Belyaev, H.-P. Seidel, Towards Stable and Salient Multi-View Representation of 3D Shapes, IEEE Int. Conf. on Shape Modeling and Applications, 2006, pp.40-40, 14-16, June 2006.
[19] A. Toshev, A. Makadia, and K. Daniilidis: Shape-based Object Recognition in Videos Using 3D Synthetic Object Models, IEEE Conference on Computer Vision and Pattern Recognition, Volume 60, No. 2, pp. 91-110, Miami, FL, 2009.
[20] J. Liebelt, C. Schmid, and K. Schertler. Viewpoint-independent object class detection using 3D Feature Maps. In IEEE CVPR, pp. 1-8, 2008. [21] T. Zaharia, F. Prêteux, 3D versus 2D/3D Shape Descriptors: A
Comparative study, In SPIE Conf. on Image Processing: Algorithms and Systems, Vol. 2004 , Toulouse, France, January 2004.
[22] R.A. Schwengerdt, Remote Sensing: Models and Methods for Image Processing, 2nd. Ed., Academic Press, 1997.
[23] Petre, R., Zaharia, T., Preteux, F., An overview of view-based 2D/3D indexing methods, Proceedings of Mathematics of Data/Image Coding, Compression, and Encryption with Applications XII, volume 7799, pp. 779904, August 2010.
[24] M. Bober, MPEG-7 Visual Shape Descriptors, IEEE Transaction on Circuits and Systems for Video Technology, Volume 11, Issue 6, pp. 716-719, August 2002 .
[25] B.S. Manjunath, Phillipe Salembier, Thomas Sikora, Introduction to MPEG-7: Multimedia Content Description Interface, John Wiley & Sons, Inc., Volume 1, New York, NY, 2002.
[26] Hart, P.E.: How the Hough transform was invented, IEEE Signal Processing Magazine, Volume 26, No. 6, pp. 18-22, November 2009. [27] Sapna Varshey, S., Rajpal, R, Comparative study of image segmentation
techniques and object matching using segmentation, Proceeding of International Conference on Methods and Models in Computer Science, pp. 1-6, January 2010.
[28] Philip Shilane, Patrick Min, Michael Kazhdan, and Thomas Funkhouser, The Princeton Shape Benchmark, Shape Modeling International, Genova, Italy, June 2004.