HAL Id: hal-02863781
https://hal.archives-ouvertes.fr/hal-02863781
Submitted on 10 Jun 2020
HAL is a multi-disciplinary open access
archive for the deposit and dissemination of
sci-entific research documents, whether they are
pub-lished or not. The documents may come from
teaching and research institutions in France or
abroad, or from public or private research centers.
L’archive ouverte pluridisciplinaire HAL, est
destinée au dépôt et à la diffusion de documents
scientifiques de niveau recherche, publiés ou non,
émanant des établissements d’enseignement et de
recherche français ou étrangers, des laboratoires
publics ou privés.
Fall Detector Adapted to Nursing Home Needs through
an Optical-Flow based CNN
Alexy Carlier, Paul Peyramaure, Ketty Favre, Muriel Pressigout
To cite this version:
Alexy Carlier, Paul Peyramaure, Ketty Favre, Muriel Pressigout. Fall Detector Adapted to Nursing
Home Needs through an Optical-Flow based CNN. 42nd Annual International Conference of the
IEEE Engineering in Medicine and Biology Society - EMBC2020, Jul 2020, Montreal, Canada.
�hal-02863781�
Fall Detector Adapted to Nursing Home Needs through an Optical-Flow
based CNN
Alexy CARLIER
1∗, Paul PEYRAMAURE
1∗, Ketty FAVRE
2and Muriel PRESSIGOUT
1Abstract— Fall detection in specialized homes for the elderly is challenging. Vision-based fall detection solutions have a significant advantage over sensor-based ones as they do not instrument the resident who can suffer from mental diseases. This work is part of a project intended to deploy fall detection solutions in nursing homes. The proposed solution, based on Deep Learning, is built on a Convolutional Neural Network (CNN) trained to maximize a sensitivity-based metric. This work presents the requirements from the medical side and how it impacts the tuning of a CNN. Results highlight the importance of the temporal aspect of a fall. Therefore, a custom metric adapted to this use case and an implementation of a decision-making process are proposed in order to best meet the medical teams requirements. Clinical relevance This work presents a fall detection solution enabled to detect 86.2% of falls while producing only 11.6% of false alarms in average on the considered databases.
I. INTRODUCTION
In specialized homes for the elderly, fall is the leading cause of death due to trauma as a resident falls 1.7 times a year in average in France [1]. Some of them being more or less prone to falls, medical teams may discover a person who has fallen to the ground only after several hours [2]. In this context, a fall detector must detect falls while avoiding false alarms unnecessarily disturbing to the medical staff, which can not afford too frequent and intuitive interruptions. According to a study [3] conducted with specialized med-ical teams, residents and families in three different nursing homes, the solution must:
• detect as many falls as possible;
• give no false alarms;
• not be an extra equipment to be worn by the resident;
• be re-configurable and adaptable to different residents.
Fall detection solutions are divided into two types of ap-proaches: sensor-based and vision-based. This work focuses on vision-based solutions since wearable sensor-based ones do not meet medical staff requirements. Indeed, they are not adequate when dealing with people suffering from mental diseases which is more frequent with older people. More-over, even if a camera can cause privacy issues, the study shows that majority of medical teams, residents and families approve its use for residents safety and independence.
In general, a fall leads to a change of the human body velocity and position. Thus, in image-based techniques, fea-tures such as 2D human body pose estimation [4], movement
1Univ Rennes, INSA Rennes, CNRS, IETR - UMR 6164, Rennes, France. 2Univ Rennes, CNRS, IETR - UMR 6164, Rennes, France.
∗Both authors contributed equally to this work.
vectors or person silhouettes using background subtraction algorithms [5] are extracted from images. These features, enabling to locate the person and know its spatial body orientation, are usually fed to a classifier such as Gaussian Mixture Model (GMM) [6] or Support Vector Machine (SVM) [7] [8]. The difficulty to characterize falls led the community to consider its temporal aspect. The use of Long Short-Term Memory (LSTM) [9] networks enables advances in vision-based fall detection. Another approach is to feed several RGB images directly to a 3D Convolutional Neural Network (CNN) [10] [11] to exploit their temporal aspect.
Due to disabilities and/or old age, elderly falls can be char-acterized by different types and velocities of movement: hard falls (from standing position) and soft falls (from another starting point). They are therefore very difficult to model. Thus, a solution based on a neural network that takes into account human body motion changes seems to be adapted to this problem. The presented solution is optical-flow based and uses a CNN originally trained to maximize a sensitivity metric [12]. We propose a different training approach using realistic metrics adapted to the application as well as a decision-making process adjustment which minimizes the number of false alarms and ensures a sufficient correct detection rate according to medical staff requirements.
II. METHODOLOGY A. Solution overview
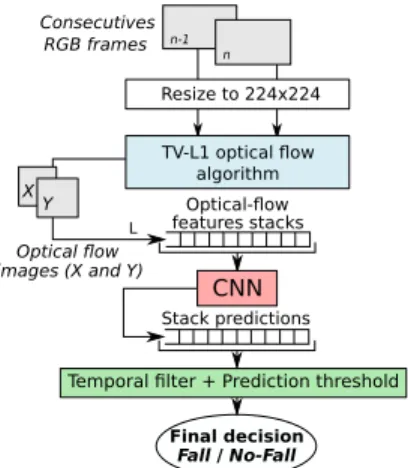
The general solution presented in Fig. 1 is made of three stages. The first step takes as input two consecutive RGB images from a camera to generate a pair of optical flow images using the dense optical-flow TV-L1 algorithm [13]. The second step of the solution is a custom VGG-16 CNN designed as in [14] and pre-trained as in [12]. It takes as input a stack S of L = 10 consecutive pairs of optical flow images and infers a fall prediction. Finally, a custom temporal filter and a prediction threshold are applied to the CNN output in order to exploit the fall temporal aspect. In this way, a single or consecutive stacks S, labeled as Fall at the temporal filter output, raise a fall alarm to the medical staff.
B. Databases and training procedure
Three labeled fall video databases (URFD [15], FDD [16], Multicam [17]) are used for the training and test processes. They are composed of videos containing a fall action or not. Those which contain daily-life actions are annotated as non-fall. Fall videos are split into three parts: the
pre-fallwhich is the action time before the fall, the fall action,
n-1 n Fall / No-Fall Optical flow Consecutives RGB frames images (X and Y) Final decision Resize to 224x224 X Y TV-L1 optical flow algorithm features stacksOptical-flow
Stack predictions
L
CNN
Temporal filter + Prediction threshold
Fig. 1. Solution overview from the input (RGB frames) to the output (final decision Fall / No-Fall)
on the ground. The classifier of the CNN has two output classes: Fall and No-Fall. Fall class contains fall actions and
No-Fall class takes into account pre-fall, post-fall and
non-fall video sequences. Fall action databases usually contain
more daily-life actions than falls. In order to fine-tune the classifier, which is composed by two last Fully-Connected (FC) layers of the CNN, and overcome unbalanced data, a weighted binary cross-entropy loss function (1) is adopted as proposed in [12]. In that equation, p is the prediction of
the network, t is the ground-truth, the class weight w0 is
associated to Fall class and w1 to No-Fall class.
loss(p, t) = −(w1. t . log(p)+w0. (1−t) . log(1−p)) (1)
Leveraging on transfer-learning, it is possible to achieve fall detection while the amount of data is limited. All network layers except the last two FC layers are frozen. That two last FC are trained with fall databases using the 5-cross fold validation [18]. In order to have a training framework usable for any other database, our training approach differs from [12] on these points:
• During the 5-cross fold validation, each video sequence
is entirely stored in a single fold. It avoids having similar stacks in the train set and in the test set. More-over, the train set and the validation set are filled with different videos in order to avoid overfitting. Then for a given initial fall video sequence, the derived sequences pre-fall, fall and post-fall are in the same fold.
• At testing time, a Transition class is used in addition to
Falland No-Fall classes in order to bring realistic cases.
This class contains frames at the transition between
pre-falland fall and the transition between fall and post-fall
sequences. These particular testing frames are not used in [12] and [14].
In order to obtain the best training efficiency possible, a grid search methodology is used with the following hyper-parameter ranges:
• Learning rate λ: {10−2, 10−3, 10−4, 10−5, 10−6}
• Batch size Bs: {128, 256, 512, 1024}
• Class weight w0: {1, 2, 5, 10, 15, 20} and w1: {1}
• Classifier activation function fact: {ELU, ReLU}
Configurations are evaluated through specificity sp (2), sensitivity se (3) and precision p (4) where T P stands for True Positives, T N for True Negatives, F P for False Positives and F N for False Negatives. These metrics are computed over stack predictions and are used to choose the best hyper-parameters configuration.
sp = T N /(T N + F P ) (2)
se = T P /(T P + F N ) (3)
p = T P /(T P + F P ) (4)
In [12], authors focus on maximizing sensitivity which leads to a decrease of specificity and precision. In our case, according to medical staff requirements which are explained in section I, specificity and precision are favored and it must be a trade-off with the sensitivity.
C. Alarm precision oriented fall evaluation
It is difficult to determine the exact beginning and end of a fall which makes it a complex event to characterize. Furthermore, the duration of a fall must be taken into account when evaluating the predictions. As presented in section II-A, the network makes a prediction with L consecutive optical flow images. In the considered databases, the average fall duration is 1.11 seconds as seen in Table I. This means that a fall prediction is made during 1/3 of the average fall duration considering a 30 FPS recording. The addition of a temporal filter, as defined below, reinforces the time aspect of a fall and aggregates safe signals while reducing false alarms.
TABLE I DATABASES PROPERTIES
Database Frame rate Avg. fall duration Number (FPS) (frames - seconds) of falls
URFD 30 30 - 1.00 30
FDD 25 24 - 0.96 99
Multicam 30 41 - 1.36 200
Avg. 28 32 - 1.11
-In the temporal analysis step, predictions are considered no longer as stacks but as consecutive identical stack prediction
types. They are labeled either as T Pa for a true fall alarm,
as F Pa for a false fall alarm, or as F Na for a miss-detected
fall. The implemented convolution filter is modeled by a gate function. It is defined by its width W (in frames or
seconds) conjointly tuned with the prediction threshold Tpred
of the filter. Below Tpred, a prediction is labeled as fall.
These parameters are adjusted with the aim of minimizing the number of false alarms without missing falls. To measure
this capability, Fβ (7) is a function of the alarm precision
pa (5) and the alarm sensitivity sea (6) in the same spirit
as in [19]. When 0 < β < 1, Fβ metric weighs sensitivity
less than precision by emphasizing more on false alarms and inversely when β > 1. This metric enables a realistic fall detector evaluation with respect to the medical requirements.
pa= T Pa/(T Pa+ F Pa) (5) sea= T Pa/(T Pa+ F Na) (6) Fβ= (1 + β2) . pa . sea (β2 . p a) + sea (7)
III. EXPERIMENTS A. Hyper-parameters choice
Hyper-parameters of the CNN training are adjusted regard-ing the previously exposed specifications, namely a trade-off between high specificity and sufficient sensitivity.
The first hyper-parameter to be tuned is the learning rate
λ. From the studied values, 10−2 is too high and causes the
model to diverge. On the other hand, the model converges
too slowly for a learning rate lower than 10−4.
Concerning the batch size Bs, the choice made in [12] (i.e. 1024) may not lead to a well converged model as it was too high. From our experiments, a smaller batch size (of 128 or 256) leads to a better specificity. It deteriorates the sensitivity se due to an increase of F N but leads to a
small impact on the alarm sensitivity sea.
The activation function ELU leads to a better sensitivity than the ReLU activation function that gives a better speci-ficity. ReLUs are therefore chosen for our use case.
Finally, a Receiver Operating Characteristic (ROC)
analy-sis is made on the class weight w0(w1is arbitrarily set to 1)
to put emphasis on Fall class and select the configuration
giv-ing the best specificity. In practice, w0higher than 5 implies
instabilities in results both with balanced and unbalanced
amounts of data in each class. w0set to 2, as in [12], slightly
increases the specificity and avoids overfitting on the F all class. Best configurations giving a well-trained model with an acceptable specificity are summarized in Table II.
TABLE II
BEST TRAINING CONFIGURATIONS AND ASSOCIATED RESULTS(IN%) ID λ w0 Bs fact seURFDsp seFDDsp Multicamse sp
1 10−3 2 128 ReLU 95.5 93.2 94.7 97.5 56.5 99.4
2 10−3 2 256 ReLU 89.5 94.1 93.5 97.6 59.4 99.0
3 10−4 2 128 ReLU 93.5 88.7 95.2 97.5 68.2 96.0
4 10−4 2 256 ReLU 95.5 89.2 96.0 96.9 71.4 93.7
B. Temporal Analysis
In order to improve model performances, prediction results are analyzed during training following their temporal aspect using metrics presented in section II-C. An analysis of the
number of frames between F Pa and Fall labels, defined as
offset in Fig. 2, allows to better characterize false alarms.
Offset according to duration of FPa
Offset of FPa (frames)
Duration
of FP
a
(frames
) Offset according to duration of FPa 30 25 20 15 10 5 0 -120 -80 -40 0 40 Offset of FPa (frames) Duration of FP a (frames ) 40 35 30 25 20 15 10 5 0 -75 -50 -25 0 25 50 75
Fig. 2. Offset to the Fall class according to the duration of F Pa. The
horizontal zone (in green) includes F Paduration shorter than 10 frames.
The vertical zone (in red) includes F Paoffset smaller than 5 frames. URFD
on the left and FDD on the right.
In the three databases, 39% of F Pa are very close in time
to the actual fall with an offset smaller than 5 frames. These
predictions are labeled as false according to the ground-truth but are ambiguous. Indeed, they could be considered as the beginning or the end of the related fall from a human
perception. Secondly, 86% of F Paare shorter than 10 frames
and will be removed by the temporal filter application. Table III shows the evaluation results of the CNN output
predictions, with Tpred= 0.5, using the theoretical precision
metric p computed with stack predictions, the alarm precision
pa and the alarm sensitivity sea. Concerning all databases,
pa is significantly lower than p which is expected as the
temporal property is not taken into account yet. TABLE III
TEMPORAL EVALUATION OF THECNNOUTPUT PREDICTIONS WITH
Tpred= 0.5AND TRAINING CONFIGURATIONID 2 (IN%)
Database p pa sea
URFD 47.0 27.0 100
FDD 59.1 54.7 98.9
Multicam 63.6 25.5 89.0 Avg. 56.6 35.7 96.0
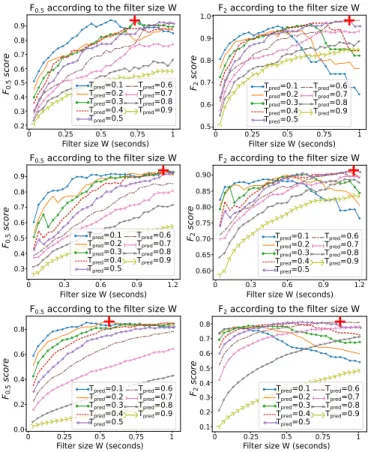
C. Filter size and prediction threshold adjustments
An empirical study, illustrated in Fig. 3, is made in order to propose the best association between the temporal filter
size W and the prediction threshold Tpred. Our use case
suggests to maximize the alarm precision pawhile stabilizing
the alarm sensitivity sea on the three considered databases.
F0.5 according to the filter size W
0.5 0.25 0.75 0.6 0.3 0.9 0.5 0.25 0.75 1.2
Filter size W (seconds)
Tpred=0.1 Tpred=0.2 Tpred=0.3 Tpred=0.4 Tpred=0.5 Tpred=0.6 Tpred=0.7 Tpred=0.8 Tpred=0.9 Tpred=0.1 Tpred=0.2 Tpred=0.3 Tpred=0.4 Tpred=0.5 Tpred=0.6 Tpred=0.7 Tpred=0.8 Tpred=0.9 Tpred=0.1 Tpred=0.2 Tpred=0.3 Tpred=0.4 Tpred=0.5 Tpred=0.6 Tpred=0.7 Tpred=0.8 Tpred=0.9 Tpred=0.1 Tpred=0.2 Tpred=0.3 Tpred=0.4 Tpred=0.5 Tpred=0.6 Tpred=0.7 Tpred=0.8 Tpred=0.9 Tpred=0.1 Tpred=0.2 Tpred=0.3 Tpred=0.4 Tpred=0.5 Tpred=0.6 Tpred=0.7 Tpred=0.8 Tpred=0.9 Tpred=0.1 Tpred=0.2 Tpred=0.3 Tpred=0.4 Tpred=0.5 Tpred=0.6 Tpred=0.7 Tpred=0.8 Tpred=0.9
F0.5 according to the filter size W
F0.5 according to the filter size W
F2 according to the filter size W
F2 according to the filter size W
F2 according to the filter size W
Filter size W (seconds)
Filter size W (seconds)
0.5 0.25 0.75 0.6 0.3 0.9 0.5 0.25 0.75 1.2
Filter size W (seconds)
Filter size W (seconds)
Filter size W (seconds)
0.9 0.8 0.7 0.6 0.5 0.4 0.3 0.2 0.9 0.8 0.7 0.6 0.5 0.4 0.3 0.8 0.6 0.4 0.2 0.0 1.0 0.9 0.8 0.7 0.6 0.5 0.90 0.85 0.80 0.75 0.70 0.65 0.60 0.8 0.7 0.6 0.5 0.4 0.3 0.2 0.1
Fig. 3. F0.5(at left) and F2(at right) according to filter size W in seconds.
Each graph plots curves for a Tpredranging from 0.1 to 0.9. Red crosses
annotate configurations reaching the maximal Fβ. From top to bottom,
F0.5 and F2 decrease as Tpred is getting larger due to
the rise of undetected falls. From a certain W value, F2
is reduced due to the same reason. For Multicam database, the number of undetected fall sequences is important and comes from the fact that it is a complex database with inaccuracies in labeling. The sequences are also much longer and more complex in terms of action. The objective is to drastically decrease the number of false alarms while limiting
the number of undetected falls. In our case, pa is fixed to be
more than 80% and sea must not vary more than 10% from
Table III. The optimal (W , Tpred) pair is found by averaging
(W , Tpred) pairs that maximize Fβ for each database.
In the end, W = 0.87 sec and Tpred= 0.4 are found to
be the best combination and lead to the results in Table IV.
Compared to Table III, the alarm precision pa increases
drastically from 35.7% to 88.4% with the optimal (W ,
Tpred). On the other hand, the alarm sensitivity seadecreases
from 96.0% to 86.2% per database in average. This means that the solution detects 86.2% of falls while 88.4% of the raised alarms are real falls. Considering the best camera (on which the fall is best visible) on Multicam database, the results of our solution are 7% higher in terms of alarm precision and 4% in terms of alarm sensitivity than in [19].
TABLE IV
FINAL RESULTS(IN%)WITH THE TUNED DECISION PROCESS: W = 0.87SEC ANDTpred= 0.4
Database F0.5 F2 pa sea T Pa F Pa F Na URFD 87.4 94.2 85.3 96.7 29 5 1 FDD 92.4 91.3 92.8 90.9 90 7 9 Multicam 83.3 73.7 87.1 71.0 142 21 58 Avg. 87.7 86.4 88.4 86.2 - - -Multicam1 89.1 91.3 88.5 92.0 23 3 2 Multicam2 82.7 86.6 81.5 88.0 22 5 3
1Our method on the best camera 2Method of [19] on the best camera
IV. CONCLUSION
In this study, we brought a new perspective on fall detec-tion soludetec-tions focused on the applicadetec-tion in nursing homes. This vision has led to a new CNN training strategy driven by a realistic alarm rate metric and a decision-making process that fits medical staff expectations. The presented solution has proven to detect 86.2% of falls while producing only 11.6% of false alarms in average on the considered databases. The analysis of false alarms has shown that in most cases they occur when the person sits down heavily, stands up after a fall or gets down to pick up something on the ground.
Our future works on that topic include the implementation of a spatial filter such as semantic background segmentation and an increase of the number and diversity of data in order to enhance the results. The system has been tuned and tested on fall videos simulated by performers, hence the next step would be to conduct a clinical study. Another opportunity would be to leverage on multiple cameras data fusion as in Multicam database within results analysis shows that a fall is always detected by at least one camera over all.
ACKNOWLEDGMENT
This work was founded by the European Union, the Britanny region in France and the French city of Rennes through the AAP FEDER - SilverConnect project.
The authors thank the ”Pole Saint-Helier” which con-ducted the study in three different specialized homes for the elderly in the metropolitan area of Rennes, France.
REFERENCES
[1] Juliette Podvin-Deleplanque, Daniel Dreuil, Dominique Huvent, and Franois Puisieux, “Fall Prevention in Nursing Homes,” La Revue de Griatrie, p. 8, 2015, (Prvention des chutes en EHPAD).
[2] Jane Fleming and Carol Brayne, “Inability to get up after falling, subsequent time on floor, and summoning help: prospective cohort study in people over 90,” BMJ, vol. 337, pp. a2227, Nov. 2008. [3] Bastien Fraudet, Emilie Leblong, Marie Dandois, Estelle Ceze, and
Berenice Rocabado, “SILVER CONNECT project: Requirements gathering and acceptability,” Technical Report, Living lab ISAR, Ple Saint Hlier, May 2020.
[4] Wen-Nung Lie, Anh Tu Le, and Guan-Han Lin, “Human fall-down event detection based on 2D skeletons and deep learning approach,” in 2018 International Workshop on Advanced Image Technology (IWAIT), Chiang Mai, Jan. 2018, pp. 1–4, IEEE.
[5] Glen Debard, Greet Baldewijns, Toon Goedeme, Tinne Tuytelaars, and Bart Vanrumste, “Camera-based fall detection using a particle filter,” in 2015 37th Annual International Conference of the IEEE Engineering in Medicine and Biology Society (EMBC), Milan, Aug. 2015, pp. 6947–6950, IEEE.
[6] Caroline Rougier, Jean Meunier, Alain St-Arnaud, and Jacqueline Rousseau, “Robust Video Surveillance for Fall Detection Based on Human Shape Deformation,” Circuits and Systems for Video Technology, IEEE Transactions on, vol. 21, pp. 611–622, June 2011. [7] Imen Charfi, Johel Miteran, Julien Dubois, Mohamed Atri, and Rached Tourki, “Definition And Performance Evaluation Of A Robust SVM Based Fall Detection Solution,” Nov. 2012.
[8] Nabil Zerrouki, Fouzi Harrou, Amrane Houacine, and Ying Sun, “Fall detection using supervised machine learning algorithms: A comparative study,” Nov. 2016, pp. 665–670.
[9] Mirto Musci, Daniele De Martini, Nicola Blago, Tullio Facchinetti, and Marco Piastra, “Online Fall Detection using Recurrent Neural Networks,” Apr. 2018.
[10] Shengchao Li, Hao Xiong, and Xiumin Diao, “Pre-Impact Fall Detection Using 3D Convolutional Neural Network,” in 2019 IEEE 16th International Conference on Rehabilitation Robotics (ICORR), June 2019, pp. 1173–1178.
[11] Markus D. Solbach and John K. Tsotsos, “Vision-Based Fallen Person Detection for the Elderly,” in 2017 IEEE International Conference on Computer Vision Workshops (ICCVW), Oct. 2017, pp. 1433–1442. [12] Adrian Nunez-Marcos, Gorka Azkune, and Ignacio Arganda-Carreras,
“Vision-Based Fall Detection with Convolutional Neural Networks,” Wireless Communications and Mobile Computing, vol. 2017, 2017. [13] Javier Sanchez, Enric Meinhardt-Llopis, and Gabriele Facciolo,
“TV-L1 optical flow estimation,” Image Processing On Line, vol. 3, pp. 137–150, July 2013.
[14] Limin Wang, Yuanjun Xiong, Zhe Wang, and Yu Qiao, “Towards Good Practices for Very Deep Two-Stream ConvNets,” July 2015. [15] Bogdan Kwolek and Michal Kepski, “Human fall detection on
embedded platform using depth maps and wireless accelerometer,” Computer Methods and Programs in Biomedicine, vol. 117, no. 3, pp. 489–501, Dec. 2014.
[16] “Fall detection Dataset - Le2i - Laboratoire Electronique, Informatique et Image,” FDD dataset.
[17] Edouard Auvinet, Caroline Rougier, Jean Meunier, Alain St-Arnaud, and Jacqueline Rousseau, “Multiple cameras fall data set,” p. 24, Multicam dataset.
[18] Payam Refaeilzadeh, Lei Tang, and Huan Liu, “Cross-Validation,” Encyclopedia of Database Systems, Jan. 2009.
[19] Glen Debard, Marc Mertens, Mieke Deschodt, Ellen Vlaeyen, Els Devriendt, Eddy Dejaeger, Koen Milisen, Jos Tournoy, Tom Croo-nenborghs, Toon Goedem, Tinne Tuytelaars, and Bart Vanrumste, “Camera-based fall detection using real-world versus simulated data: How far are we from the solution?,” Journal of Ambient Intelligence and Smart Environments, vol. 8, no. 2, pp. 149–168, Mar. 2016.