HAL Id: hal-01302708
https://hal-mines-paristech.archives-ouvertes.fr/hal-01302708
Submitted on 14 Apr 2016
HAL is a multi-disciplinary open access archive for the deposit and dissemination of sci-entific research documents, whether they are pub-lished or not. The documents may come from teaching and research institutions in France or abroad, or from public or private research centers.
L’archive ouverte pluridisciplinaire HAL, est destinée au dépôt et à la diffusion de documents scientifiques de niveau recherche, publiés ou non, émanant des établissements d’enseignement et de recherche français ou étrangers, des laboratoires publics ou privés.
Distributed under a Creative Commons Attribution - NonCommercial - NoDerivatives| 4.0 International License
Impact of a 70°C temperature on an ordinary Portland
cement paste/claystone interface: An in situ experiment
Philippines Lalan, Alexandre Dauzères, Laurent de Windt, Danièle Bartier,
Juuso Sammaljärvi, Jean-Dominique Barnichon, Isabelle Techer, Valéry
Detilleux
To cite this version:
Philippines Lalan, Alexandre Dauzères, Laurent de Windt, Danièle Bartier, Juuso Sammaljärvi, et al.. Impact of a 70°C temperature on an ordinary Portland cement paste/claystone inter-face: An in situ experiment. Cement and Concrete Research, Elsevier, 2016, 83 (164–178), �10.1016/j.cemconres.2016.02.001�. �hal-01302708�
1
Impact of a 70°C temperature on an Ordinary Portland Cement paste /
claystone interface: an in situ experiment
Philippines Lalan a, b *, Alexandre Dauzères a, Laurent De Windt b, Danièle Bartier c, Juuso Sammaljärvi d,
Jean-Dominique Barnichon a, Isabelle Techer eand Valéry Detilleux f
a Institute of Radiation Protection and Nuclear Safety (IRSN)/PRP-DGE/SRTG/LETIS, BP 17, 92262 Fontenay-aux-Roses cedex, France
bMINES ParisTech, PSL Research University, Centre de Géosciences, 35 Rue St-Honoré, 77300
Fontainebleau, France
c CNRS UMR 7566, Université de Lorraine, BP 70239, 54506 Vandœuvre-lès-Nancy, France
d Laboratory of Radiochemistry HYRL, Department of Chemistry, PO Box 55, 00014 University of Helsinki, Finland
e Univ. Nimes, EA 7352 CHROME, rue du Dr Georges Salan, 30021 Nîmes, France
f Bel V, 148 Rue Walcourt, 1070 Anderlecht, Belgium
*Corresponding author: Tel.: +33 1 58 35 74 76; E-mail address: philippines.lalan@irsn.fr Other e-mail addresses: alexandre.dauzeres@irsn.fr
,
laurent.de_windt@mines-paristech.fr,
daniele.bartier@univ-lorraine.fr
,
juuso.sammaljarvi@helsinki.fi, jean-dominique.barnichon@irsn.fr,
isabelle.techer@unimes.fr, valery.detilleux@belv.be
Abstract:
Radioactive wastes in future underground disposal sites will induce a temperature increase at the interface between the cementitious materials and the host rock. To understand the evolution of Portland cement in this environment, an in situ specific device was developed in the Underground Research Laboratory in Tournemire (France). OPC cement paste was put into contact with clayey rock under water-saturated conditions at 70°C. The initial temperature increase led to ettringite dissolution and siliceous katoite precipitation, without monosulfoaluminate formation. After one year of interaction, partial decalcification and diffuse carbonation (calcite precipitation) was observed over 800 μm in the cement paste. At the interface, a layer constituted of phillipsite (zeolite), tobermorite (well-crystallised C-S-H), and C-(A)-S-H had formed. Globally, porosity decreased at both sides of the interface. Geochemical modelling supports the experimental results, especially the coexistence of tobermorite and phillipsite at 70°C, minerals never observed before in concrete/clay interface experiments.
Keywords: degradation, temperature, microstructure, cement paste, waste management
1. Introduction
The disposal of high-level and long-lived radioactive wastes within deep and stable geological formations is an option for many nuclear energy countries. Schematically, such disposal is a multi-barrier system in which waste packages (glass, concrete…), facility components (concrete, metal liner, bentonite…) and the host rock itself (claystone, granite, salt rock) contribute all together to the term containment of
long-2
lived radionuclides. Although the global design of the system varies among countries, it always involves the construction of underground excavations such as boreholes, galleries and shafts.
In France, the decision has been taken to design a radioactive waste disposal facility in a natural clayey environment with favourable radionuclide containment properties. This solution is also being considered in Belgium and Switzerland by the waste management organisations. However, for stability reasons during the excavation work and for facilitating the installation of radwastes, galleries excavated in clayey rocks must generally be mechanically supported, due to their low mechanical strength (as opposed to other host rock types such as granite), by concrete components. The contact between the clayey rock and the concrete inevitably leads to an alkaline plume spreading from the concrete toward the host rock, while a multi ionic attack occurs from the clayey pore water against the cementitious material side. As the alkaline plume may impact the swelling and low permeability properties of clayey materials it has to be evaluated and understood. An extensive body of literature exists on the chemical behaviour of clayey materials exposed to alkaline condition at temperatures ranging from ambient to 200°C. Laboratory experiments in which pure clay phases (smectite [e.g. 1, 2, 3] or kaolinite and smectite [e.g. 1]) or claystone [4-9] were exposed to an alkaline fluid showed mainly a clay mineral transformation and formation of Calcium Silicate Hydrates (C-S-H) and, at temperatures higher than 80°C, also zeolites [e.g. 2, 5, 8, 9]. If the medium contained calcium, calcite precipitation was also described [e.g. 10].
Two types of cementitious binders are considered today for the design of deep disposal facilities: an ordinary Portland cement binder and a low-pH binder. The latter was formulated to induce a less aggressive alkaline plume mainly due to a lower pore water pH. Over the last decades, interest has grown about the geochemical behaviour of cementitious materials in a clayey environment. Studies have focused mainly on the physico-chemical evolution of clay under alkaline conditions and not on the material interface. Only a handful of studies have discussed the interactions at the interface between cement binder and claystone. Such interfaces have been created at ambient temperature by pouring cement mixes into boreholes [11-13] or by putting disks of material into contact in transport cells [14]. In the current design of the French radioactive waste deep disposal facility [15], the thermal transient, due to the presence of heat-emitting waste, is expected to entail a temperature increase of up to 70°C in the concrete plugs located in the high-level waste cells and potentially also in the intermediate long-lived waste cells. Based on the existing literature, only a few laboratory studies have focused on the impact of such a temperature level on the evolution of the interface between natural rock and anthropic material [16-20], and even fewer in situ studies have been carried out. Indeed, only two studies have focused on interfaces at relatively high temperatures: one on an iron-argillite interface [19] and one on an OPC paste-clay interface [20].
The CEMTEX project (CEMent Temperature EXperiment) aims to fill the lack of knowledge about the geochemical and micro-structural evolutions of these interfaces under representative thermo-hydraulic conditions (i.e. 70°C and full water saturation), which should provide input for future studies on the durability of cementitious materials. Within this framework, three in situ experiments have been set up in IRSN’s underground research laboratory in Tournemire (France). This paper presents the results of one of the three experiments. Each of the experiments includes a specifically developed heating device, which is described in the first part of this paper. In the second part of the paper, the chemical and mineralogical evolutions of an ordinary Portland cement paste/argillite interface after one year of situ interaction are discussed. In the third part, the consequences of the geochemical evolution on the material microstructures are studied. Throughout this paper, the discussion is supported by thermal and geochemical modelling studies.
3
2. Materials and methods2.1. Materials
2.1.1. In situ clayey rock
Tournemire argillite (claystone) is a 250 metres thick subhorizontal Domerian-Toarcian clayey sequence. The experiment took place in Niche 2008 of the IRSN underground research laboratory in Tournemire (Aveyron, France).
As much as two-thirds of the argillite is composed of clay minerals (mainly illite/smectite mixed-layer, illite, kaolinite and chlorite), followed by, in order of importance, quartz, calcite, feldspars, pyrite and dolomite. The mean features of the pore water chemistry at ambient temperature are summarised in Table 1 [21]. The mean porosity and effective diffusion coefficient of the argillite are 10% and 2×10-11
m2/s (at 20°C), respectively.
Table 1.
Mean features of Tournemire argillite at 20°C.
Argillite illite illite/smec tite mixed-‐ layer
kaolini
te chlorite quartz calcite feldspars pyrite dolomite Mineralogical content
(wt%) 14 34 11 4 18 12 3 2 2
Argillite pore water Na K Ca Cl HCO3 SO4 H4SiO4 Al pH
Total concentration (mmol.L-‐1)
22.5 0.75 1.5 4.5 4.5 9.5 0.1 < DL 7.8
2.1.2. OPC cement paste
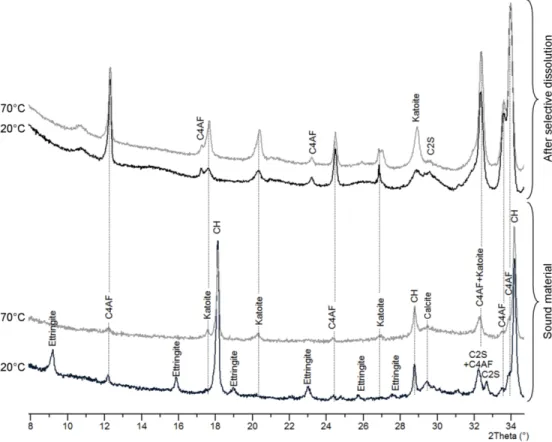
An Ordinary Portland Cement, Sulphate Resisting Portland Cement (OPC-SRPC) from Val d’Azergues (France, Lafarge®) was used. Lafarge provided the cement's composition (Table 2). The cement was hydrated at a water / cement mass ratio of 0.42. Cement paste samples were poured from the mix used for the experiment in order to characterise the initial sound material. XRD analysis of a cement paste cured for 5 months showed presence of cement hydration products, portlandite, C-S-H, Si-katoite (C3ASH4) and
ettringite, as well as calcite (cement filler) and anhydrous cement phases (Fig. 1). Katoite is part of a solid series between two endmembers, grossular (Ca3Al2Si3O12) and synthetic phase (Ca3Al2(OH)12), also known
as hydrogarnet. In this paper, the term katoite is used for Si-katoite (C3ASH4). Selective dissolution was
used to get rid of the major phases of the cement paste with the view to enrich the residue in the minor phases. Alite, belite, portlandite, C-S-H, AFt and AFm are dissolved by the combined action of methanol and salicylic acid leaving potential brownmillerite, katoite and hydrotalcite [22]. XRD in spinner mode was then performed on the resulting powder. At ambient temperature, in the sound cement paste, the presence of katoite and brownmillerite was confirmed (Fig. 1). Thermogravimetric analyses showed 3.1 mmol of portlandite per gram of OPC paste and 0.5 mmol of carbonate per gram of OPC. The connected total porosity measured on hardened OPC paste by water method was about 35% (±1) and by PMMA method (cf. 2.3.6) about 30% (±3). The difference between these two values can be easily explained: the MMA molecule cannot penetrate into the C-S-H interlayer space, entailing an underestimate of the total porosity of a cementitious material.
4
Table 2.
Cement composition (CEM I 52.5 N – Lafarge).
Chemical analysis (g/100g) Mineralogical analysis (g/100g) CaO 64.6 Clinker including Alite (C3S) Belite (C2S) Aluminate (C3A) Ferrite (C4AF) 93.2 65.3 13.5 0.9 13.5 SiO2 20.7 Al2O3 3.2 Fe2O3 4.5 CaO (free) 1.8 MgO 0.6 Gypsum 3.9 K2O 0.6 Filler 2.9 Na2O 0.1 Water w/c = 0.42 (mass) CO2 1.1 SO3 2.8
Fig. 1. XRD diagrams of the sound OPC paste at 20 and 70°C before and after selective dissolution. Selective dissolution facilitates detection of minor phases such as katoite.
5
2.1.3. Hyperalkaline solution
A hyperalkaline solution was prepared from salts in laboratory (NaOH: 1.9995 g/L; KOH:19.6350 g/L) and diluted into deionised water (18.2 MΩ.cm at 25°C). The pH value was about 13.2 at 20°C.
2.1.4. Characteristics of the heating system
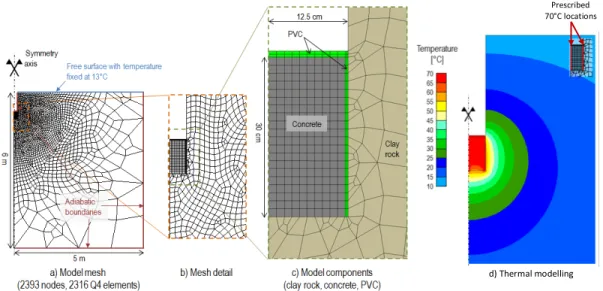
A study prerequisite was to achieve a temperature of 70°C for a long time around an interface between a clayey rock and a cementitious material. A numerical scoping simulation was carried out to design the heating device. The considered option (called the “coil heating device”) was a cylinder in contact with the borehole wall and a rod located in its centre for simulating a heating coil with a cement paste poured in between. Simplified 2D axi-symmetric models of the design were simulated with the Lagamine Thermo-Hydro-Mechanical finite element code [23] (Fig. 2.), using a geometry extending up to 5 m radially and 5 m vertically. The heat transfer was considered to be driven only by thermal conduction. The relevant inner nodes were prescribed at 70°C (Fig. 2-d), all other nodes being initially at 13°C. Finally, the heat diffusion was computed from the initial state and over a one-year period.
The coil heating device model led to temperatures of approximately 70°C at the interface (close to the coil) and about 60°C in the centre. Based on this result, the coil heating device design seemed to be a good option to prescribe temperature at the interface between both materials.
The selected heating design (coil device) was optimised to resist the in situ conditions and duration (up to 5 years) of the test: the inner and outer sides of the coil tubing were, respectively, in contact with water at around 70°C and a hyperalkaline environment. The choice of the coil material was therefore a critical issue. Aluminium and copper have high thermal conductivity, but they are very sensitive to hyperalkaline pH, whereas stainless steel resists to alkaline medium but is a poor thermal conductor. The compromise was to coat the copper coil with nickel, using electrochemical plating. A 10 µm thick nickel plating was deposited on the coil surface. Each spin of the coil was butt-jointed to its neighbours to form a pseudo cylinder of 18 cm. After installation, the coil was connected to an electric boiler providing hot water.
Fig. 2. Thermal modelling features: geometry, mesh and boundary conditions (a-b) and materials (c). Temperature field simulation (close-up view) after 1 year of heating at 70°C for the coil heating device (d)
Prescribed 70°C locations
6
2.2. Protocols
2.2.1. Setting up protocol
Three downward vertical boreholes of 1 m depth and 25 cm of diameter were drilled into the argillite in the Tournemire tunnel. This depth was chosen to ensure that the devices were located out of the excavation disturbed zone (EDZ) created while the gallery was dug. The bottom of each borehole was polished with a specific tool and all the dust was carefully vacuum cleaned to obtain an as perfect as possible contact surface between the rock and the cementitious material. Three cups filled with water and humidity probes were placed into the borehole, which was then tightly closed to resaturate the rock by vapour phase. The rock was considered saturated when the measured relative humidity within the borehole reached a value of 99.5%. In each borehole, the relative humidity reached 97.5% and 99.5% after 7 and 45 days, respectively. To force a one-dimensional mass transport (vertical) across the interface and to protect the borehole sides from hyperalkaline solution, a PVC tube (25 cm outer diameter, 0.5 cm thick, 125 cm height) was placed within the borehole. A rubber seal was placed at the bottom of the PVC tubing to seal the bottom of the tube from the borehole wall.
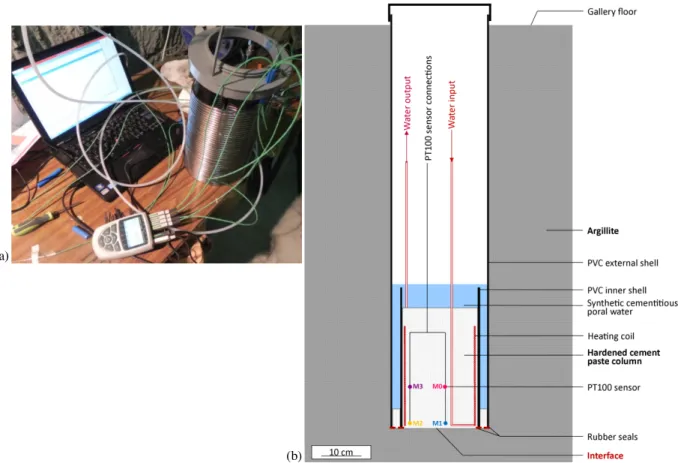
At the same time, heater devices were built outside the boreholes (Fig. 3-a). Four temperature sensors (PT 100) were attached to a single support in order to monitor the temperature during the experiment. Two sensors were close to the centre of the coil, one at 1 cm height from the future interface (M1) and the other at 20 cm (M0). The two other sensors were placed just inside the coil, again at 1 cm (M2) and 20 cm (M3). The coil top and the temperature sensor support were fixed to a PVC shell of 20 cm diameter. A rubber seal provided sealing between the argillite borehole bottom and this latter PVC shell. After the argillite saturation, the entire device was placed into the borehole and then connected to a boiler via 6 mm diameter PFA pipes (perfluoroalkoxy) and to the temperature acquisition system (ALMEMO). Once all these steps had been achieved, the cement paste was poured onto the heater device and the temperature sensors to fill the full inner PVC volume constituting a 30 cm height OPC paste plug. A small amount of cement paste was also poured between the two PVC shells over a few centimetres. The experiment covered by this study was scheduled to last for 1 year.
One month after the beginning of the cement hydration, heating was started while the device was being maintained under the hyperalkaline solution in order to ensure water saturation throughout the test. The hyperalkaline solution level was frequently checked and solution was added whenever the level decreased. Above the cement paste block, bubble wrap and a polystyrene cap were placed, to try to prevent water and heat losses. The system was closed at the top by a tight PVC cover. A schematic view of the experimental system is displayed in Figure 3-b.
7
Fig. 3. View of the heating coil device connected to the temperature monitoring system (a) and outline of the CEMTEX in situ device (b).
2.2.2. Dismantling protocol
The main concern during the dismantling of the experiment was to protect the rock / cement paste interface throughout the process. In order to lift up the sample, a specific extractor was designed to take advantage of the almost horizontal layering and induce its rupture along this orientation at about 20 centimetres below the rock / cement paste interface, thus enabled sampling of both sides of the interface. The following actions were taken: (i) Once the heating system had been stopped and the alkaline water pumped out from the top of the cement paste column, a 40 cm diameter overcoring was initiated over 60 cm depth. (ii) The hot water circuit and the temperature sensor connectors were cut and three boreholes of 76 mm diameter and 1.55 m depth were drilled at the periphery of the 40 cm diameter overcoring, with the aim of later inserting the extractors. (iii) The external PVC shell and the argillite ring (40 cm external diameter, 25 cm inner diameter) were cut at 60 cm depth and removed, two stainless threaded steel rods were screwed into the argillite within the 40 cm overcore and epoxy resin was poured over the cement paste column to strengthen the entire system. (iv) After resin polymerisation, 24h later, the extractors were inserted into the peripheral boreholes. A hammer blow was put on the top of the extractor metal rod to free the sample from the rock. A metal support plate was inserted and fixed with nuts to the two stainless threaded steel rods in order to lift the sample out of the borehole using a chain hoist. Immediately, the sample (40 cm diameter and 65 cm height) was packaged in insulating paper to keep it safe from the atmosphere. Successive cuttings were performed first by a circular saw of wide diameter and later by a diamond wire saw to obtain samples (a few centimetres in size) of the interface.
(a)
8
2.3. Analytical procedures
2.3.1. Scanning electron microscopy (SEM)
For microphotography, small samples of 1 cm3 were cut using a diamond wire saw. Both materials were
separated at the level of the interface. Before coating the surface of interest with a thin layer (10-15 nm) of a mix of gold and palladium, the samples were freeze-dried for one week. Secondary Electron (SE) observations were carried out by Scanning Electron Microscopy (SEM, Hitachi S3500N - IRSN, Fontenay-aux-Roses, France) to obtain morphological information on the minerals.
Chemical observations were performed on a thin polished section centred on the interface and coated with carbon. Characterisations were carried out with an energy-dispersive spectrometry (EDS) system adapted on the SEM and composed of two EDS - Brücker SDD detectors working under a voltage of 15 keV at a working distance of 16 mm.
2.3.2. X-ray diffraction (XRD)
Mineralogical data were collected using a PANalytical X'Pert diffractometer with an X'Celerator detector (IMPMC, Paris VI University, France) relying on CuKα radiation (λ=1.5405 Å). XRD calibration was performed on a silicon standard. The working voltage and intensity were equal to 40 kV and 40 mA, respectively. The clay sample was scanned between 4° and 65° and the cement sample between 5° and 60° with a step size of 0.02° and a time per step of 0.50 seconds. XRD analyses were performed directly on the solid [24, 25]. Between each measurement, the surface was abraded with 350-grain abrasive paper (silicon carbide) over a depth of approximately 10 µm and the new surface was analysed. The depth of abrasion was checked with a thickness comparator. The phase characterisation was performed using EVA software and the database of the International Centre for Diffraction Data (ICDD). Mineral profiles were obtained by measuring, on each diagram, the main peak intensity of the mineral pattern from which the background value was subtracted.
2.3.3. Thermogravimetric analyses (TGA)
Thermogravimetric analyses (TGA) were carried out on a Mettler Toledo TGA/DSC 1 (GeoRessources, Université de Lorraine, France) under a nitrogen flow of 100 mL/min. The analyses were performed in an alumina crucible on 10 mg of powdered sample obtained by successive abrasions with a step of about 90 µm in order to build a profile from the interface to the sound zone. The heating protocol was composed of 15 minutes at 25°C to stabilise the sample and then by successive steps of 10°C each minute to 900°C. Derivative thermogravimetry (DTG) was performed using STARe Evaluation software to quantify the amount of portlandite from the water loss around 450°C and the amount of carbonates from CO2 loss
between 550°C and 800°Cwithin the sound and the altered cement paste.
2.3.4. Transmission electron microscopy (TEM)
Transmission Electron Microscope (TEM) analyses were carried out with a Philips CM200 TEM fitted out with an Si-Li detector, operating at 200 kV (Institut Jean Lamour, Université de Lorraine, France) and semi-quantitative chemical analyses were performed by EDS. Once powdered samples had been emulsified in ethanol by ultrasonication, they were placed on carbon film placed on a 200 mesh copper grid for evaporation before analysis. Particular attention was paid to sample preparation in order to limit as much as possible phase mixture.
9
2.3.5. X-ray micro-tomography
X-rays were obtained by using a Phoenix Nanotom S (GeoRessources, Université de Lorraine, France) computed tomography scanner to determine the cement paste macro-porosity variations within the altered zone. Samples of about 1.5x1.5x10 mm were cut at the interface at the cement paste side using a diamond wire saw. No impregnation was needed. Scans were performed at 90 keV and 125 mA with a voxel size of 0.8 µm in order to optimise the contrasts between the different mineral phases and the porosity. Once the sample reconstitution had been performed, the porosity profile was obtained by using the ImageJ software. After cropping the reconstructed image side to avoid side effects, a grey level threshold was applied to discriminate the porosity from the mineral phases. The porosity was then measured in surface percentage of the obtained binary images.
2.3.6. 14C-PMMA autoradiography
14C-PMMA autoradiography is based on measuring the radiation induced by radioactive elements within a
sample. In this study, the radiation in question was the beta radiation coming from the 14C-labelled tracer
compound 14C-MMA (MethylMethAcrylate). The sample was impregnated with 14C-MMA, which was
allowed to enter into the sample pore space, until the connected porosity was filled with the 14C-MMA
compound [e.g. 13, 26].To reach this aim, samples of a few cm were freeze-dried for two days and then impregnated under half of the atmospheric pressure with 14C-labelled MMA. The impregnation time was 1
month. Polymerisation into PMMA (PolyMethylMethAcrylate) was initiated by gamma irradiation from a
60Co source. After cutting and polishing, the thick sections were exposed on a photographic film (AG
film) sensitive to β-radiation. A linear relationship exists between the local blackening of the film and the local activity of the resin. Using standards of known activity, the local porosity in each pixel of the digitalised autoradiographs can then be calculated [26, 27]. These analyses were performed in the laboratory of radiochemistry of Helsinki University (Finland).
Because of its small size (1.2 nm3) and low viscosity, the MMA molecule can penetrate by pure diffusion
into macropores, micropores and also in inter C-S-H pores, as well as in the interlayer space of clay minerals [28, 29]. Therefore, almost all the connected porosity can be filled by MMA. Moreover the linear link between the amount of the local activity of the resin and the local blackening of the film allows estimating the connected porosity quantitatively.
2.4. Geochemical modelling and thermodynamic data
2.4.1. Thermodynamic equilibrium calculations
In a first step, the geochemical code CHESS [30] was used to simulate the temperature effect on the initial pore water chemistry and solid phases of the hydrated cement paste during a temperature increase from 20°C to 70°C. Acid/base and ion complexation reactions in solution, as well as dissolution/precipitation of the cement hydrates, were calculated at thermodynamic equilibrium. The empirical formula of the truncated Davies model, derived from the Debye-Hückel model of activity corrections of dissolved ions, was used for activity corrections. The model is applicable up to the ionic strengths of the fresh hydrated cement pore waters calculated in the present study (I = 0.4 mol/kg) and is temperature-dependent.
In a second step, the simplified thermodynamic stability and the phase diagrams were calculated with CHESS, under chemical and temperature conditions representative of the in situ test, to better understand the phenomena induced by the temperature increase and the mineralogical evolutions at the cement paste/claystone interface after one year of interaction.
10
2.4.2. Thermodynamic dataset
The Thermoddem database [31] was preferred over other thermodynamic databases, such as CEMDATA, due to its ability for merging cement, clay and zeolite phases, on the one hand, and its validity over the temperature range of interest for this study [0 – 70°C], on the other hand. The solid phases (and their thermodynamic formation constants) considered in geochemical modelling and stability phase diagrams are reported in Table 3. The C-S-H was discretised into three C-S-H of decreasing Ca/Si ratio: 1.6, 1.2 and 0.8. In a first approximation, as a surrogate, the thermodynamic data of strätlingite was applied to simulate Al uptake by C-S-H phases, i.e. a modelling proxy for calcium alumino-silicate hydrates (C-A-S-H) [32].
11
Table 3.
Thermodynamic formation constants (mass balance equilibrium) of the solid phases considered in geochemical modelling and stability phase diagrams.
Solid phase Reaction of formation
25°C Log K 60°C 100°C Cement hydrates C-S-H 0.8 0.8Ca2+ + H
4SiO4 + 0.34 H2O → Ca0.8SiO32.8(OH)0.6:1.24H2O + 1.6H+
-11.050 -10.196 -9.461 C-S-H 1.2 1.2Ca2+ + H
4SiO4 + 1.26H2O → Ca1.2SiO3.2(OH)1.08:1.52H2O + 2.4H+
-19.301 -17.704 -16.312 C-S-H 1.6 1.6Ca2+ + H
4SiO4 + 2.18H2O → Ca1.6SiO3.6(OH)1.54:1.81H2O + 3.2H+
-28.002 -25.592 -23.475 Ettringite
2Al3+ + 6Ca2+ + 3SO
42- + 38H2O → Ca6Al2(SO4)3(OH)12·26H2O + 12H+ -57.009 -49.893 -43.158
Monocarboaluminate 2Al3+ + 4Ca2+ + 1HCO
3- + 16.7 H2O → Ca4Al2(CO3)(OH)12·5H2O+ 13H+ -80.567 -70.851 -62.072 Katoite 3Ca2+ + 2Al3+ + H
4SiO4 + 8H2O → Ca3Al2(SiO4)(OH)8 + 12H+
-71.168 -61.149 -52.044 Monosulfoaluminate 2Al3+ + 4Ca2+ + SO 42- +18 H2O → Ca4Al2(CO3)(OH)12·6H2O + 12 H+ -73.088 -63.108 -53.875 Portlandite Ca2+ + 2H 2O → Ca(OH)2 + 2H+ -22.812 -20.429 -18.271 Strätlingite 2Al3+ + 2Ca2+ + H
4SiO4 + 10.5H20 → Ca2Al2SiO2(OH)10·2.5H2O + 10H+ -49.671 -42.213 -35.517 Tobermorite-14Å 5Ca2+ + 6H 4SiO4 + 3.5H2O → Ca5Si6(OH)O16.5·10H2O + 10H+ -62.944 -57.410 -52.601 Zeolites
Analcime 0.99Al3+ + 0.99Na+ + 2.01H
4SiO4 → Na0.99Al0.99Si2.01O6·H2O + 3.96H+ + 1.04H2O -6.643 -4.769 -3.088 Clinoptilolite-Ca 1.1 Al3+ + 0.55Ca2+ + 4.9H 4SiO4 → Ca0.55(Si4.9Al1.1)O12·3.9H2O + 4.4H+ + 3.7H2O 2.112 3.362 4.437 Clinoptilolite-K 1.1 Al3+ + 1.1K+ + 4.9H 4SiO4 → K1.1(Si4.9Al1.1)O12·2.7H2O + 4.4H+ + 4.9H2O 1.169 2.257 3.204 Clinoptilolite-Na 1.1 Al3+ + 1.1Na+ + 4.9H 4SiO4 → Na1.1(Si4.9Al1.1)O12·3.5H2O + 4.4H+ + 4.1H2O 0.139 1.235 2.138 Heulandite-Ca 2.14 Al3+ + 1.07Ca2+ + 6.86H 4SiO4 → Ca1.07Al2.14Si6.86O18·6.17H2O + 8.56H+ + 3.27H2O -2.457 0.348 2.834 Heulandite-Na 2.14 Al3+ + 2.14Na+ + 6.86H 4SiO4 → Ca2.14Al2.14Si6.86O18·6.17H2O + 8.56H+ + 3.27H2O -2.797 -0.257 1.902 Phillipsite-Ca Al3+ + 0.5Ca2+ + 3H 4SiO4 → Ca0.5AlSi3O8·3H2O + 4H+ + H2O -2.319 -0.806 0.527
12
Solid phase Reaction of formation
25°C Log K 60°C 100°C Phillipsite-K Al3+ + K+ + 3H 4SiO4 → KAlSi3O8·3H2O + 4H+ + H2O -0.039 0.794 1.510 Phillipsite-Na Al3+ + Na+ + 3H 4SiO4 → NaAlSi3O8·3H2O + 4H+ + H2O -1.449 -0.297 0.672 Other phases Anhydrite Ca2+ +SO 42- → CaSO4 4.436 4.877 5.497 Calcite Ca2+ + HCO 3- → CaCO3 + H+ -1.847 -1.333 -0.786 Gibbsite Al3+ +3H 2O → Al(OH)3 +3H+ -7.738 -5.851 -4.132 Gypsum Ca2+ +SO 42- +2H2O → CaSO4·2H2O 4.605 4.714 4.986 Kaolinite 2Al3+ + 2H 4SiO4 + H2O → Al2Si2O5(OH)4 + 6H+ -6.472 -3.351 -0.493
3. Results and discussion on the effect of temperature increase on the stability of OPC hydrated phases
3.1. Modelling of the OPC paste mineral assemblage and pore water at 20°C and 70°C
A first concern was the effect of a temperature increase from ambient temperature to 70°C on a sound cement paste cured at ambient temperature. According to the hydration modelling of an SRPC of a close w/c ratio (w/c = 0.4), 10% of the anhydrous species of the cement remained not hydrated after 5 months [33]. Nevertheless, as transport modelling was not an objective, we only considered the hydrated species for the modelling of stability diagrams. From cement phase hydration reactions, we calculated for one litre of cement paste the amount of each element released into the system. The calcite amount was fixed equal to the amount of calcareous fillers in the OPC. These amounts were used to calculate the mineral assemblage of the cement paste and its pore solution at 20°C (Table 4). The modelling of an increase of temperature up to 70°C and its consequences on the mineralogy and the pore solution was performed using CHESS (Table 4). One of the more noteworthy changes was the pH value evolution from 13.6 to 11.9. This evolution is a consequence of the increase of the water dissociation constant (Kw) with
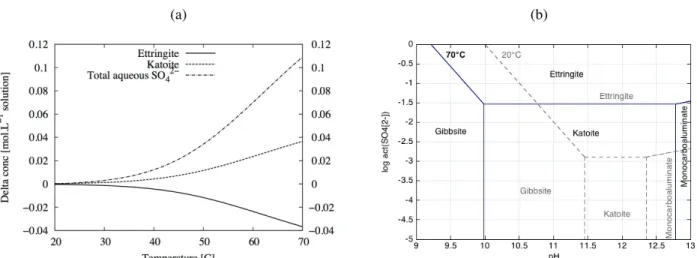
temperature and not of a chemical transformation. As shown in Table 4 and Fig. 4-a, a partial transformation of ettringite into katoite when the temperature increased from 20°C to 70°C was noticed, leading to a two orders of magnitude increase of the sulphate concentration in the pore solution. It is worth mentioning that the absolute mass of ettringite that dissolves is independent of the initial amount of ettringite. The dissolution corresponds only to a re-arrangement of the katoite/ettringite equilibrium with temperature. The increase of the aqueous sulphate concentration becomes really significant above 40°C (Fig. 4-a).
13
Table 4.
Calculated mineral assemblage of the OPC paste (Val d’Azergues) at 20°C and after a temperature increase up to 70°C.
Mineral Concentration (mol.L-1 of material) Aqueous species Total concentration (mmol.L-1) 20°C 70°C 20°C 70°C Portlandite 6.3 6.5 Ca2+ 0.81 1.9 Ettringite 0.13 0.12 SO42- 1.1 110 Katoite 0.68* 0.69 Al3+ 0.20 0.18 C-S-H(1.6) 4.4 4.4 H4SiO4 0.049 0.20 HCO3- 0.16 0.13 Calcite 0.39 0.39 K + Na+ 350 50 350 50 pH 13.6 11.9 OH- 400 180
* assuming thermodynamic calculation, probably overestimated (see section 3.3)
(a) (b)
Fig. 4. (a) Calculated evolution of ettringite, katoite and dissolved sulphate concentrations of the OPC hydrated paste while temperature evolves from 20°C to 70°C. (b) Calculated stability diagrams of Al-phases at 20°C and 70°C (act.
Ca2+ = act. AlO
2- = 10-3, [HCO3- ]total = [H4SiO4]total = 10-3 molal).
3.2. Experimental confirmation of the mineral assemblage and of the pore water at 70°C
To confirm this simulation, sound cement paste cubes cured at ambient temperature were immersed in a small volume of hyperalkaline solution and stored in a sealed box at 70°C for 50 days (Table 5). The temperature was set to 70°C until characterisation of the solid phases by XRD. Ettringite characteristic peaks were no longer visible in the diffraction patterns. No other sulphated crystalline phase was detected and selective dissolution was not needed anymore to reveal katoite presence (Fig. 1). After selective dissolution [22] carried out on these heated samples, the amount of anhydrous species remained the same,
14
whereas the katoite intensity increased in comparison with the sample stored at ambient temperature (Fig. 1).
Analyses of the solution after 50 days showed a massive release of sulphates (Table 5). Ettringite dissolution is the only source of sulphates. By calculation, we determined the ettringite amount necessary to explain this aqueous sulphate increase. The corresponding ettringite concentration was 62 mmol/L of material. This value is half of the theoretical amount of ettringite calculated from the OPC composition, being 130 mmol.L-1 (Table 4), meaning that only half of the sulphates released by the total dissolution of
ettringite, according to the XRD analysis (Fig. 1), were effectively released into the pore solution and that the other half of the sulphates remained in the solid under another form than ettringite.
Table 5.
Sulphate consideration of a sound cement paste cured at 20°C and then stored for 50 days at 70°C. Experimental data Deduced values
SO4 measured Solution volume OPC paste volume SO4 released by the OPC paste Corresponding dissolved ettringite
mmol/L mL mL mmol mol.L-1 of
pore solution
mmol mol.L-1 of
material 63.0 ± 7.5 9.5 4.1 0.79 0.62 0.26 0.064
3.3. Discussion
To summarise, at 20°C, the cement paste studied was composed of portlandite, C-S-H, ettringite, and traces of calcite and katoite. After an increase of temperature to 70°C, ettringite was no more observable and the amount of katoite increased. Monosulfoaluminate was expected but no trace was visible. Katoite is not an usual conversion product of ettringite, contrary to monosulfoaluminate. Nevertheless, this mineral has been reported in some cases at relatively high temperatures (above 70°C) [34, 35]. This difference in the cement paste may be explained by the relatively high amount of C4AF compared to C3A in the OPC used for the present experiment, which may have changed the equilibrium between ettringite and monosulfoaluminate at high temperatures, such as it is often described.
In Lothenbach et al [33], the choice was made not to consider katoite in the calculation for kinetic reasons. In our study, proof of katoite in the sample convinced us to keep this mineral in the database. Nevertheless, at room temperature, thermodynamic equilibrium predicted a high concentration of katoite in the cement paste. This phase is known to be kinetically hindered at 20°C [e.g. 36], which explains why this amount is probably overestimated compared to experimental measurement (Fig. 1). Partial dissolution of ettringite in favour of katoite, as predicted by modelling, seems to be a stronger phenomenon in the experiment. Indeed, a temperature increase led to a total dissolution of the ettringite with a release of sulphate. Anhydrite, gypsum or monosulfoaluminate remain were not detected by XRD.
At 70°C, katoite was the favoured phase containing aluminium and, by trapping aluminium, could have prevented monosulfoaluminate formation, although this temperature of 70°C has often been described as a pivotal temperature for balances between sulfoaluminates [e.g. 33]. Formation of monosulfoaluminate at the expense of ettringite was never observed in this study, which is in agreement with the findings of Paul et al. [34] and Buck and al. [35]. Nevertheless, in the modelling, when a non-siliceous katoite (
C
3AH
6) isintroduced instead of katoite (
C
3ASH
4), ettringite dissolves in a more consensual way in favour of15
The simplified stability diagram of Fig. 4-b built with all the Al-phases of Table 3 supports this assumption. Temperature increases the katoite relative stability and shifts the katoite/ettringite equilibrium to higher sulphate concentrations, which prevents monosulfoaluminate formation in these diagrams. The stability range of monocarboaluminate is also significantly reduced from 20°C to 70°C. This AFm carbonated phase was not detected by XRD analysis of the in situ samples.
Part of the sulphates released by ettringite dissolution stayed in the pore solution, whereas the other part seemed to stay in the solid phase in another form than ettringite (Table 5). One hypothesis could be that sulphates are adsorbed on the C-S-H [38-41]. A high C/S ratio, as is the case in a sound OPC, and a high temperature favour sulphate adsorption by C-S-H, [38, 39, 41]. According to Skapa [38], at 55°C and at 85°C, C-S-H at equilibrium with 10 mml/L of sulphate have a S/Si ratio of 0.018 and 0.025, respectively. Applied to our study, their findings mean that at 55°C and at 85°C at least 250 mmol and 345 mmol, respectively, of sulphate can be adsorbed per litre of pore solution, especially as in this study the amount of sulphate released in the solution was higher. So C-S-H phases have a considerable capacity to adsorb sulphate and this phenomenon may explain where the lacking sulphate was trapped in the solid phase.
4. Results and discussion on the alteration processes occurring around an OPC paste / argillite interface after one year of interaction
4.1. In situ temperature measurements
Throughout the entire experiment, the temperature was monitored by the 4 temperature sensors placed within the cement paste column. During the cement hydration reaction, the measured temperature increased from the initial temperature within the galleries around 15°C up to 68°C for the OPC paste before returning to the tunnel temperature two days later (Fig. 5). Monitoring confirmed that the installed heating device was able to maintain a temperature range between 65°C and 73°C. The difference of a few degrees between the sensors can be explained by their disposition within the system.
16
4.2. Mineralogical characterisation of the OPC paste / argillite interface after one year of interaction
4.2.1. Initial interface identification
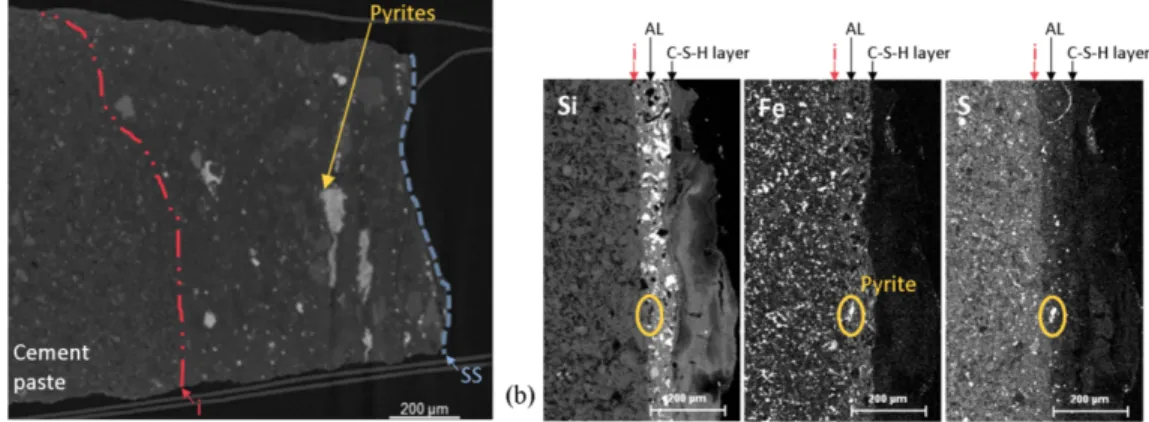
The interface between the OPC cement paste and the argillite was dismantled after one year of contact. Upon inspection of the cm-scale samples, the materials were found to be non-cohesive, and macroscopically white and bluish phases were observed to the naked eye on both sides of the separation surface (Fig. 6). Two different textures and layered framboid-like structures with high-intensity grayscale, reflecting their high density (Fig. 7-a), were visible on computed X-ray images. On elementary maps of similar areas, obtained by EDS, high-intensity dots superimposed on both iron and sulphur maps and corresponded to zero-intensity spots on the other elementary maps (Fig. 7-b). These framboid structures, interpreted therefore as pyrites, cannot be present in cementitious material but only in argillite. In light of these results, it appeared that a more or less thick layer of argillite remained in contact with the cementitious material. The interface was cohesive and inboard from the separating surface. The argillite layer's thickness was more than 800 microns on the computed X-ray image (Fig. 7-a), whereas it was only about 50 microns thick on the EDS maps (Fig. 7-a) and locally non-existent (Fig. 8-c); its shape was therefore more lenticular than a regular layer shape. These argillite lentil-like shapes were formed at the separating surface. In spite of the difficulty of interpreting the origin of this argillite layer attached to the cement paste, it may be suggested that it corresponds to argillite mud, the latter appearing while the cement paste was being poured.
Fig. 6. View of the separation surface showing white and bluish phases (left: OPC paste side, right: argillite side).
Fig. 7. Localisation of the interface at the cement paste side. Pyrites help to distinguish the cement paste from the argillite layer (AL). The interface (i) is cohesive and away from the separation surface (SS): computed X-ray image
17
4.2.2 Cement paste decalcification and carbonation
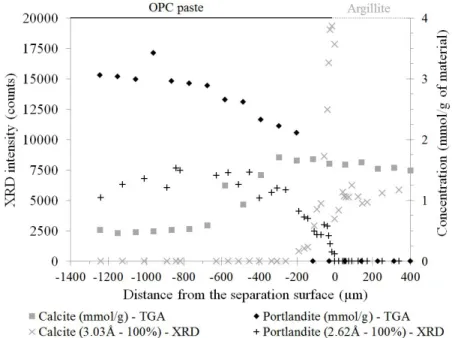
EDS elementary maps showed calcium depletion in the cement paste. This depletion was the highest in cases of absence of an argillite layer at the interface (Fig. 8-a, b), where decalcification occurred up to 400 µm within the cement paste (Fig. 8-c). The intensity of the portlandite main peak (2.62 Å) followed the same profile as that of the EDS and extended over about 400 microns as well (Fig. 9). The thermogravimetry profile also followed the same trend, but the decalcification appeared to extend deeper within the cement paste, up to 800 µm (Fig. 9). The portlandite was totally dissolved on at least 100 µm and C-S-H phases were probably partially decalcified in this area. The portlandite profile was determined by three methods. The thermogravimetry method allowed to obtain an average measurement on a relatively large volume of cement paste (40 mm3), while EDS and XRD measurements were carried out on
rectangles of 14×360 µm² and on spots of a few mm², respectively. This method has the advantage of being quantitative, whereas the other two are qualitative. Therefore, the portlandite alteration profile was probably better evaluated by thermogravimetry than by EDS or XRD, meaning, according to this first method, that the decalcification of the cement paste spread over about 800 µm after one year of interaction (Fig. 9).
XRD and thermogravimetry measurements showed calcite precipitation at the cement paste side (Fig. 9). No calcite crystal or calcite crust was visible at the interface by SE-SEM or X-ray µ-tomography. Calcite precipitation was diffused, located within the material matrix, and occurred over 700 µm. The calcite crystallised from calcium ions released by portlandite dissolution and from carbonates contained in the argillite pore water [11].
Fig. 8. Comparison of decalcification widths on Ca-EDS maps when an argillite-type layer is absent (a) or present (b): the presence of an argillite-type layer (At L) significantly reduces the highly decalcified area (HD area); SE-SEM image of a zoom on (a) overlapped by Ca-EDS intensity profile of the OPC paste side without argillite-type
18
Fig. 9. XRD and TGA profiles showing portlandite dissolution and calcite precipitation in the cement paste around the interface.
4.2.3. Ettringite precipitation within the cement paste
On the sound OPC diffractograms, ettringite was not observed at 70°C even though calculations predicted its presence (Table 5, Fig. 4-b), meaning that all the sulphates had been released in the pore water. Ettringite pattern was, however, detected by XRD in the one-year OPC sample between 40 µm and at least 1600 µm from the separation surface (Fig. 10) suggesting a process of secondary formation of ettringite within the cement paste. Two sulphate sources may be responsible for this ettringite precipitation: the argillite pore water and/or the cement paste pore water. According to CHESS computations, the sulphate concentration of the cement pore water at 70°C is 110 mmol.L-1 and even higher according to the
experimental test (Table 5). In the argillite pore water the sulphate concentration is much lower (9.5 mmol.L-1). The sulphate ions therefore diffused from the cement paste to the argillite. Accordingly,
ettringite probably formed from the sulphates of the cementitious material and not from those of the argillite by contrast to what is observed at 15°C [11]. A relatively low pH in the zone close to the interface and release of Ca by decalcification may favour ettringite precipitation in this zone.
19
4.2.4. Si-phase precipitation around the interface
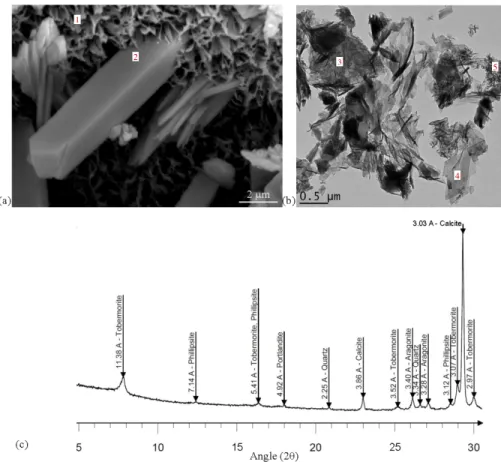
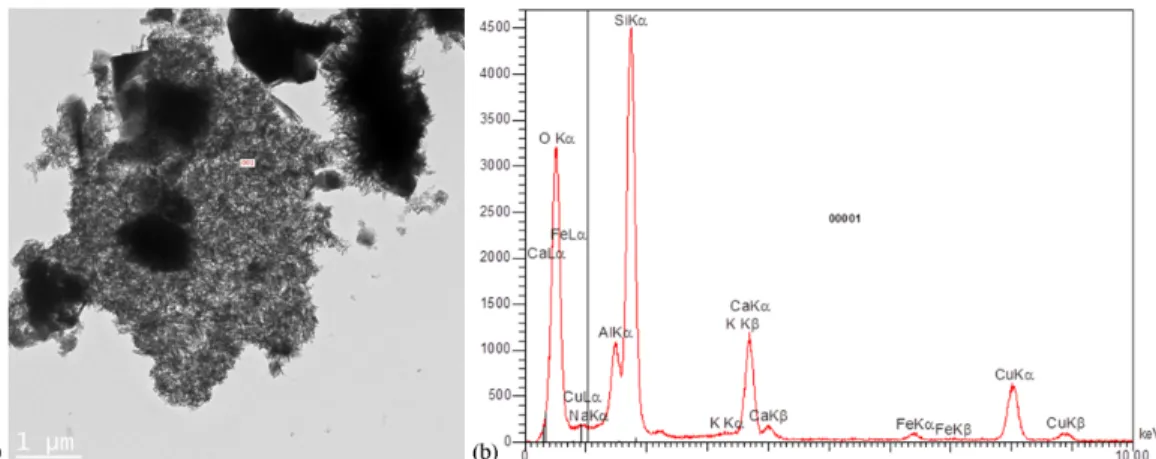
The bluish phase at the cement paste/argillite interface has been characterised as C-S-H in a previous TEM and SEM study [42]. The first observations by SEM of the separation surface showed the occurrence of a honeycomb structure pierced by prismatic minerals (Fig. 11-a). The honeycomb structure is often described as typical of C-S-H, whereas prismatic mineral exhibited twin planes in house roofs crossed at right angle, a feature that can be presented by phillipsite crystals. X-ray diffraction (Fig. 11-c) outlined patterns of phillipsite and tobermorite over a thickness of about 60 microns around the separation plane. This C-S-H layer was also observed on EDS elementary maps where calcium (Fig. 8) and silicon (Fig. 7-b) intensities were relatively high. TEM images and diffraction confirmed the presence of tobermorite and C-S-H (Fig. 11-b) in this zone with a crystalline structure similar to the ones described by Richardson [43]. Given the TEM-EDS measurements displayed in Figure 12, no clay phases were present on the observation grid and it is likely that the measured aluminium was taken up by C-S-H. C-A-S-H have already been described in previous studies on the degradation of claystone by an alkaline fluid [e.g. 44] or in contact with a cementitious material [e.g. 11].
Fig. 11. Tobermorite and phillipsite precipitation at the interface: SEM image of honeycomb structure (1) pierced by a phillipsite crystal (2) (a), TEM image with foil-like C-S-H (3), tobermorite (4) and C-S-H needle-like (5) (b), and
diagram of the separation surface of the cement paste side (c).
4
3 5
1
20
Fig. 12. TEM image of C-S-H from the separation surface (a) with Al content measured by TEM-EDS (b) indicating the possible formation of C-A-S-H.
Figure 13 shows simplified computed stability diagrams of Si-phases at 20°C and 70°C. Although Savage et al. [45] insisted on a general lack of reliable thermodynamic data for C-A-S-H and zeolites, several considerations in good agreement with the present experimental findings can be emphasised. In both cases the Ca-silicate hydrate tobermorite is stable over a large domain, although the stability domain of phillipsite increases with temperature. Tobermorite and phillipsite can co-exist in the pH range corresponding to a moderately attenuated alkaline plume and a decalcification process. These conditions are similar to the one encountered at a cement paste/claystone interface. Furthermore, Figure 14 indicates that the potassic phillipsite should predominate over all the other zeolites at the interface due to the diffusion of large amounts of potassium from the cement pore water. This is consistent with complementary EDS analyses of the zeolite crystals (not shown) that reported a significant content of potassium atoms. The high K/Na and K/Ca ratios in the cement paste pore solution are typical of the so-called fresh or early cement fluids, which do not exist in natural systems where zeolites precipitate. As the cement pore fluid evolves, the substitution of K and Na by Ca in zeolites takes place. Without potassium supply, zeolites of lower Al/Si ratio (such as Ca-heulandite) should be favoured, according to the thermodynamic analysis of Savage et al. [45]. Analcime and clinoptilolite do not seem to be stable under the studied conditions. As Chabazite was not observed in the samples, this zeolite was not considered in the modelling, although it has been observed in relatively similar conditions [46]. Eventually, Figure 14 shows that C-A-S-H may precipitate simultaneously with K-phillipsite and/or tobermorite, provided aluminium content is about 5×10⁻⁴ molal at 70°C.
21
Fig. 13. Computed stability diagrams of Ca-Si-phases at 20°C and 70°C (act. Ca2+ = 10-3, [Al3+]
total = 10-5 molal). A
temperature increase shifts the pH to lower values.
Phillipsite is a member of the zeolite group that includes mineral microporous framework silicates known for their absorbance properties. This zeolite crystallised among tobermorite from silicon provided by the clay mineral alteration; calcium mainly released by cement paste decalcification, potassium and sodium contained in large quantities in the cement paste pore water and aluminium probably provided by aluminate cement phases (ettringite dissolution). The latter may also be provided by dissolution of argillite clay phases, although precipitation or dissolution of clay phases have not yet been clearly observed in the samples. A simplified view of phillipsite precipitation can be formulated as follow:
alkalines (OPC paste fluid) + kaolinite → phillipsite 2K+ + 3Al
2Si2O9H4 + 5H2O + 6OH-→ 2AlKSi3O11H6 + 4Al(OH)4-
Precipitation of phillipsite has already been observed in experiments in which clay rock samples were immersed in an alkaline solution at temperature higher than 60°C [e.g. 5, 9]. Interface experiments and batch experiments may provide similar results.
Tobermorite is calcium silicate hydrate with a low Ca/Si ratio (0.83) and a well-defined crystal structure. This C-S-H may crystallise from silicon released by the alteration of argillite (quartz, montmorillonite and kaolinite dissolution) and calcium released by decalcification of the cement phases (portlandite dissolution and C-S-H decalcification) around the interface. This can be formalised as below:
portlandite + kaolinite → tobermorite
5Ca(OH)2 + 3Al2Si2O9H4 + 8.5H2O + 6OH- → Ca5Si6O27.5H21 + 6Al(OH)4-
and
portlandite + quartz → tobermorite
5Ca(OH)2 + 6SiO2 + 5.5H2O→ Ca5Si6O27.5H21
According to the stability diagrams of Figure 14, based on thermodynamic considerations only, tobermorite should precipitate even at 20°C and be more stable than the other C-S-H phases, whereas, in the literature, experimental tobermorite has never been neoformed at ambient temperature. Thermodynamic considerations only cannot explain the stability of tobermorite and phillipsite over temperature; a kinetic control is likely to occur. A minimal temperature, below which the precipitation reactions of these phases are not triggered, seems to exist.
OPC paste pore water pH Argillite pore water pH OPC paste pore water pH Argillite pore water pH
22
(a) (b)
Fig. 14. Computed stability diagrams of Ca-Al-phases at 70°C without considering (a) and considering (b) Na-K ion activity (act. Ca2+ = 10-3, act. Na+ = 10-2, act. K+ = 10-1, [H
4SiO4]total = 10-3 molal).
Given the retention properties and surface exchange of zeolites and tobermorite, it now appears that they may explain the relatively high concentrations of aluminium, sodium and potassium in this area observed on the EDS elementary profile (Fig. 15). Based on these findings, there is a significant chance that after one year the OPC paste / argillite interface zone can be filled with tobermorite, C-A-S-H and phillipsite. The heterogeneity in the distribution of phillipsite on the separation surfaces observed by SEM was noteworthy. In the current state of this study, only assumptions can be made about this heterogeneity. Figure 15 displays the element intensities obtained by EDS over the distance from the separation surface. For comparison, the corresponding microphotograph of the cement paste side is shown on Figure 8-c. Once again this area was selected because no argillite layer was observed and thus the extent of the perturbation was wider. In cementitious materials, part of the iron is contained in brownmillerite (C4AF), whereas, in the argillite, it is mainly concentrated in pyrites. Iron was therefore the discriminating element between the initial materials and the neoformed phases during the experiment. Since the iron intensity in the layer of tobermorite, phillipsite and C-A-S-H at the separation surface was low, it seems reasonable to believe that this layer was not formed within the material but in a gap. These observations help to conclude that, despite the fact that the cement paste was poured directly on the argillite in the experiment, an empty space may have been created between the materials. This space formation may be explained either by material alteration or by pressure on the materials due to the crystallisation of the neoformed minerals. Another explanation may be that, at the interface, a mixture of argillite dust, water and cement paste set up with a lower density than the initial materials. These minerals may have crystallised under conditions close to batch experiment ones. In other words, the interaction may differ from that of a purely solid/solid interaction.
To summarise the mineralogical evolution at an OPC/argillite interface at 70°C a schematic diagram is proposed in Figure 16.
23
Fig. 15. Elementary profiles built from the EDS maps of the OPC paste side without an argillite-type layer.
Fig. 16. Schematic diagram of the potential mineralogical evolutions and deduced diffusive processes at the OPC paste/argillite interface after one year of interaction at 70°C.
4.3. Microstructural evolutions at the interfaces
Computed images of X-ray µ-tomography (Fig. 17) clearly showed argillite attached to the cement paste. Framboidal structures with a high density were clearly identified as pyrites. Changes in the texture help to discriminate argillite from the cementitious material. µ-CT scanner resolution gave access to pore sizes larger than 0.8 µm, i.e. gave access to the macroporosity profile within the materials. From the interface, the OPC paste showed a macroporosity opening area over 850 µm followed by a low porosity area over 600 µm, and then, further, a constant macroporosity corresponding to the sound material macroporosity. The width of the porosity opening zone matched well with the decalcified zone. Moreover, in the zone
24
where macroporosity opened, portlandite clusters were not visible on X-ray µ-tomography slices, contrary to slices from the sound zone (Fig. 17-b, c). In light of this, portlandite dissolution largely increases the proportion of macropores that precipitation processes did not fill. These microstructural observations are consistent with Gaboreau et al. [13] data that outlined a 3.5 cm wide opening zone in a similar cement paste (CEM II) after 15 years of interaction at 15°C. However, a low porosity zone deeper in the material was not described in their paper.
Fig. 17. Macroporosity profile (a) and computed images obtained by µ-tomography in the sound zone (b), in the macroporosity opening area (c) and in the argillite (d).
X-ray µ-tomography only gave information on the macroporosity representing a few per cent of the total porosity, whereas the 14C-PMMA autoradiography method enabled better understanding of the porosity
evolution. Indeed, analyses obtained by 14C-PMMA autoradiography showed a decrease of the total
connected porosity on more than 1 cm from 34% in the cement paste to 27% at the interface (Fig. 18). Ettringite precipitation is the only process that may explain porosity decrease so deep within the material. Overall, the alteration of the cement paste led to a decrease of the total porosity. Decalcification is often described as a process opening the porosity by dissolution of Portlandite [13, 14] and because C-S-H with a low Ca/Si ratio have a higher layer spacing than C-S-H with a high Ca/Si ratio [47]. Precipitation processes, such as carbonation, and ettringite, C-(A)-S-H and zeolites neoformation within the cement paste matrix led to a porosity decrease in the cement paste. These processes occurred simultaneously, but precipitation had a stronger effect on the porosity evolution than decalcification. By triggering and strengthening the precipitation of minerals, the increase of temperature led to the opposite conclusion than
25
the one obtained at ambient temperature [13]. However, the C-S-H layer at the interface did not seem to constitute a physical barrier to diffusion, contrary to what may be expected, insofar as C-S-H and tobermorite have a very low porosity (< 10 nm).
a.
Fig. 18. Porosity map of the OPC paste (interface on the right) obtained with the autoradiography technique (a). The argillite layer is clearly identifiable (blue area). Porosity profile (b) determined on the dotted area drawn on the
porosity map.
5. Conclusion
The experimental protocol developed in this study allowed to characterise a claystone / cement paste interface under high temperature (70°C). Both the rock and the cement paste were fully water-saturated throughout the experiment duration. These thermo-hydraulic conditions were necessary to properly carry out the experiments and to interpret their results. Scoping thermal simulation was a valuable tool to design the heating device. A specific dismantling protocol helped to sample the interface.
The multi-ion attack of the cement paste by the argillite over one year caused its decalcification (portlandite dissolution and C-S-H partial decalcification) over 800 µm, carbonation (calcite diffuse precipitation) over 700 µm and secondary ettringite precipitation over 1600 µm. These phenomena led to a decrease of the total connected porosity over 1 cm. Precipitation of a calcite crust has often been noticed in trials where the cementitious material was immersed in fresh water [48]. The difference in calcite precipitation may have different effects on the porosity and, therefore, on the diffusion properties through the interface. Indeed, a calcite crust may greatly reduce the diffusion between both materials and thus limit the progression of disturbances within the materials. So the evolution of the diffusion properties of those areas remains to be accurately explored. The sulphate attack of the cement paste by the clay pore water generally observed at low temperature was not observed at 70°C. Indeed, increasing temperature caused ettringite dissolution in the sound cement paste and thus a sharp increase of the sulphate concentration in the pore solution, exceeding the concentration in the argillite pore water. The diffusive exchanges of sulphates were therefore reversed compared to those observed at lower temperature [11].
Phillipsite, probably under its potassic form, was observed at the interface between the OPC paste and the argillite after one year of interaction, whereas zeolites were not identified at interface investigations at room temperature under in situ conditions, nor under laboratory conditions. However, zeolites were
26
noticed in batch tests at high temperature (> 60°C) or under extreme conditions [4, 5, 8, 9]. The same comment applies to tobermorite. This clearly suggests that temperature is the most important parameter (i.e. more significant than time) to trigger and enhance phillipsite and tobermorite precipitation. It is worth mentioning that tobermorite and phillipsite are thermodynamically stable both at 20°C and 70°C in a (altered) cement paste [45] and have therefore often been overestimated in models at ambient temperature [e.g. 49, 50].
The disturbance extension was not wider at 70°C than conventionally observed at room temperature [14]. Temperature increases the amplitude and intensity of the degradation mechanisms, but also facilitates precipitation of other phases, such as C-A-S-H, phillipsite and tobermorite, forming a thick and almost continuous layer. Temperature accelerates and favours their crystallisation, but also favours their precipitation at the expense of other phases. This is in agreement with previous batch tests performed at high temperature. The porosity decreased at both sides of the interface. The precipitation processes had a stronger impact on porosity than decalcification, contrary to what has been observed at ambient temperature [13]. The precipitation of secondary Ettringite, in particular, may have a strong and wide impact on porosity. Even though C-S-H phases have a low porosity (nanoporosity), the C-S-H layer at the interface does not seem to be a zone where porosity becomes clogged.
From a more general perspective, this study performed in situ at 70°C has allowed improving the understanding of the processes that may occur at interfaces between cementitious and clayey materials in high-level waste geological disposal facilities during the thermal phase.
Acknowledgements: We would like to thank the late Dr Jean-Michel Le Cléac’h, professor and researcher at Mines-ParisTech, who kindly helped us to recognise phillipsite crystals from SEM analysis, and Dr Marja Siitari-Kauppi for the work done at Helsinki University. We also gratefully acknowledge our colleagues Justo Cabrera and Patrice Desveaux for their valuable advice and ideas concerning the CEMTEX protocols, as well as two anonymous reviewers for their constructive and detailed comments.
References