HAL Id: hal-00461898
https://hal-mines-paristech.archives-ouvertes.fr/hal-00461898
Submitted on 6 Mar 2010HAL is a multi-disciplinary open access archive for the deposit and dissemination of sci-entific research documents, whether they are pub-lished or not. The documents may come from teaching and research institutions in France or abroad, or from public or private research centers.
L’archive ouverte pluridisciplinaire HAL, est destinée au dépôt et à la diffusion de documents scientifiques de niveau recherche, publiés ou non, émanant des établissements d’enseignement et de recherche français ou étrangers, des laboratoires publics ou privés.
Satellite data for the air pollution mapping
Lucien Wald, Ludovic Basly, Jean-Michel Baleynaud
To cite this version:
Lucien Wald, Ludovic Basly, Jean-Michel Baleynaud. Satellite data for the air pollution mapping. 18th EARSeL Symposium on Operational Remote Sensing for Sustainable Development, May 1998, Enschede, Netherlands. pp.133-139. �hal-00461898�
WALD, Lucien, BASLY, Ludovic, and BALEYNAUD, JeanMichel. Satellite data for the air pollution mapping. In: Proceedings of the 18th EARSeL Symposium on Operational Remote Sensing for Sustainable Development, Enschede, Netherlands, 1114 May 1998, Nieuwenhuis, Vaughan & Molenaar Editors, Balkema, Rotterdam, ISBN 9058090299, p. 133139
Satellite data for the air pollution mapping
L. Wald, L. Basly
Groupe Télédétection & Modélisation, Centre d’Energétique, Ecole des Mines de Paris, France
J. M. Baleynaud
Centre Inter-universitaire de Calcul de Toulouse, France
ABSTRACT: This article investigates the potentials of satellite imagery for the mapping of air quality parameters. Concentrations of black particulates, sulphur dioxide and other pollutants measured in the city of Nantes with ground stations were compared to coincident Landsat TM6 data (thermal infrared band data). The black particulates concentration and the apparent temperature from satellite data are highly correlated. Finally, it is demonstrated that the spatial distribution of the black particulates can be mapped from remotely-sensed data. Possible improvements in precision of the mapping are discussed.
1 INTRODUCTION
Atmospheric pollution in cities is receiving more and more attention. Chronic pollution exists in urban atmosphere with strong, usually not spectacular, impacts on human health, human comfort and daily life. For example, provisional interdictions of circulation of private cars are more and more often taken by authorities in large cities because high levels of air pollution are reached. Medical studies tend to demonstrate that breathing diseases may be linked to peaks in pollution and that old persons and very young children are most affected (see e.g., McMichael et al. 1996). It is therefore resented as one of the major issues to be tackled by our society, including research and political communities.
Networks of instruments have been established in major cities. They are composed of a few measuring stations and are a means for alert. They are also a valuable tool for researchers and planners who are interested in knowing how the air quality evolves according to the various parameters affecting it. However air quality is highly variable within a city. It is namely but not uniquely a function of the intensities of the air turbulent diffusion around the pollution sources. These sources can be mobile, as it is the case for cars. The ventilation is a function of
the wind direction; it follows that a street may be occasionally ventilated or not.
Further the measuring stations are scarcely distributed, so they do not allow a proper mapping of the pollution.
However mapping capability is strongly required because of the major following benefits:
• it provides a complete survey of the city
• it shows the major sources of pollution together with their extension
• it indicates where efforts should be preferably made to decrease the level of pollution
• it helps further analysis in showing relationships that might exist between city features (taken in broad sense) and air pollution distribution • it serves as a basis for re-enforcing the sampling
strategy by moving some stations to appropriate locations, or adding some or possibly removing some.
2 BACKGROUND
Routine observations made by the environmental satellites are certainly a valuable aid in improving the actual methods of mapping. Some studies have been made using such data. Most of them deal with the urban heat island (see e. g., Dousset, 1991;
Dousset et al., 1993; Henry et al., 1989; Hyoun-Young Le, 1993; Kim, 1992; Price, 1979; Quattrochi, Ridd, 1994; Roth, Oke, 1989). They mostly consist in mapping the radiance sensed by thermal instruments onto a map of the city. Such instruments are intended to measure the temperature of the surface of the objects. The heat urban islands then appear as hot anomalies compared to the temperatures of the remainder of the city. These urban heat islands are not an indicator of the air pollution but do favour it. Urban sink is a less common phenomenon and consists in an urban area cooler than the surrounding rural area. It has also been observed by satellite (Carnahan, Larson, 1990)
Other studies specifically deal with the possible relationships between the air pollution and satellite images. Sifakis et al. (1992) use two Landsat images taken at a date of non-pollution and at a date of a pollution episode. Temperature maps (actually radiance maps) are made for both dates and compared. Large decreases in temperature are related to the appearance of a pollution layer over some parts of the city. Images taken in the visible range are also processed but a different way. Anomalies in contrast, i.e. abrupt changes in spatial gradients, are mapped. But for the man-made changes, and if the time-lag between both images is not too large, then these changes are related to the appearance of the pollution layer. Actually such an approach can be used with any sensor being sensitive to a change in atmospheric absorption - scattering of the reflected (visible to near - infrared) or emitted radiation (thermal infrared), as it has already been successfully used in other domains (see e. g., Wald, Nihous, 1981 in oceanography, or Wald, Georgopoulos, 1984, in meteorology). This study has been successful in mapping the extension of the pollution layer. However it presently has limitations. Namely no link has been established with the actual level of pollution; such a mapping cannot be made at fine-scale and no accuracy of the pollution level can be assessed at the pixel level.
Other studies seek for a relationship between satellite data and ground-based measurements. These satellite data are radiances observed by the sensor in thermal infrared band. These radiances are a function of the temperature and emissivity of the surface and also of the optical properties of the atmospheric column above the pixel and its surroundings.
A decrease in the atmospheric transmission factor caused by the appearance of a pollution layer (more absorption and scattering) results into a decrease in the temperature observed by the space-borne sensor. This was experienced and discussed by Mc Lellan as early as 1973. Actually the change would also have an impact on the radiance emitted by the atmosphere but the impact is negligible in a first approximation
because the pollution layer is usually of very limited vertical extension and this radiance results from an integration over the entire atmospheric column.
Some studies have been made along these lines. They make use of images acquired by the Landsat-TM sensor. This sensor has several bands (Landsat-TM1 to 7), all of them but one are in the visible or near-infrared range with a spatial resolution of 30 m. The thermal infrared band (TM6) has a spatial resolution of 120 m, four times less than that of the other bands. The sensor outputs in this band are calibrated in radiance by the means of in-board calibration systems. These radiances are in turn transformed into apparent temperatures at the top of the atmosphere. It should be noted that the digital numbers output from TM6 are opposite to the apparent temperatures: the colder a given surface, the smaller the apparent temperature, and the larger the digital count in TM6. Landsat images are acquired at 10h30 mean solar time, in clear sky conditions. This hour is rather suitable for this kind of investigation. Strong insolation has not yet warmed too much the objects, the night cooling has already passed and objects within the cities tend to have rather similar surface temperatures.
Poli et al. (1994) have studied the relationship between a map of apparent temperature of Roma (Italy) and the total particulate matter suspended in the air (PTS) in winter season. The PTS as well as the sulphur dioxide (SO2) have been measured at five locations and daily added up. The particulate matter is assumed to be a significant indicator of the atmospheric pollution as well as a good tracer of the air quality. Noticeable levels of pollution have been observed for the day under concern. Poli et al. have found a strong negative correlation (-0.97) between the satellite-derived and the PTS. Confidence level for this coefficient is well above 95 per cent. On the contrary, the correlation between the sulphur dioxide (SO2) and satellite-derived temperature was weak and there was no significant relationship.
Even weaker correlation with SO2 was observed by (Brivio et al., 1995) for the Milan urban area. These authors use apparent temperatures with a pixel of 1 km in size, observed by a sensor aboard the NOAA satellites. Three images were processed: 12, 13 and 14 February 1993. The correlation with the PTS is also weak, and it may be explained by the very large size of the pixel.
Finzi, Lechi (1991) analysed two Landsat images of Milan (Italy) and compared them. The first one is dated from 20 January 1983 and was taken during clean conditions. The second is dated 27 January 1986 when pollution reached critical levels. Though the SO2 itself is transparent in thermal IR band, it is usually associated with Nox particulates and aerosol, giving a combined effect of opacity within the atmosphere. Hence the authors considered the SO2
concentration as a good tracer of the global urban air pollution level. Ten ground stations were considered, each supplying SO2 concentrations every 30 minutes. Prior to the analysis, Finzi and Lechi have aggregated the TM6 pixels into large polygons, one per station, covering the city. For the unpolluted day, the correlation coefficient between the SO2 and the satellite apparent temperatures is very low (0.48). For the polluted day, this coefficient is -0.84. However, a close examination of their findings shows that these results are partly contradictory and that no definite conclusion can be drawn. As for Brivio et al., the use of large polygons may partly explain the results, given the large variability in space and time of the pollutants.
To summarise, only a few studies have been made on the correlation between satellite measurements in thermal infrared and air quality parameters. They partly conflict regarding the SO2. This study adds to the presently limited evidence on such correlation.
3 DESCRIPTION OF THE STUDIED AREA
Nantes is a large city, located in Western France, along the Loire River, close to its mouth (16 km). Geographical co-ordinates are 47.23 N and 1.55 W. It comprises about 470 000 inhabitants. Nantes has been a very active harbour some centuries ago with many exchanges with America and Africa. The ocean is only 54 km to the West and therefore influences the climate of Nantes which is quite mildly. Except for an oil refinery 20 km to the West, Nantes has no polluting industry. Pollution is mostly due to vehicle traffic (Loirestu'Air, 1995).
Loirestu'Air is the body in charge of measuring air quality in Nantes and vicinity. In May 1992, fourteen measuring stations were located within the urban area, twelve for the city itself. Among them, three were measuring nitrogen dioxide (NO2) and four sulphur dioxide (SO2), as indicated in Table 1. The measurements are well as the implementation of the network follow the standards AFNOR NFX 43-005 decreed in 1977. Most of these stations are measuring the background air quality: they are located at about 100 m of a street with a weak traffic. Others are located along the major traffic axes. Other measured parameters are black particulates (BP), nitrogen monoxide (NO), strong acidity (AF). The BP are daily sums, while for the others, measurements are made every 15 minutes. A daily mean value is provided by averaging the measurements over the day. Correlation between the various parameters is shown in Table 2. Correlations between the daily averages are strong, they are usually lower between instantaneous measurements
and daily averages. Air quality parameters are strongly variable in time, either because of the high variability of the traffic, or of the volatility and chemical transformations of some pollutants. Correlation between the various parameters and the BP is usually high. Hence the BP can be considered as representing the pollution level for this day. The BP differs significantly from the PTS. The BP measures the density of particles having a diameter larger than 5 microns. The threshold for the measurement of the PTS is variable and it is not always a reliable indicator of pollution.
The day of May 22, 1992, has been a sunny day with clear sky. Pollution level was below critical levels. A Landsat image was acquired on that day at 1017 UT. A sample of this image is presented in Figure 1. Size is 15.36 km, with a pixel size of 30 m. The channel TM4 (at 0.8 microns) reveals the patterns of the streets and roads in the city (in dark tones). The airport is clearly seen in the South. Also in dark are the Loire river and two other rivers flowing into the Loire, from the North and from the Southeast. Nantes is obviously organised along these water streams. Light tones are mostly related to vegetation and several large parks are found in Nantes
Figure 1. Landsat image of the city of Nantes, (TM-4, at 0.8 microns) acquired, on May 22, 1992. The network of streets is fairly seen in dark tones, as well as the Loire river and the airport in the South. Copyright and courtesy of Eurimage.
4 COMPARISON BETWEEN AIR QUALITY MEASUREMENTS AND SATELLITE OBSERVATIONS
The processing of the Landsat data was minimal. No calibration was applied. Looking into the physics of the problem, it appears obvious that the spatial resolution of the sensor has a strong influence upon the results. Hence no geocoding was performed to avoid a resampling of the signal. The TM6 pixel is 120 m in size.
Locations of pollution measuring stations were reported onto a digital map of the streets of Nantes. This map was superimposed onto the Landsat image. The TM4 channel (Figure 1) was used for that processing because it clearly exhibits the network of streets. From TM6, were extracted the digital counts corresponding to the stations as well as their vicinity (radius of about 100 m). The difficulty of extracting the relevant value was larger than expected.
The error in location is not the largest one. The main difficulty is caused by the exact location of the measuring instrument which can be e.g., on a wall in a narrow street, or within a park within a patchwork of lawns and trees. To each station was attached a score summarising the quality of the extraction. The local heterogeneity of the digital counts and the vicinity of the measuring instrument have been taken into account to establish that score.
Once the fourteen TM6 digital counts extracted, they were compared to the measurements of the various pollutants, either on a daily basis or for the time of image acquisition by the satellite. An apparent temperature was computed with the following formula:
TM6 apparent = 170 - TM6 digital (1) temperature count
Formula (1) is arbitrary and simply intends to obtain values which increase with the apparent temperature and not the opposite like the TM6 digital count. The units are arbitrary. Table 3 gives the correlation coefficient between the pollutant measurements and the apparent temperatures. The coefficients corresponding to the confidence level of 95 per cent are also given. This Table has been
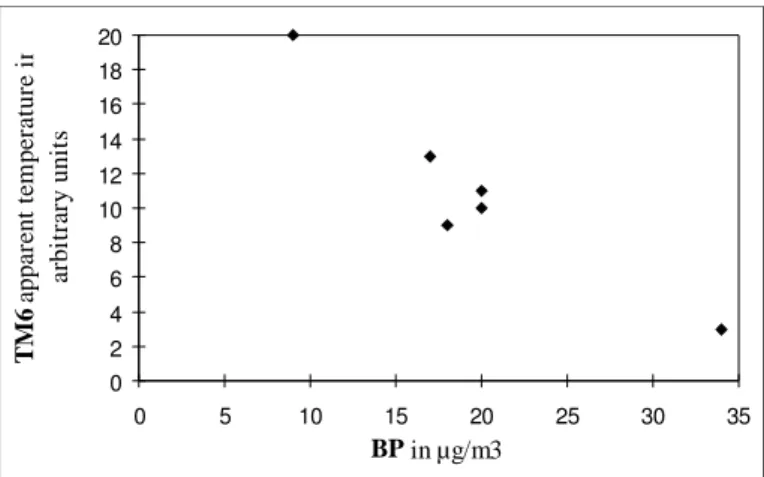
computed by removing several stations from the initial list of fourteen, as discussed above. A very high and significant correlation (0.95) is found between the BP and the apparent temperature. Figure 2 exhibits the BP versus the apparent temperature. A high correlation coefficient (0.86) is also found with the daily averaged SO2 but with a lower confidence level (85 per cent). It should be noted that the link between apparent temperatures and the SO2 is larger on a daily basis than on an instant basis (correlation is only 0.67). This is also true for the NO2 and NO; the correlations are weak in both cases. Finally Table 3 indicates that the correlation is also weak for the AF.
We conclude that only the BP is highly correlated to the apparent temperature. It is likely that the SO2 is correlated to the apparent temperature but the number of measurements is too small for being conclusive. 0 2 4 6 8 10 12 14 16 18 20 0 5 10 15 20 25 30 35 BP in µg/m3 T M 6 a p p a re n t te m p er a tu re i n a rb it ra ry u n it s
Figure 2. Correlation between black particulates for May 22, 1992 (BP, in µg/m3) and apparent
temperature observed by the satellite (in arbitrary units)
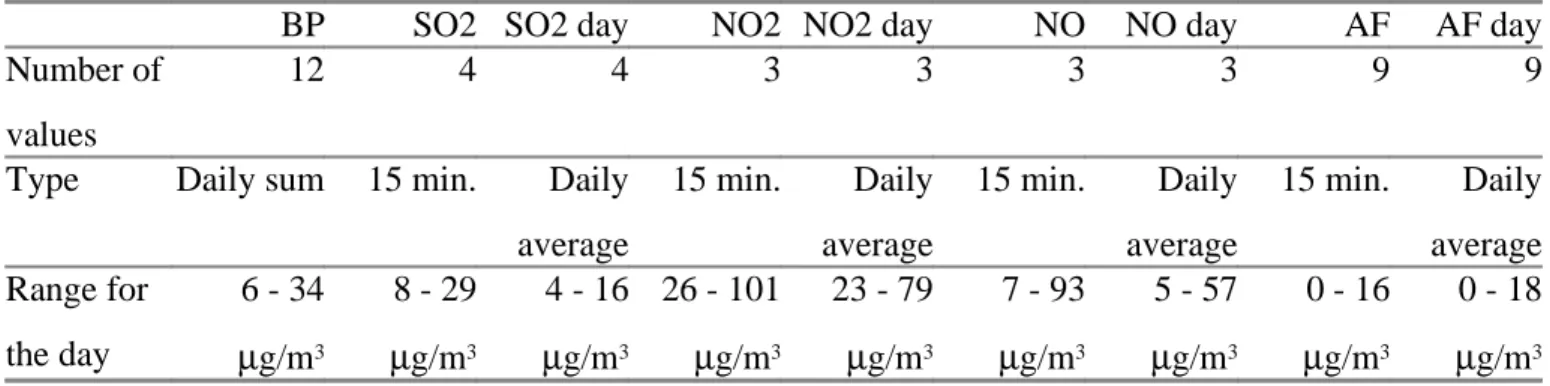
Table 1. Number of measurements available on May 22, 1992, at 10h15 UT and for the day.
BP SO2 SO2 day NO2 NO2 day NO NO day AF AF day Number of
values
12 4 4 3 3 3 3 9 9
Type Daily sum 15 min. Daily average 15 min. Daily average 15 min. Daily average 15 min. Daily average Range for the day 6 - 34 µg/m3 8 - 29 µg/m3 4 - 16 µg/m3 26 - 101 µg/m3 23 - 79 µg/m3 7 - 93 µg/m3 5 - 57 µg/m3 0 - 16 µg/m3 0 - 18 µg/m3
Table 2. Correlation coefficients between pollutant measurements.
BP SO2 SO2 day NO2 NO2 day NO NO day AF day
BP 1.00 0.99 1.00 1.00 1.00 1.00 1.00 0.76
SO2 0.99 1.00 0.89 0.96 1.00 0.89 1.00 N/A
SO2 day 1.00 0.89 1.00 0.65 0.84 0.50 0.80 N/A
NO2 1.00 0.96 0.65 1.00 0.96 0.98 0.98 N/A
NO2 day 1.00 1.00 0.84 0.96 1.00 0.89 1.00 N/A
NO 1.00 0.89 0.50 0.98 0.89 1.00 0.92 N/A
NO day 1.00 1.00 0.80 0.98 1.00 0.92 1.00 N/A
AF day 0.76 N/A N/A N/A N/A N/A N/A 1.00
Table 3. Correlation coefficients between the pollutant measurements and the apparent temperatures measured in TM6 image*.
BP SO2 SO2 day NO2 NO2 day NO NO day AF day Correlation coefficient 0.95 0.67 0.86 0.43 0.67 0.26 0.61 0.68
Number of values 6 4 4 4 4 3 3 9
Conf. level 95 % 0.81 0.95 0.95 0.95 0.95 0.997 0.997 0.67
*The second line gives the number of values. The third one provides the correlation coefficient for which the confidence level of 95 per cent is attained for this number of values.
5 MAPPING THE CONCENTRATION OF BLACK PARTICULATES
A linear relationship can be found between the BP and the TM6 digital counts, by a least-square regression (see Table 4 for the regression parameters):
BP = 1.38 * TM6 digital counts - 200.25 (2) The relationship (2) can be applied to any pixel of the TM6 image in order to derive the BP and hence to map the concentration of the BP in Nantes. This was performed onto the six TM6 digital counts not used to establish the relationship. The discrepancies between the observed and the predicted values have displayed in Table 5. The bias is very high and there is an overestimation of the BP: relative value is -55
per cent. The rms. is also high, relative value is 78 per cent.
We conclude that the mapping of the BP is possible using the TM6 image. This mapping is not very accurate, the relative rms. is about 80 per cent. A fusion of the estimated map and of the few measuring stations will likely improve the results (see the work of e.g., Beyer et al. 1996 or D'Agostino, Zelenka 1992). For future works, account should be taken of the network of the streets, which constitutes the network for the ventilation of the city, along which the BP disperse.
The consideration of the streets network would also ensure that the emissivity of the surfaces is more or less the same, and would avoid to predict large BP concentration because of a very low emissivity. Given the high variability in space of the pollutants, it is likely that despite the inaccuracy of the above relationship, such a mapping would
provide more accurate prediction than an interpolation method making only use of the measuring ground stations.
Table 4. Parameters of the regression line between the BP and the digital counts measured in TM6 image*.
Correlation coefficient 0.95 Regression line. Slope 1.38 Regression line. Offset - 200.25 Explained variance (%) 0.89 Error on slope 0.24 (17 %) Error on offset 37.77 (19 %) *BP = slope * TM6 + offset.
Table 5. Discrepancy between observed values of the BP and predicted values from satellite observations*.
Mean value for the BP (in µg/m3) 13
Bias (observed - predicted) (in µg/m3) - 7 (- 55 %)
RMS. (in µg/m3) 10 (78 %)
Standard-deviation (in µg/m3) 7 (56 %)
*Predictions are made using the regression line defined in Table 4. The model is applied to the six stations not used to establish the regression line.
6 CONCLUSIONS
This study adds evidence on the correlation between satellite measurements in thermal infrared and air quality parameters. It has been shown that the BP is highly correlated to the apparent temperature. It is likely that the SO2 is correlated to the apparent temperature but the number of measurements is too small for being conclusive. Further studies are needed to definitely assess the relationship between satellite observations and air quality.
Mechanisms allowing the pollution layer to be sensed in the TM6 channel would also affect the visible and infrared bands. A study is underway to test numerically the possible mechanisms of the high correlation between BP concentration and satellite data. This study will investigate whether pollutants can also be observed in visible and infrared channels. A practical consequence is that any classification of a city using remotely-sensed data should take into account the pollution level because it would be equivalent to local depletions of the atmospheric visibility.
Another study will analyse the influence of the pixel size. High spatial resolution data seem
desirable. Such images may be synthesised with the ARSIS concept (Ranchin et al., 1998).
The mapping of the BP is possible using the TM6 image. Paving the way in this domain, the study assessed the accuracy of the mapping, which is presently low. Methods for quality improvements have been discussed and further studies are needed.
Though of limited extension: one city, one date, the present study clearly demonstrates that satellite observations of apparent temperature of a city bring unique information about air quality, which cannot be attained by conventional means.
ACKNOWLEDGEMENTS
The authors are indebted to Eurimage which kindly provided the Landsat image, and to Loirestu'Air which kindly supplied the in situ data. The authors are grateful to Giulia Abbate, Karine Jaloustre, Eberhard Parlow and Roberta Ruffo for fruitful discussions and help. Special thanks are due to Luc Lavrilleux for he made us understanding air quality.
REFERENCES
Beyer H., Wald L., 1996. Merging ground-measurements and satellite-derived data for the construction of global radiation map. In :
Proceedings of the conference "Fusion of Earth data:
merging point measurements, raster maps and remotely sensed images", Cannes, France, February 6-8, 1996, Thierry Ranchin and Lucien Wald Editors, published by SEE/URISCA, Nice, France, pp. 37-43.
Brivio P. A., Genovese G., Massari S., Mileo N., Saura G., Zilioli E., 1995. Atmospheric pollution and satellite remotely sensed surface temperature in metropolitan areas. In EARSeL Advances in Remote Sensing Ôpollution monitoring and geographical information systemsÕ, pp. 40-46, EARSeL, 2, avenue Rapp, Paris, France, 185 p.
Carnahan W. H., Larson R. C., 1990. An analysis of an urban heat sink. Remote Sensing of Environment,
33, pp. 65-71.
D’Agostino V., Zelenka A., 1992. Estimating solar global irradiance by integration of satellite and network data: the cokriging approach. Science de la
Terre, Série Informatique, 31, pp. 461-465.
Dousset B., 1991. Surface temperature statistics over Los Angeles: the influence of land use. In Proceedings IGARSSÕ91, IEEE Catalog Number 91CH2971-0, pp. 367-371.
Dousset B., Flament P., Bernstein R., 1993. Los Angeles fires seen from space. EOS Transactions,
74, 3, pp. 33-38.
Eliasson I., 1992. Infrared thermography and urban patterns. International Journal of Remote Sensing,
13, 5, pp. 869-879.
Finzi G., Lechi G. M., 1991. Landsat images of urban air pollution in stable meteorological conditions. Il Nuovo Cimento, 14C, pp. 433-443. Gallo K. P., McNab A. L., Karl T. R., Brown J. F., Hood J. J., Tarpley J. D., 1993. The use of vegetation index for assessment of the urban heat island effect. International Journal of Remote
Sensing, 14, pp. 2223-2230.
Henry J. A., Dicks S. E., Wetterquist O. F., Roguski S. J., 1989. Comparison of satellite, ground-based, and modelling techniques for analyzing the urban heat island. Photogrammetric Engineering and
Remote Sensing, 55, pp. 69-76.
Hyoun-Young Le, 1993. An application of NOAA AVHRR thermal data to the study of urban heat islands. Atmospheric Environment, Part B, 27, pp. 1-13.
Kim, H. H., 1992. Urban heat island. International
Journal of Remote Sensing, 13, pp. 2319-2336.
Loirestu'Air, 1995. La pollution de l'air à Nantes et dans l'estuaire de la Loire en 1994. Report from Loirestu'Air, Nantes, France, 121 p.
McLellan A., 1973. Remote sensing of atmospheric turbidity variations by satellite. Journal of
Spacecrafts and Rockets, 10, 11, pp. 743-747.
McMichael A. J., Haines A., Slooff R., Kovats S. editors, 1996. Climate change and human health, World Health Organization, Geneva, Switzerland, 297 p.
Mestayer P., Anquetin S., 1995. Climatology of cities. In: Diffusion and transport of pollutants in
atmospheric mesoscale flow fields, pp. 165-190, Gyr
A. and Rys F.-S. Editors, ERCOFTAC Series, Kluwer Academic Publishers, 217 p.
Poli U., Pignatoro F., Rocchi V., Bracco L., 1994. Study of the heat island over the city of Rome from Landsat-TM satellite in relation with urban air pollution. In: Remote sensing - From research to
operational applications in the new Europe, pp.
413-422, R. Vaughan Ed., Springer Hungarica, 442 p.
Price J. C., 1979. Assessment of the urban heat island effect through the use of satellite data.
Monthly Weather Review, 107, pp. 1554-1557.
Ranchin T., Wald L., Mangolini M., 1998. Improving spatial resolution of images by means of sensor fusion. A general solution: the ARSIS method. In: Remote Sensing and Urban Analysis. Edited by J.-P. Donnay and M. Barnsley. To be published by Taylor & Francis, London, GISDATA Series n° 5.
Quattrochi D. A., Ridd M. K., 1994. Measurements and analysis of thermal energy responses from discrete urban surfaces using remote sensing data.
International Journal of Remote Sensing, 15, pp.
1991-2022.
Roth M., Oke T. R., 1989. Satellite-derived urban heat islands from three coastal cities and the utility of such data in urban climatology. International
Journal of Remote Sensing, 10, pp. 1699-1720.
Sifakis N. I., Bildgen P., Gilg J.-P., 1992. Utilisation du canal 6 (thermique) de Thematic Mapper pour la localisation de nuages de pollution atmosphŽrique. Application ˆ la rŽgion dÕAth マ nes (Gr マ ce).
Pollution AtmosphŽrique, 34, pp. 96-107.
Terjung W., OÕ Rourke P., 1980. Influence of physical structures on urban energy budgets.
Boundary-Layer Meteorology, 19, pp. 421-439.
Todhunter P., Terjung W., 1988. Intercomparison of three urban climate models. Boundary-Layer
Meteorology ,42, pp. 181-205.
Wald L., Georgopoulos D., 1984. Atmospheric lee waves and their possible influence on the sea surface. Boundary-Layer Meteorology, 28, pp. 309-315.
Wald L., Nihous G., 1980. Ligurian Sea : annual variation of the sea surface thermal structures as detected by satellite NOAA 5. Oceanologica Acta, 3, pp. 465-469.