HAL Id: hal-00952855
https://hal.archives-ouvertes.fr/hal-00952855
Submitted on 28 Feb 2014HAL is a multi-disciplinary open access archive for the deposit and dissemination of sci-entific research documents, whether they are
pub-L’archive ouverte pluridisciplinaire HAL, est destinée au dépôt et à la diffusion de documents scientifiques de niveau recherche, publiés ou non,
To cite this version:
Pascal Cuxac, Alain Lelu, Martine Cadot. Paving the way for next generation data-stream cluster-ing: towards a unique and statistically valid cluster structure at any time step. International Journal of Data Mining, Modelling and Management, Inderscience, 2011, 3 (4), pp.341-360. �10.1504/IJD-MMM.2011.042933�. �hal-00952855�
Paving the way for next generation data-stream
clustering: towards a unique and statistically valid
cluster structure at any time step
Pascal Cuxac
INIST-CNRS, 2 allée du Parc de Brabois,
CS 10310, 54 519-Vandoeuvre-lès-Nancy Cedex, France E-mail: [email protected]
Alain Lelu
LASELDI/Université de Franche-Comté,
30 rue Mégevand, 25030 Besançon Cedex, France and
LORIA Campus Scientifique,
BP 239-54506 Vandoeuvre-lès-Nancy Cedex, France E-mail: [email protected]
Martine Cadot*
LORIA Campus Scientifique,
BP 239-54506 Vandoeuvre-lès-Nancy Cedex, France and
UHP Campus Scientifique,
BP 239-54506 Vandoeuvre-lès-Nancy Cedex, France E-mail: [email protected]
*Corresponding author
Abstract: In the domain of data-stream clustering, e.g., dynamic text mining as our application domain, our goal is two-fold and a long term one:
1 at each data input, the resulting cluster structure has to be unique, independent of the order the input vectors are presented
2 this structure has to be meaningful for an expert, e.g., not composed of a huge ‘catch-all’ cluster in a cloud of tiny specific ones, as is often the case with large sparse data tables.
The first preliminary condition is satisfied by our Germen density-mode seeking algorithm, but the relevance of the clusters vis-à-vis expert judgment relies on the definition of a data density, relying itself on the type of graph chosen for embedding the similarities between text inputs. Having already demonstrated the dynamic behaviour of Germen algorithm, we focus here on appending a Monte-Carlo method for extracting statistically valid inter-text links, which looks promising applied both to an excerpt of the Pascal bibliographic database, and to the Reuters-RCV1 news test collection. Though not being a central issue here, the time complexity of our algorithms is eventually discussed.
Keywords: data-stream clustering; text mining; incremental algorithm; randomisation test; density mode clustering; graph validation; data mining.
Reference to this paper should be made as follows: Cuxac, P., Lelu, A. and Cadot, M. (2011) ‘Paving the way for next generation data-stream clustering: towards a unique and statistically valid cluster structure at any time step’,
Int. J. Data Mining, Modelling and Management, Vol. 3, No. 4, pp.341–360.
Biographical notes: Pascal Cuxac is a Research Engineer at the INIST/CNRS (Institute for Scientific and Technical Information/National Center for Scientific Research) in Nancy, France. He obtained his PhD in Geological and Mining Engineering from the Nancy School of Geology in 1991 and he is working on mechanical behaviour of anisotropic rock. In 1993, he joined the CNRS as a Research Engineer. In INIST Research and Development Engineering Service, he takes part in research program on classification methods for bibliographic corpus, in particular in the development of an incremental unsupervised classification algorithm.
Alain Lelu received his PhD in Statistics from the Paris 6 University and teaches information science in several French universities. He is now an Associate Professor at the LORIA laboratory, Nancy, France. He has published mainly on neural models and clustering methods applied to information science and text mining. His current research interests include robust and graph-based methods for data mining and recommender systems.
Martine Cadot received her MS in Mathematics, and in Economics from the University of Dijon, France, and PhD in Computer Science from the University of Besançon. She teaches mathematics, statistics and computer science. Her current courses take place at Nancy 1 University, CS Department, and she is a Researcher in the LORIA laboratory, Nancy, France. Her current research interests are in machine learning, robust data mining, variables interaction modeling, and large scale randomisation tests.
1 Introduction
In the field of analysis of scientific and technical information (Suerdem and Karabekir, 2010), tracking how a particular scientific field evolves thematically remains a major subject for study. Let us first consider the interest of taking the time factor into account for a clustering task. Amongst other things, clustering (or unsupervised classification) makes up data groups without requiring prior knowledge. If these data groups are scientific publications as in the case we propose to study and if we consider the corpus of bibliographic records taken as our starting point is representative of a given field, then the clusters can be viewed as research themes in that field of study. The classification that is obtained gives an overview of the scientific field being studied but this overview is static insofar as it is a ‘picture’ at one given moment. Obviously different classifications can be made at different moments but then the problem is how to efficiently differentiate, when considering the two sets of classification results, between real changes and representational artefacts caused by the method. Indeed, this issue is not the major concern of today’s data stream clustering methods, as these are primarily focused on
saving storage space when processing huge data flows. Taking the time parameter directly into account when defining the method of clustering means that we can
1 evaluate the evolution and changes in a given scientific field 2 detect novelty in such a data flow.
Of course this permits the clustering of any continuous data flow (news reports, speech recognition, image analysis, web, etc.) or multiple time series analysis.
First however we shall define what we mean by an ‘incremental algorithm’. The word ‘incremental’ is often associated with terms like ‘dynamic, adaptive, interactive, online, batch, etc.’ Memmi (2001) uses the expression incremental (or dynamic) algorithm ‘when new data can be processed without having to reconsider all of the data. The algorithm will be completely incremental if it updates previous results if necessary’. He also adds an important remark namely that “the data needs to be in the form of a vector within the same vector space. If the dimensions of that space are modified, the problem becomes more complicated”.
Mfoumoune (1998) defines an incremental algorithm as corresponding to the three following points:
• that it should be possible to apply it without prior knowledge of all the elements to be classified
• the classification of a new element should be carried out without intensive usage being made of elements that have already been classified (otherwise all methods become incremental in adding the new element to the original set and re-applying the method to the whole set)
• the result should be available after the new element has been inserted.
To complete this definition, we will add a wish list we consider that a fully satisfactory unsupervised and incremental classification should fulfil in the long term:
• stable representations which are independent of the order data are entered and of the initial conditions
• grouped vectors: it should ‘self-adapt’ to the considerable density differences noted in the spaces of descriptors
• possibility of overlapping clusters
• open descriptive universe: the appearance of new descriptors at t+1 must not modify the vector structure that existed at t
• it should extract very small clusters, even isolated individual elements: ‘the core of future clusters?’
• it should have the minimum number of parameters.
We will present first a state of the art, showing that no method fulfils, to our knowledge, the ambitious wish list we have set out. In Section 3 we will recall our rigorous incremental clustering method Germen, which relies on the local updating of an inter-document similarity graph at each time step, i.e., when a new document-vector is processed. We will develop two methods for defining such a graph: a classical method that we have used so far, that has proved disappointing on real-world datasets,
which consists in linking each text document to its k-nearest neighbours (KNNs); and our novel Monte Carlo method for identifying statistically valid links by a randomisation test. In Sections 4 and 5, we will show the clear superiority of the latter, whether from a qualitative standpoint of intelligibility by an expert, or from the quantitative standpoint of a more balanced distribution of documents in the clusters, as far as our own bibliographic dataset is concerned; and concerning our chosen Reuters’ test corpus, it is to be noted that our agreement measure between the Reuters’ categories of document pairs and their link structure was good, despite the problematic interpretability of each cluster, a consequence of the poor indexing quality available in this newswire corpus.
We will not present examples of dynamic evolution of these real-world corpora, as visually representing numerous document flows in a complex lattice of clusters – loosing/gaining documents, splitting, merging or emerging – is a difficult representation problem, standing out as a man-machine interface issue and quite distinct from the one addressed here, an issue that will be tackled per se in a future paper. Though time and space efficiency are not the points we intend to challenge against other algorithms at the present time, we will briefly evoke and discuss them: recall that we want a unique and intelligible cluster structure for a given document set, whatever the order of the documents and independent from any initial conditions, a strong condition not even satisfied by most of the static batch clustering methods.
2 State of the art
When discussing incremental clustering and data flows, it is impossible to ignore the subject of Datastream even if our data and main concerns are different.
2.1 A quick overview
Data Stream Mining has been has been an active research field in the USA since the end of the 1990s but remains in its starting phase in France. Its aim is to process data flows whose limits may be infinite (e.g., electricity consumption profiles) in one go. “Obtaining access to entire data sets can become a problem, if not actually impossible. Access to data is strictly sequential and the amount of memory available is very much inferior to the volume of data from the flow” (Hébrail et al., 2007).
In the USA, the TDT research programme (topic detection and tracking) set up by the Defense Advanced Research Projects Agency (DARPA) in 1996 led to the development of event detection technologies (Wayne, 1998) which focus on computing efficiency in processing flows of tens or hundreds of thousands of news reports or records from data archives or the internet. The methods developed permit the detection of broad trends from large data flows (Wan et al., 2009) but nonetheless are not reliable for detecting more subtle trends or ‘weak signals’.
Cahlik (2000) compared clustering results obtained at different periods in time. The analysis based on co-words and on co-citations was carried out using the Lexidyn programme; he obtained a method for visualising results which shows the way clusters evolved. However this approach remains relatively rudimentary, difficult to interpret and based on a straightforward document count.
2.1.1 Adapting methods with mobile centres to incrementality
Partitional methods which use aggregation around shifting centres, such as K-means and their many variants, are part of a family based on the optimisation of an overall numerical indicator of the quality of the partition (Yu et al., 2010), in which methods involving mixtures of explicit probabilistic laws are included, which uses the EM (Expectation Maximisation) procedure – for a review see Buntine (2002). The problem of optimisation is NP-hard, they can only be made to converge towards a local optimum which depends on their initialisation (for example the initial positions of centres randomly generated or picked out from the data) or on the order of the data. This disqualified them because we set the proviso that the results should be independent from the initial conditions – our method of axial K-means (Lelu, 1994) is part of this family; the local optima for a given number of clusters mostly reveal the same main clusters which are often trivial but can also make the most interesting ones of average or low size appear/disappear/amalgamate or split. Quite a lot of incremental variants of these methods have been proposed (Binztock and Gallinari, 2002; Chen et al., 2003) and a partial review of these can be found in Lin et al. (2004). Many come from the DARPA-TDT research programme such as Gaudin and Nicoloyannis (2005), Gaber et al. (2005). The characteristics of these methods which make them incompatible with our criteria are
1 it is necessary to define the number of clusters in advance 2 their level of sensitivity to initialisation seeds
3 they are unable to detect ‘emerging trends’. 2.1.2 Neural models
Incremental variants of neural models such as ART, CLASSPHERES, IGNG (Aguilar and Ross, 1994; Puzenat, 1995; Prudent and Ennaji, 2004) have been developed. Problems have occurred however linked to initialisation, to their high number of parameters and calculation time. According to Memmi (2001) these are adaptations of neural models rather than real incremental methods. Nonetheless we will discuss those methods based on growing neural gas (GNG) later in this paper.
2.1.3 Hierarchical clustering
A few hierarchical methods such as JERARTOP, COBWEB or CURE (Pons-Porrata, 2004; Fisher, 1987; Guha et al., 1998) are well-adapted to incrementality. These are divisive or agglomerative methods which are often user-friendly and efficient and which results are independent of the order of presentation of the data and of the initial conditions. However they lack robustness when faced with minor disturbances due to similar distances between data-vectors - and, given the quality of the partitions obtained at a given level of the tree, there tends to be a consensus view that prefers to them methods based on mobile centres (Lebart et al., 1982).
2.2 Most promising methods
Our overview study leads us to conclude that biomimetic methods, density methods and those methods based on GNG are eligible to become incremental.
2.2.1 Biomimetic algorithms
We place in this category evolutionary algorithms (genetic algorithms, evolution strategies etc.), intelligent swarms (Swarm intelligence: clouds of flying insects, artificial ants, etc.) and immune systems (Lee and Antonsson, 2000; Monmarché et al., 2001).
Azzag points out that “very few incremental biomimetic methods exist even though incrementality is possible in many algorithms. The main advantage of some of these methods (ants, swarm, SI) is that they can provide simultaneously a clustering and a means of visualising of that clustering” (Azzag et al., 2004).
Until now, cellular automata have not really been used to a great extent for clustering. Azzag et al. (2005) and Lavergne et al. (2007) propose an algorithm which uses them to solve a clustering problem, the aim being to obtain a ‘visual’ result permitting direct exploration of the clusters and possibly to visualise other information (images). This algorithm must be modified to make the clustering overlapping, incremental, and unique whatever the initial conditions.
2.2.2 Neural models
GNG also seems a possible solution for our problem. The main idea behind this method is to successively add new neurons to a network that is initially made up of two connected neurons, thanks to a local analysis of an ‘error’ parameter generated by the preceding data.
This network is characterised by dynamic management of the neurons, based on a competitive principle which adds or deletes neurons and connections. However initialisation remains random. We are thus faced with a ‘plasticity/stability’ dilemma – can a GNG network learn new data without using the data it learnt before and without deterioration of the network that has already been generated? An incremental GNG was developed (Prudent and Ennaji, 2004) and improved by Hamza et al. (2008). It allows data to be learnt in parts if the database is too large to be learnt in one go and thus allows the learning process to be restarted even if the data learnt previously is no longer accessible. But the uniqueness of the representation at any time step has not yet been established.
2.2.3 Density methods
These methods define clusters using the notion of the density of a data-cloud. This notion of density involves the proximity of one point to another, the proximity being defined by a distance threshold or a number of the nearest neighbours. Given
1 a multidimensional cloud of points
2 a definition of the density related to each point in that space
3 the value of the scale parameter of this density function (its ‘influence radius’), then the resulting density landscape is unique and perfectly well-defined.
Tremolières (1979) proposed a general ‘percolation’ algorithm which is independent of the definition of density or the type of data involved. It aims to rigorously define cluster nuclei, ambivalent frontier-points and atypical points, and works by progressively lowering the density level starting from the densest point and spreading around the nuclei
which successively appear. Other works in this field use the same principle of finding dense cores, each usually also with a specific definition of density and various types of extensions around dense cores: (Moody, 2001; Guénoche, 2004; Hader and Hamprecht, 2003; Batagelj and Zaversnik, 2002). It should be noted that these methods can be translated in terms of graph partitioning, because defining density implies that neighbouring relations be defined, thus a graph. Density Based Spatial Clustering with Noise (DBSCN), described in Ester et al. (1996) uses a definition of density using two parameters, one of which specifies the threshold at which cores begin to form and then spread. We also need to bear in mind developments such as of Chameleon (Karypis et al., 1999), OPTICS (Ankerst et al., 1999); DENCLUE (Hinneburg and Keim, 1998). These algorithms were not to our knowledge considered in a dynamic perspective of incrementality.
In the field of self-organising protocols for so-called ‘ad-hoc’ radio-communication networks, the theme of incrementality for the dynamic partitioning of evolving graphs has been dealt with more directly (e.g., Mitton et al., 2005) though with different application aims from our own. In these protocols, the locational neighbourhoods may fluctuate at each time step, without necessarily including entrances or exits from the network, and the aim is to achieve a relative stability of the composition of the clusters (these are crisp partitions) and stabilise the identity of the nuclei (clusterheads) rather than to attain optimality. Here we are interested by the principle of a completely distributed algorithm for which the knowledge each unit to be classified has of its neighbours and its neighbours’ neighbours (2-neighbourhood) at time t is sufficient to permit the definition of the existence and distribution of the resulting clusters at any moment.
3 Our solution: the GERMEN algorithm
We have worked out the principle of density methods and developed an algorithm named GERMEN (Lelu et al., 2006). The underlying principle of this method is to localise the ‘mounds’ in the density landscape of the data at each moment t and then to identify any local disturbances in this landscape caused by any document that comes at time t + 1, along with all resulting modifications of the cluster borders.
The documents to be classified are described by their keywords and are organised in the form of a graph where each node represents a document and where the edges represent the links between documents. The way this graph is partitioned can be viewed 1 as spotting the main nuclei nodes, the ‘clusterheads’, which are locally denser than
their surroundings
2 as the extension of their zone of influence by unique or shared linking (simple or multiple ‘heritage’) with their neighbours further and further away.
The way the algorithm runs permits the progressive construction of a structure of data including the following for each node – its density, its clusterhead number(s) and finally the list of its 2-neighbours. This data is updated constantly; when a new document (node) arrives, the changes to the density that are caused in its neighbourhood are calculated along with any changes to the clusterheads that may occur. The pseudo-code of our algorithm is listed below.
In the first phase of our project, we used a bibliographic test corpus from the PASCAL database (http://www.inist.fr). This corpus consists of 1,541 bibliographic records in the field of geotechnics published in 2003 which index documents such as articles, conference papers or theses. We used the manually-entered indexing keywords in the records to carry out the clustering. We tested two different methods for the weighted graph of links between documents – the ‘KNN’ oriented graph and the TourneBool (Cadot, 2006) method resulting in an unoriented graph.
GERMEN pseudo-code
• Initialisation: the first node in the sequence has no link, has a 0 density and is its own clusterhead.
LCC = Ø // LCC is the list of clusterhead lists for each node //
• FOR each new node :
// induced changes for densities: //
• compute its 1- et 2-neighbourhood (income and outcome), and other induced neighbourhood modifications, from which
follows the list LL of the nodes concerned by a link creation / suppr. / modif. • compute its density from its 1-neighbourhood.
• FOR each LL node, and any node in its 1- neighbourhood: - compute the new density value
End FOR
// induced changes for clusterheads: // L = LL
WHILE the list L of nodes akin to change their state is not empty : list LS = Ø
FOR each L node, sorted by decreasing density :
~ apply the rule for clusterhead change according to clusterheads of the inbound denser neighbours (in LCC)
and their densities.
~ if a change occurs:
• update LCC for the current node
• compute the possible overhanged nodes (overhanged by the current node);
• increment the LS list of overhanged nodes. End FOR
L = LS End WHILE end FOR
3.1 KNNs graph
To measure the links, we chose to use the cosine in the distributional space (Lelu, 2003), a measure linked to the Hellinger distance (Domengès and Volle, 1979), between document-vectors Xt normalised by xt:{ }xit →yt:
{
xit/x.t}
, where xt is the sum of thecomponents xit of vector Xt.
Worthwhile characteristics follow, particularly:
• Distributional equivalence (the representation remains unvaried insofar as the fusion of descriptors with the same relative profiles is concerned).
• Incrementality: the normalisation of the document-vectors avoids the arrival of a new document disturbing the similarities that have already been calculated. Also the generally ‘sparse’ nature of these vectors permits the incrementality of the descriptors. The number of dimensions of the descriptor space can increase progressively as new descriptors (terms for example) are found in the documents. • The extension to negative data is straightforward.
The graph of linked documents is constructed using the KNN method where K is set by the user.
3.2 TourneBool randomisation test for pruning the less robust links
In our application, we analyse the documents × keywords Boolean matrix. The link computed between two documents is the number of words that occur in both documents, which is also known as ‘support’. This can be obtained by calculating the dot product between two document-vectors. First of all, the links that exist through pure chance are eliminated by our TourneBool randomisation test (Cadot, 2006; Cadot et al., 2007), then those which are too weak are eliminated by our MIDOVA (Cadot and Lelu, 2010) hierarchical stepwise procedure. TourneBool is a statistical validation algorithm which works on a Boolean data matrix. It first randomly generates several hundred Boolean matrices S-equivalent (i.e., with equal marginal sums) to the data Boolean matrix and then it searches for pairs of data which appear to have a link not due to chance.
Table 1 The contingency table of pair (Di, Dj): N, the total number of keywords; Mij, the support; Mi and Mj, the respective numbers of keywords of documents Di and Dj.
Di Non-Di ∑
Dj a = Mij b = Mj – Mij Mj
Non-Dj c = Mi – Mij d = N + Mij – Mi – Mj N – Mj
∑ Mi N – Mi N
For each pair of documents (Di, Dj) with a non-null Mij support in the original data, we calculated this support in each of the simulated matrices and thus obtained the support distribution for this pair in the event of there being no link. If the reference Mij is higher than 99% of the Mij’s in the distribution then the link is named significative with a risk of less than 1% of being wrong (alpha-risk). The other values are considered as being caused by chance. Once the uninteresting links were eliminated by TourneBool, we filtered the remaining links between documents and kept just the most important ones for
classification. For this, we based our work on the calculation of the MIDOVA indicator. In Table 1, let us consider the following link between two documents, Di and Dj, a gain is determined according to the position of Mij in relation to the ‘null hypothesis value’1 Cij of the [Minf ; Msup] interval, with Minf = a – min(a, c) and Msup = a + min(b, c). Taking
Gij = 2(Mij – Cij) to be the gain value, a zero gain is obtained when Mij is in the median
part of the interval and extreme values are obtained when it is at its limits.
In order to only keep the most significant links, we experimented by using a confidence interval of 99.9% with TourneBool to validate the links.
3.3 Time complexity 3.3.1 Germen main module
Depending on the data, the processing time for the Nth data-vector varies between a maximum of O(N2) and a O(N) minimum, attained beyond N ~ 1,000–5,000; our experience so far shows that, when a new document-vector is introduced then, the ‘disturbed zone’ of the data landscape does not exceed 200 to 500 documents, whatever
N, which induces a roughly constant updating time in this part of the program (the
similarity computation stays O(N)). 3.3.2 TourneBool module
Technically, the experiments described below show that we implemented an adequate scale shift to process text corpora of realistic size. Randomised matrices are generated in time O(n, m, v) and space O(v) where n and m are the numbers of lines and columns of the test matrix, v is its number of non-zero values. This phase is made up of independent processes and can run in parallel in a natural manner. To avoid any problems with memory limits in the following exploitation phase of N matrices (e.g., stocking 100, 200 or 2,000 times v numbers and so forth), we fragmented this phase into independent parallel processes each of which processed a fragment of the (symmetrical) table of the co-occurrences. Processing the Reuters corpus we will describe below (23,000 news reports, 28,000 words) took around two and half days of computing for all these phases which were broken down into three parallel runs on a standard quad-core PC. It should be noted that once the distribution of the words and documents have been stabilised, the TourneBool test can be run without requiring a reiteration of all the simulations, e.g., every 1,000 to 10,000 data-vector inputs.
Of course these performances do not match the requirements for flows of millions data-vectors or more, but they are encouraging for the applications we aim at, like scientometric ones, rarely involving more than tens to hundreds thousands document-vectors.
4 Results obtained using the Geotechnical corpus
4.1 GERMEN runs based on KNN graphs
The results obtained using the K nearest neighbour method to create the graph of links between documents was disappointing. Using a low K value (i.e., 1 to 3), we obtained a very high number of clusters (around 450) in relation to the size of the corpus
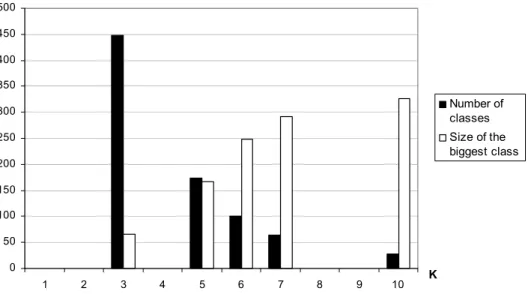
(1,541 documents). When we increased the K value, a chaining effect led to a reduced number of clusters but with a small number of very large ‘catch-all’ clusters (Figure 1).
Figure 1 Histogram of the number of clusters and the size of the biggest cluster using K
0 50 100 150 200 250 300 350 400 450 500 1 2 3 4 5 6 7 8 9 10 K Number of classes Size of the biggest class
Generally we found a lot of small clusters and isolated individual documents. Figure 2 shows the result obtained using K = 3 – there are 448 clusters covering the 1,541 documents and 203 single-unit clusters (those with just one document, 13% of the classified documents). It should be noted that the repartition of data on this oriented graph was obtained by weighting the link between two documents as inversely proportional to the distance calculated between the two documents.
Figure 2 Histogram of the number of clusters sorted by size using K = 3
203 83 39 36 16 16 14 9 4 7 2 5 4 1 1 1 1 1 1 1 1 1 1 0 50 100 150 200 250 1 2 3 4 5 6 7 8 9 10 11 12 13 14 19 20 21 22 23 30 46 62 68 Size of classes N u m b er o f cl ass es
Table 2 shows how the number of links drastically increases when K increases slightly. The total degree for a node (i.e., a document) on the graph may thus be doubled. The expert view is that a number of the very small clusters should be merged and sometimes even merged with bigger clusters. Conversely, the big clusters cover documents with very different subjects.
Table 2 Properties of the two graphs obtained with K-NN
Tied docs Number of links Density (%) Max in degree Min in degree Max out degree Min out degree Max tot. degree Min tot. degree Knn k = 3 1,540 6,407 0.54 48 1 17 3 58 3 Knn k = 7 1,540 19,848 1.67 77 1 51 3 102 4
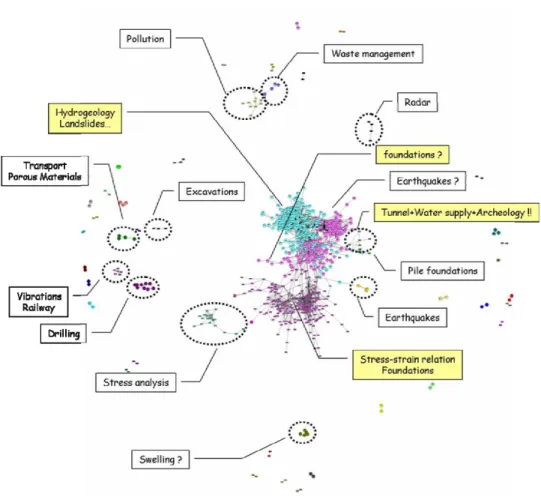
Figure 3 Graph of the links validated using TourneBool and filtered thanks to MIDOVA (see online version for colours)
Notes: The colours and shapes of the nodes indicate the clusters calculated by Germen. The titles in yellow backgrounds indicate poorly defined clusters.
4.2 GERMEN runs based on TourneBool graphs (MIDOVA-weighted)
The results obtained using the TourneBool validation method are promising. Starting with the calculated network of links between documents obtained by this method, we have applied a modified Germen density clustering to process this unoriented graph. The results of the first experiments using this method are encouraging because we found a lot of clusters that were validated by the expert in the field.
For this graph, the weight of the links was simply defined by the proportion between the number of descriptors two documents had in common and the maximum total of possible common descriptors. By varying the filtering threshold and keeping only those links whose value is greater than or equal to this threshold, we can thus obtain cluster structures with varying degrees of granularity.
We also carried out a clustering by attributing a value of 1 to all the links and obtained 4 clusters covering not more than 60% of the documents! This clearly shows how important it is to choose correctly the weights attributed to the links.
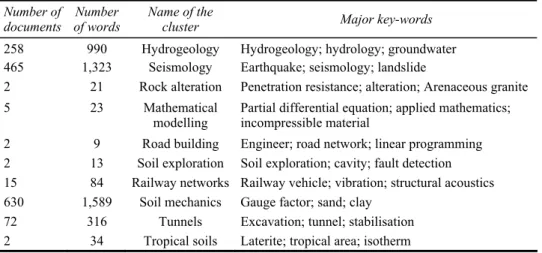
By using the ‘MIDOVA’ method for weighting the links, we obtained more relevant and useful clusters but the larger clusters remained poorly defined (Figure 3). Table 3 compares the number of clusters obtained and the documents in those clusters with two confidence intervals. For a threshold of 1 we obtained ten clusters and missed very few documents. In fact the documents that are not taken into account are those that are alone in a cluster of their own. These ten clusters that can be well interpreted are summed up in Table 4. The main keywords for these clusters are relevant and correspond well to the titles that can be found manually in this kind of corpus. However, again it should be noted that the result is not perfect. For example, there are three very large clusters which it would be better to break down more.
Table 3 Number of clusters and classed documents obtained
With gain ≥ 0 With gain ≥ 1 Confidence
threshold # of clusters # of documents classed # of clusters # of documents classed
99% 3 1,540 3 1,471
99.9% 5 1,526 10 1,453
Table 4 The ten clusters obtained and their three most important keywords
Number of documents
Number of words
Name of the
cluster Major key-words
258 990 Hydrogeology Hydrogeology; hydrology; groundwater 465 1,323 Seismology Earthquake; seismology; landslide 2 21 Rock alteration Penetration resistance; alteration; Arenaceous granite 5 23 Mathematical
modelling
Partial differential equation; applied mathematics; incompressible material
2 9 Road building Engineer; road network; linear programming 2 13 Soil exploration Soil exploration; cavity; fault detection 15 84 Railway networks Railway vehicle; vibration; structural acoustics 630 1,589 Soil mechanics Gauge factor; sand; clay
72 316 Tunnels Excavation; tunnel; stabilisation 2 34 Tropical soils Laterite; tropical area; isotherm
5 Validation test with a public test corpus
The Reuters news agency (Lewis et al., 2004) made several corpora of news reports available for the data mining community to enable the researchers to compare between work carried out and methods employed analysing a common public database. We used the lyrl2004_tokens_train.dat corpus2 of 23,149 news reports pre-lemmatised using the Brill tool in order to concentrate our attention on the exploitation of a published vocabulary without a specific indexing or filtering process which might have affected the results, even if that process might have resulted in higher quality indexing (here the lemmas consist of simple truncations of words, which limits the vocabulary to a few tens of thousands of terms but also leads to many cases of semantic ambiguity for the English words in the general vocabulary and to forms that are hard to understand). Finding multi-word phrases with more univocal meanings was out of the question as well.
After the hapax legomena (words with occurrence of 1 in the whole corpus) had been eliminated, the vocabulary consisted of 28,450 lemmas (from a0 to zywnociowej) with around 75 unique lemmas per news report. The distribution of word occurrences had the usual Zipfian allure (in log-log coordinates: linear decrease), i.e. a power law with an exponent of around –1.5. The distribution of the number of unique words in the news reports showed a clear maximum of around 26 words and was highly unsymmetrical.
Figure 4 Distribution of the cluster sizes at three different threshold values S0, S1, S2, compared to Reuters categories
A point for each class (cluster with S0, S1, S2 threshold, or Reuters category).
1 10 100 1000 10000 C lass S ize S0 S1 S2 REUTERS
Note: Read: threshold S0 induces seven clusters of two elements (marked out), …, one cluster of 1,862 elements.
To decrease computation time, we extracted 2000 documents from those which had more than two Reuters category codes. This was intended to reduce the coverage of the clusters and thus permit easier interpretation of the results. This sub-corpus was found to be indexed by a total of 13,598 words and included 51 category codes. After extraction of valid links using a 99.9% confidence interval, the clustering obtained by Germen gave disappointing results: the overall f-score (the harmonic mean of precision
and recall) was hardly better than the result obtained by picking the clusters by chance. Figure 4 shows the distributions of our cluster sizes. These results were obtained using the TourneBool method and the Germen algorithm with three different thresholds for the links. The distribution of the original Reuters categories is also shown for comparison.
We found the same problems as those explained above – very big clusters and a lot of very small ones. For S2, we obtained 76 clusters and 1,210 clustered documents (around just 60% of the documents). In all our tests, it is difficult to find a comparison between the results and the original partition. We consider the problem stems from the indexation of these records.
This corpus has been used successfully for supervised learning tasks but was thus shown to be unsuited to a clustering task if the standard keywords provided are used. The records would probably require re-indexing but then the problem posed would be to define whether we were evaluating the indexing method or the clustering method, and we preferred to avoid this particular problem. This corpus is most probably suitable for supervised learning tasks because in the vocabulary as a whole there are words of the ‘named entity’ type which the lemmatisation process does not affect to a great extent and which are strongly linked to Reuters’ own categories (companies, products, politicians, sports personalities, places etc.) while the other lemmas happen to be unused without any other damage done.
To conduct a full-scale test for our TourneBool software, we used our TourneBool method to extract the adjacency matrix of the graph of the links between the 28,450 lemmas with a confidence threshold of 99%. This graph was made up of 2.8 million links and its density was 0.0071. In comparison, the density of the matrix of the raw co-occurrences of the words is much higher (0.0406).
For carrying out a comparison with Germen, we tried the WalkTrap3 graph clustering software tool. This program provides a classification tree in ascending hierarchical order which we cut for the maximum value of the quality indicator of the partition (the
modularity). We obtained 21 clusters, 13 of which had more than 55 members and two
clusters with more than 7,000 members, which is a typical power law breakdown. The content of these clusters is surprising – one contains first names, another one gathers names of towns in the UK but nonetheless in all cases they include a mixture of names of places, people and companies with content elements, i.e. from aeronautics, chemistry or computing and so forth… This rather unconvincing result confirms the result we obtained with the GERMEN clustering and the fact that the indexing material provided was not adapted to the task of clustering.
However, we refined our inquiry so as to know whether these disappointing results were uniformly distributed among all the Reuters categories, or specific of a number of them, while correct for others. As each newswire is attributed one or several thematic categories by the Reuters indexers, the distribution of these 101 overlapping categories is very uneven; the most important one (CCAT: corporate = industrial) involves nearly half of the newswires, and the whole corpus is covered by the only top-five categories. These categories help us to assess the relevance of our links. We look for a quantitative confirmation: It should be desirable that a statistically valid link could correspond to at least one common Reuters category at both side of the link. This idea may be approximated by computing the density of valid links for the complete sub-graph (i.e., clique) corresponding to each category.
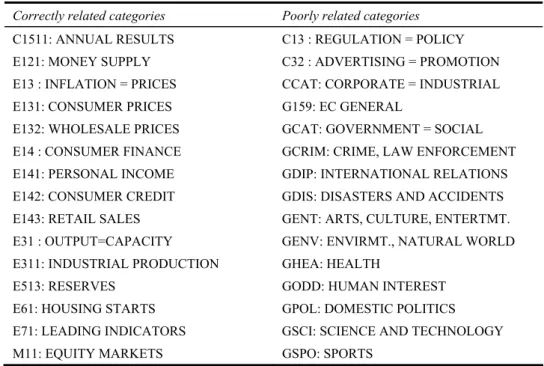
Table 5 The top-15 Reuters categories correctly (left) = poorly (right) accounted for by the valid links between texts
Correctly related categories Poorly related categories
C1511: ANNUAL RESULTS C13 : REGULATION = POLICY E121: MONEY SUPPLY C32 : ADVERTISING = PROMOTION E13 : INFLATION = PRICES CCAT: CORPORATE = INDUSTRIAL E131: CONSUMER PRICES G159: EC GENERAL
E132: WHOLESALE PRICES GCAT: GOVERNMENT = SOCIAL E14 : CONSUMER FINANCE GCRIM: CRIME, LAW ENFORCEMENT E141: PERSONAL INCOME GDIP: INTERNATIONAL RELATIONS E142: CONSUMER CREDIT GDIS: DISASTERS AND ACCIDENTS E143: RETAIL SALES GENT: ARTS, CULTURE, ENTERTMT. E31 : OUTPUT=CAPACITY GENV: ENVIRMT., NATURAL WORLD E311: INDUSTRIAL PRODUCTION GHEA: HEALTH
E513: RESERVES GODD: HUMAN INTEREST E61: HOUSING STARTS GPOL: DOMESTIC POLITICS E71: LEADING INDICATORS GSCI: SCIENCE AND TECHNOLOGY M11: EQUITY MARKETS GSPO: SPORTS
Actually, while the overall density of the valid links graph is 0.04, the link densities exceed this value for the near-entirety of the classes. They even exceed 0.5 in 19 of them. Table 5 shows the title of a few such classes in strong agreement with TourneBool links, and the titles of classes in the opposite case. One can verify that the classes in full agreement involve sharp and factual themes in economics and finance, when classes in low agreement are either large, fuzzy themes, such as Corporate = Industrial, or classes dealing with subjects far from economics and finance, such as arts, health, crime, science, foreign affairs,...We suggest the hypothesis that the words of the general journalistic English language are poorly represented and ambiguous when lemmatised, whereas the specific vocabulary and recurrent named entities of the specialised economic and financial stories are more preserved.
6 Conclusions and future prospects
The present first generation of datastream clustering methods is focused first on space efficiency, second on time efficiency. The next generation will be focused on content issues: is a small cluster, appearing at time t in a bibliographic record flow, a real one, or an artefact? Is cluster X, representative of an important scientific research front, really growing from year t1 to year t2, and decreasing since then?
GERMEN, our incremental clustering method is able to cluster data continually as the data arrives (see Lelu, 2006 for a comparison of two cluster structures at two time steps). We have shown here that the TourneBool method provides a more interesting graph than the simple K-NN graph because TourneBool is based on statistical validation of each link in the overall context of the database. Computing improvements are possible if a large
corpus needs to be processed relatively quickly: moving to a distributed architecture would seem to be the solution (Recall that once the distributions of the words and documents have been stabilised, the TourneBool test can be run without requiring a frequent reiteration of all the simulations).
We have also seen that the value of the links has a very important influence on the result of the clustering. In-depth study needs to be made of different weighting methods and these will be tested on our corpus with the results submitted for expert validation. Detailed study of the inheritance rules is also required because once the clusterhead is defined, these rules spread the cluster to cover other documents, using the clusterhead as a starting-point.
In our experiences, the content of the Geotechnics corpus test was well mastered and the expert in the field was able to rapidly define whether the data classification was relevant and well-adapted or not. However it is more convincing to carry out tests on public test corpora which are used by the scientific community. As the Reuters corpus did not suit the wholeness of our requirements (being more suited to supervised learning), for our following work we will look for better adapted data sets. Nevertheless, we could check that the texts’ link graph was in global agreement with the Reuters’ predefined categories, with an excellent agreement for about 20% of them, i.e. the most factual and specific ones. We also plan to make our geotechnical corpus publicly available along with a less specialised corpus covering the whole research activities in the Lorraine region of France which we are beginning to study.
One of our aims is to be able to detect weak signals and observe their behaviour over a period of time. In the results presented above (Table 2), we noted 4 very small clusters which still have a meaning within the overall obtained classification. However we would need to move into ‘dynamic’ mode to verify whether this result may be an interesting clue for future processing. As the corpus is relatively small, it is currently impossible to make a definite conclusion on this as things stand.
Our future work will be broken down into two phases:
• to continue static iterations of our assessment/correction loop on new corpora while testing other variants of our GERMEN clustering method, in order to reach not only a unique representation at each time step, which is the case today, but also a 100% satisfactory and interpretable one, with balanced reasonable clusters.
• to carry out dynamic tests, above all conditioned by ergonomic and design problems of visual presentation of the ‘evolution tracks’ (cluster births or mergers, deleted clusters, shifting borders etc.): Humbert et al. (2007).
References
Aguilar, J.M. and Ross, W.D. (1994) ‘Incremental ART: a neural network system for recognition by incremental feature extraction’, Proceedings of the World Congress on Neural Networks (WCNN-94).
Ankerst, M., Breunig M.M., Kriegel, H.P. and Sander, J. (1999) ‘OPTICS: ordering points to identify the clustering structure’, Proceedings of the ACM SIGMOD’99 Int. Conf. on
Management of Data, Philadelphia PA.
Azzag, H., Picarougne, F., Guinot, C. and Venturini, G. (2004) ‘Un survol des algorithmes biomimétiques pour la classification’, Revue des Nouvelles Technologies de l’Information
Azzag, H., Picarougne, F., Guinot, C. and Venturini, G. (2005) ‘Classification de données par automate cellulaire’, 12èmes Rencontres de la Société Francophone de Classification
(SFC2005), pp.47–50, Montréal, Canada.
Batagelj, V. and Zaversnik, M. (2002) An o(m) Algorithm for Cores Decomposition of Networks, Vol. 40, pp.798–806, University of Ljubljana, preprint series.
Binztock, H. and Gallinari, P. (2002) ‘Un algorithme en ligne pour la détection de nouveauté dans un flux de documents’, in Morin, A. and Sébillot, P. (Eds.): JADT’2002, IRISA, Saint Malo. Buntine, W.L. (2002) ‘Variational extensions to EM and multinomial PCA’, ECML 2002,
pp.23–34.
Cadot, M. (2006) Extraire et Valider les Relations Complexes en Sciences Humaines: Statistique,
Motifs et Règles d’Association, PhD thesis, Université de Franche-Comté, Besançon, France.
Cadot, M., Cuxac, P. and Lelu, A. (2007) ‘Random simulations of a datatable for efficiently mining reliable and non-redundant itemsets’, ASMDA2007 Conference (International Conference on
Applied Stochastic Models and Data Analysis), Chania, Greece.
Cadot, M. and Lelu, A. (2010) ‘A novel decomposition algorithm for binary datatables: encouraging results on discrimination tasks’, in Proceedings RCIS 2010 – Fourth
International Conference on Research Challenges in Information Science, Nice, France
Cahlik, T. (2000) ‘Comparison of the maps of science’, Scientometrics, Vol. 19, No. 3, pp.373–387.
Chen, C.C., Chen, Y.T., Sun, Y.S. and Chen, M.C. (2003) ‘Life cycle modeling of news events using aging theory’, ECML 2003, pp.47–59.
Domengès, D. and Volle, M. (1979) ‘Analyse factorielle sphérique: une exploration’, Annales de
l’INSEE, Vol.35, pp.3–84, INSEE, Paris.
Ester, M., Kriegel, H-P., Sander, J. and Xu, X. (1996) ‘A density-based algorithm for discovering clusters in large spatial databases with noise’, Proc. 2nd Int. Conf. on Knowledge Discovery
and Data Mining (KDD’96), pp.226–231, AAAI Press, Menlo Park, CA.
Fisher, D. (1987) ‘Knowledge acquisition via incremental conceptual clustering’, Machine
Learning, Vol. 2, pp.139–172.
Gaber, M., Zaslavsky, A. and Krishnaswamy, S. (2005) ‘Mining data streams: a review’, SIGMOD
Record, Vol. 34, p.2.
Gaudin, R. and Nicoloyannis, N. (2005) ‘Apprentissage non-supervise de séries temporelles à l’aide des k-Means et d’une nouvelle méthode d’agrégation de séries’, 5èmes journées
d’Extraction et Gestion des Connaissances (EGC 2005), pp.201–212, pp.19–21, Janvier,
Paris.
Guénoche, A. (2004) ‘Clustering by vertex density in a graph’, in Mining, D. and Banks et al. (Eds.): Meeting of the International Federation of the Classification Societies, pp.15–23, Classification, Clustering and Data, Springer, Chicago.
Guha, S., Rastogi, R. and Shim, K. (1998) ‘CURE: an efficient clustering algorithm for large databases’, Proceedings of the ACM SIGMOD International Conference on Management of
Data, pp.73–84, New York.
Hader, S. and Hamprecht F.A. (2003) ‘Efficient density clustering using basin spanning trees’,
Between Data Science and Applied Data Analysis, pp.39–48, Springer.
Hamza, H., Belaïd, Y., Belaïd, A. and Chaudhuri, B.B. (2008) ‘An end-to-end administrative document analysis system’, Eight IAPR International Workshop on Document Analysis
Systems (DAS2008), Nara, Japan.
Hébrail, G., Clérot, F. and Csernel, B. (2007) ‘Atelier Gestion et fouille de flux de données’, EGC
2007, Namur, Belgium.
Hinneburg, A. and Keim, D.A. (1998) ‘An efficient approach to clustering in large multimedia databases with noise’, Proceedings of the 4th International Conference on Knowledge
Humbert, P., François, C., Cuxac, P. and David, A., (2007) ‘La visualisation dynamique de connaissances scientifiques: intégration des besoins des utilisateurs’, Canadian Journal of
Information and Library Science, Vol. 30, Nos. 1/2, pp.38–55.
Karypis, G., Han, E.H. and Kumar, V. (1999) Chameleon: A Hierarchical Clustering Algorithm
using Dynamic Modeling, Technical Report TR-99-007, Department of Computer Science,
University of Minnesota, Minneapolis.
Lavergne, J., Azzag, H., Guinot, C. and Venturini, G. (2007) ‘Construction incrémentale et visualisation de graphes de voisinage par des fourmis artificielles’, 7èmes journées
d’Extraction et Gestion des Connaissances (EGC 2007), Vol. 1, pp.135–146, Namur.
RNTI-E-9 Cépaduès-Éditions 2007.
Lebart, L., Morineau, A. and Tabard, N. (1982) Techniques de la Description Statistique, Dunod, Paris.
Lee, C-Y. and Antonsson, E. (2000) ‘Dynamic partitional clustering using evolution strategies’,
Proceedings of the Third Asia-Pacific Conference on Simulated Evolution and Learning,
Nagoya, Japan.
Lelu, A. (1994) ‘Clusters and factors: neural algorithms for a novel representation of huge and highly multidimensional data sets’, in Diday, E. and Lechevallier, Y. et al. (Eds.): New
Approaches in Classification and Data Analysis, pp.241–248, Springer-Verlag, Berlin.
Lelu, A. (2003) ‘Evaluation de trois mesures de similarité utilisées en sciences de l’information’, in Rostaing, H. (Ed.): Information Sciences for Decision Making, No. 6.
Lelu, A. (2006) ‘Clustering dynamique d’un flot de données: un algorithme incrémental et optimal de détection des maxima de densité’, 8e Journées EGC 2006 (Extraction et Gestion de
Connaissances), Vol. 2, pp.35–40, in RNTI-E6, Cepadues publ., Toulouse, France.
Lelu, A., Cuxac, P. and Johansson, J. (2006) ‘Classification dynamique d’un flux documentaire: une évaluation statique préalable de l’algorithme GERMEN’, Journées internationales
d’Analyse statistique des Données Textuelles (JADT), pp.617–630, Besançon.
Lewis, D.D., Yang, Y., Rose, T. and Li, F. RCV1 (2004) ‘A new benchmark collection for text categorization research’, Journal of Machine Learning Research, Vol. 5, pp.361–397. Lin, J., Vlachos, M., Keogh, E. and Gunopulos, D. (2004) ‘Data mining and knowledge
discovery – Iterative incremental clustering of time series’, Lecture Notes in Computer
Science, Vol. 2992, pp.106–122.
Memmi, D. (2001) ‘Incremental clustering and category drift’, Les cahiers du laboratoire Leibniz, No. 22, France.
Mfoumoune, E. (1998) Les Aspects Algorithmiques de la Classification Ascendante Pyramidale et
Incrémentale, p.220, PhD thesis, Université Paris IX Dauphine (E. DIDAY), France.
Mitton, N., Fleury, E., Guérin-Lassous, I. and Tixeuil, S. (2005) ‘Auto-stabilisation dans les réseaux ad hoc’, 7èmes Rencontres Francophones sur les aspects Algorithmiques des
Télécommunications, ALGOTEL 2005, Presqu’île de Giens, France.
Monmarché, N., Laügt, D., Mestre, M., Labroche, N., Oliver, A. and Venturini, G. (2001) ‘Classification et visualisation dynamique de données par nuage d’insectes volants’,
Neuvièmes rencontres de la Société Francophone de Classification, pp.254–261, Pointe à Pitre
(Guadeloupe).
Moody, J. (2001) ‘Identifying dense clusters in large networks’, Social Networks, Vol. 23, pp.261–283.
Pons-Porrata, A., Berlanga-Llavori, R., Ruiz-Shulcloper, J. and Perez-Martinez, J.M. (2004) ‘JERARTOP: A new topic detection system’, Lecture Notes in Computer Sciences – 9th
Iberoamerican Congress on Pattern Recognition, Vol. 3287, pp.446–453.
Prudent, Y. and Ennaji, A. (2004) ‘Extraction incrémentale de la topologie des Données’, 11èmes
Rencontres de la Société Francophone de Classification, pp.278–281.
Puzenat, D. (1995) Priming an Artificial Neural Classifier, Research report RR-9510, Laboratoire de l’Informatique du Parallélisme, France.
Suerdem, A.K. and Karabekir, K. (2010) ‘Bridging qualitative and quantitative methods for classifying policy actors into policy discourse communities: thematic analysis and formal concept analysis approaches’, International Journal of Data Analysis Techniques and
Strategies, Vol. 2, No. 3, pp.199–216.
Tremolières, R.C. (1979) ‘The percolation method for an efficient grouping of data’, Pattern
Recognition, Vol. 11, No. 4, pp.255–262.
Wan, R., Chen, J., Wang, L. and Su, X. (2009) ‘Grid-based clustering over an evolving data stream’, Int. J. Data Mining, Modelling and Management, Vol. 1, No. 4, pp.393–490.
Wayne, C.L. (1998) ‘Topic detection & tracking (TDT), overview & perspective’, Proceedings of
the DARPA Broadcast News Transcription and Understanding Workshop, Lansdowne,
Virginia.
Yu, L., Gao, L., Wang, D. and Fu, S. (2010) ‘Quantitative function for community structure detection’, Int. J. Data Mining, Modelling and Management, Vol. 2, No. 4, pp.351–368.
Notes
1 Cij = Mi. Mj / N (for more information please refer to Cadot, 2006).
2 Lewis, D. RCV1-v2/LYRL2004: The LYRL2004 Distribution of the RCV1-v2 Text Categorisation Test Collection (12-Apr-2004 Version) available at