Premade versus in situ formed compatibilizer at the PS/PMMA interface:
contribution of the Raman confocal microscopy to the fracture analysis
C. Koulica, Z. Yina, C. Pagnoullea, B. Gilbertb and R. Jérômea
a
Center for Education and Research on Macromolecules (CERM), University of Liège, Sart-Tilman, B6, 4000 Liège, Belgium
b
Laboratory of Analytical Chemistry and Electrochemistry, University of Liège, Sart-Tilman, B6, 4000 Liège, Belgium
Abstract
The interface of a two-layer assembly of polystyrene (PS) and poly(methyl methacrylate) (PMMA) was modified by an intermediate layer of either a premade poly(styrene-g-methyl methacrylate) copolymer (P(S-g-MMA)) or a preblend of mutually reactive PS and PMMA synthesized by atom transfer radical polymerization (ATRP). No significant difference was found in the interfacial fracture toughness measured by the double cantilever beam test, although the morphology of the interfacial region was not the same when observed by transmission electron microscopy. The premade copolymer formed a distinct interphase, in contrast to the sharp interface that was observed in the case of the reactive system. The analysis of the fracture surfaces by Raman confocal microscopy showed that the fracture occurred alternatively in the PS phase and either at the PS/copolymer interface for the non reactive system or at the PS/PMMA interface for the reactive one.
Keywords: Polymer blends; Adhesion; Raman microscopy 1. Introduction
Blending of polymers is a powerful strategy to prepare materials with an improved property/cost balance. However, most polymer blends are phase-separated, the phase morphology is unstable upon further processing and shaping, and the interfacial adhesion being poor, so are the mechanical performances. The origin of these disappointing observations has to be found in the interface, that must be modified in order to decrease the interfacial tension, to inhibit the phase coalescence and to strengthen the interfacial adhesion [1]. This "compatibilization" requires the addition of block [2], graft [3], tapered [4] or even random copolymer [5-6] that can be pre-made or, better, formed in situ, in a so-called reactive process [7]. The key point is that the copolymer organizes itself at the interface with formation of molecular "reinforcing connectors", i.e. chain entanglements of the constituent segments within the parent phases [8]. Several research groups investigated the strengthening capability of premade copolymers with different molecular characteristic features by the double cantilever beam method [8], the main experimental variables being the areal chain density of the copolymer chains [8-9], the annealing temperature [8-9], and the thickness ratio of the polymer sheets [10]. Attention was also paid to the locus of fracture, that was observed by experimental techniques such as secondary ions mass spectrometry (SIMS) [9] and forward recoil electron spectroscopy (FRES) [8]. The strengthening of the interfacial adhesion was also studied by formation of the compatibilizer at the interface as result of the coupling of polymer chains bearing mutually reactive groups. The experimental conditions for the implementation of the coupling reaction were modified [11-12], and additional experimental techniques, such as ellipsometry, were used [13].
The purpose of this study is to compare the compatibilization of the interface by a graft copolymer, premade and formed in situ, respectively. A PS/PMMA two-layer assembly will be analyzed as a model, and characterized by the dual cantilever beam test. The graft copolymer will be formed, in situ or not, by coupling mutually reactive precursors prepared by controlled radical polymerization, i.e. random copolymers of styrene and m-isopropenyl-α, α-dimethylbenzyl isocyanate (m-TMI, Scheme 1) (P(S-co-TMI)) and α-hydroxy PMMA (PMMA-OH). Compared to previous studies, the controlled synthesis of reactive PS and PMMA of well-defined molecular weight and low polydispersity by atom
transfer radical polymerization (ATRP) is thought to be a substantial improvement. Attention will be paid to the interfacial adhesion toughness and the locus of fracture. The fracture surfaces will be observed by Raman confocal microscopy which is a much more flexible technique than SIMS [9] and FRES [8], because no deuteration of the compatibilizer is required. It gives also more detailed
information than the attenuated total reflectance ATR FTIR spectroscopy [10].
Scheme 1. 2. Experimental
2.1. Materials
Monomers (methyl methacrylate (MMA) and styrene (Sty), supplied by Aldrich) were dried over CaH2, distilled under reduced pressure and stored under N2 at −20°C. Toluene was refluxed over CaH2
and distilled prior to use. CuBr was purified as reported in the scientific literature [14]. It was stored under N2 and weighed in the open air prior to polymerization. Solutions of the as-received
1-phenylethyl bromide (1-PEBr, from Aldrich) (0.22 M), of 1,1,4,7,10,10-hexamethyldiethylenetriamine (HMTETA, from Aldrich) (0.37 M) and of 2-hydroxyethyl 2′-methyl-2′-bromopropionate (synthesized as described later on) (0.33 M) were prepared in anhydrous toluene, degassed by the bubbling of N2,
and stored under N2 at −20°C. m-TMI (m-isopropenyl-α, α-dimethylbenzyl isocyanate) was eluted
over alumina, degassed by the bubbling of N2, and stored under N2 at −20°C. PS used in this work was
the Polystyrol 158 K from BASF, and PMMA was the Diakon from ICI.
2.2. Synthesis of 2-hydroxyethyl 2′-methyl-2′-bromopropionate [15]
This hydroxy containing initiator for the ATRP of MMA was synthesized as follows (Scheme 2, Synthesis of 2-hydroxyethyl 2′-methyl-2′bromopropionate): Bromoisobutyryl bromide was added dropwise into cold anhydrous ethylene glycol (dried over MgSO4 and distilled under reduced pressure)
at 0°C under stirring. The ethylene glycol/bromoisobutyryl bromide molar ratio was 25. The reaction mixture was then added to deionized water, and the reaction product was extracted by chloroform. The organic solution was washed with a sodium hydrogenocarbonate aqueous solution, and then dried over magnesium sulfate. After solvent removal, a colorless liquid was recovered and vacuum distilled. It was characterized by GC and 1H NMR (CDCl3, RT, 250MHz) (4.30 (t, 2H), 3.85 (t, 2H), 1.94 (s, 6H)).
Scheme 2.
2.3. Polymer synthesis
A major purpose of this work being to compare the non reactive and the reactive compatibilization of the model PS/PMMA interface, it was essential to prepare graft copolymers with the same structure not only at the interface (reactive compatibilization) but also independently of it (non reactive compatibilization). The coupling of premade multifunctional PS backbone and end-reactive PMMA chains was therefore an appropriate strategy for the synthesis of the graft compatibilizer. The addition
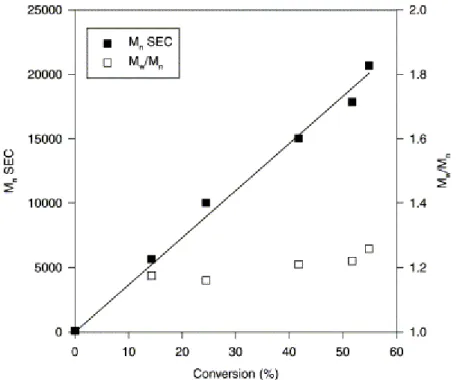
of an alcohol to an isocyanate with formation of urethane was selected as the coupling reaction, and the PS and PMMA precursors were synthesized with controlled molecular weight and narrow polydispersity by atom transfer radical polymerization (ATRP). All the polymerizations were conducted according to the Schlenk method. In a typical experiment, the solid ingredient (CuBr catalyst) and a magnetic bar were added into a glass tube, that was closed by a three-way stopcock and placed under nitrogen by repeated vacuum/nitrogen cycles. The liquid reagents were then added under nitrogen with a syringe in the following order: ligand, monomer, initiator. Random copolymers of styrene and m-isopropenyl-α, α-dimethylbenzyl isocyanate (m-TMI) [(P(S-co-TMI)] were synthesized by atom transfer radical polymerization (ATRP) in toluene at 110°C, the CuBr/HMTETA/PEBr being the catalytic system [16]. Copolymerization of styrene with m-TMI (Scheme 1) was a direct way to attach isocyanate groups to the polystyrene backbone. m-TMI did not homopolymerize in the presence of radicals at 110°C because of a low ceiling temperature [17]. The ATRP of a comonomer feed containing 10 wt% of m-TMI showed that Mn of the copolymer measured by SEC increased linearly
with the comonomer conversion, at least until conversion of 60% (Fig. 1). The polydispersity was narrow (<1.3) and the m-TMI content of the copolymer was lower than the original value of the comonomer feed (at partial conversions), which indicated that m-TMI was less reactive than styrene at 110°C. A detailed analysis of the copolymerization reaction will be reported in a forthcoming paper [18]. Nevertheless, it was essential to check that the distribution of the m-TMI co-units in the copolymer chains is independent of the molecular weight, otherwise the structure of the final
copolymer would not be homogeneous. A P(S-co-TMI) sample (Mn=42000, Mw/Mn=1.3, m-TMI=2.2
mol%) was analyzed by SEC equipped with a dual detector (UV detection at 366 nm and differential refractometer). It was previously reacted with 9-(methylaminomethyl)anthracene (λmax: 366 nm,
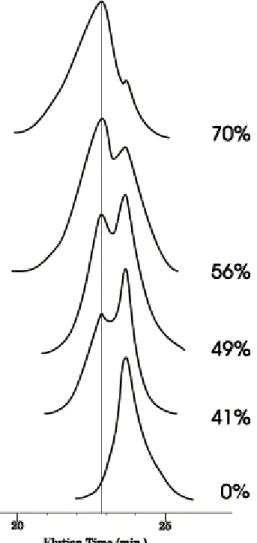
Scheme 3, 9-(methylaminomethyl)anthracene used for the analysis of the isocyanate co-units by UV) [19]. The reaction was found to be quantitative through the disappearance of the absorption peak of the isocyanate at 2250 cm−1 in IR. It was ascertained that the absorption by the unlabelled copolymer at 366 nm was negligible. As shown by Fig. 2, the overlap of the SEC traces recorded by UV at 366 nm and by the refractive index detector was very good. The systematic shift by 0.2 min resulted from the series connection of the two detectors. The m-TMI distribution in the copolymer chains was thus homogeneous.
Fig. 1. Dependence of Mn (SEC) on the conversion of the styrene/m-TMI comonomer feed.
Scheme 3.
Fig. 2. Comparison of the SEC chromatograms of P(S-co-TMI) recorded by the UV detector at 366 nm (dashed line) and by the refractive index detector (solid line).
α-hydroxy PMMA was prepared by ATRP in toluene at 85°C initiated by 2-hydroxyethyl 2′-methyl-2′-bromopropionate and catalyzed by the CuBr/HMTETA system [15]. The polymer was recovered by precipitation in methanol and dried under vacuum. Mn (SEC) increased linearly with conversion at
least up to 70% (Fig. 3). The polydispersity index remained low, although it increased slightly with the conversion, as the result of a tailing on the low molecular weight side of the SEC chromatogram (Fig. 4). Moreover, a shoulder was observed on the high molecular weight side of the SEC chromatogram. Because the purity of the initiator was confirmed by GC analysis, this shoulder could not result from initiation by a contaminating difunctional molecule. An explanation might be a transesterification reaction between the hydroxyl containing α-ester end-group of the chains (Scheme 4, Side-reaction pathway accounting for the coupling peak observed on Fig. 4). This side reaction would be of a limited extent, thus without deleterious effect on the polymerization control.
Fig. 3. Dependence of Mn (SEC) on conversion of MMA. [MMA]0=3 M;
[2-OH-2′(MP)Br]0=[CuBr]0=[HMTETA]0=7 mM; toluene; T=85°C.
Scheme 4.
The graft copolymer was prepared by reaction of PS-co-TMI (Mn=47000, Mw/Mn=1.3, TMI=2.2
mol%) with PMMA-OH (Mn=48000, Mw/Mn=1.1) in a 1/1 wt ratio in anhydrous toluene
([PS]=[PMMA]=10 wt%, [NCO]/[OH]=10) in the presence of dibutyl tin dilaurate (DBTDL)
(0.15 mol% with respect to NCO) under inert atmosphere at 40°C for 5 h. SEC analysis of the course of the coupling reaction (UV detection, 254 nm) showed a twofold increase in molecular weight for the coupling product (Fig. 5). The peak attributed to the PS precursor decreased in favor of the peak characteristic of the PS content of the graft copolymer with a molecular weight consistent with the average grafting of one PMMA chain on the PS backbone (the broadening of the peak with reaction time was related to multiple grafting of PMMA chains onto PS). The crude reaction product used in this study contained 82 wt% of copolymer chains and 18 wt% of unreacted precursors as determined by SEC using the method (UV detector) described by Macoscko et al. [24]. Because PMMA is invisible at 254 nm, the area under the curve was proportional to the amount of polystyrene including the graft copolymer. Therefore, the percentage of polystyrene chains grafted was calculated as: AREAhighMW/(AREAlowMW+AREAhighMW)×100%. The reaction product was precipitated in methanol,
Fig. 5. Time evolution of the SEC trace of the mixture of the reactive polymers.
2.4. Characterization
Molecular weight and molecular weight distribution were analyzed by SEC (Size Exclusion
Chromatography calibrated with PS or PMMA standards), in THF at 40°C, with a Hewlett–Packard 1090 liquid chromatograph equipped with a Hewlett–Packard 1037A refractive index and a UV detector. Before SEC analysis, the (co)polymers were purified by precipitation in methanol, filtered and dried under vacuum.
MMA and styrene conversion was monitored by 1H NMR. The resonances of the MMA olefinic protons at 5.47 and 6.00 ppm were compared to the resonances of the methyl ester (–OCH3) at
3.6 ppm. The resonances of the styrene olefinic protons at 5.11 and 5.59 ppm were also compared to the PS aliphatic protons observed between 1.1 and 2.5 ppm. 1H NMR spectra were recorded at room temperature in CDCl3 with TMS as internal reference by using a Brucker AM 250 apparatus. FTIR
spectra of films cast on NaCl disk from CH2Cl2 solution were recorded with a Perkin–Elmer 1720 X
spectrometer.
The m-TMI units of the P(S-co-TMI) copolymer were analyzed by FTIR, the absorption of the isocyanate group (NCO) being observed at 2255 cm−1. The m-TMI content was determined by FTIR on the basis of a calibration curve. For this purpose, blends of PS and m-TMI of known weight compositions were dissolved in CH2Cl2 and solvent cast on NaCl disk. The absorption ratio of the
aromatic C=C (at 1601 cm−1) and the isocyanate (at 2255 cm−1), i.e. A1601 cm −1
/A2255 cm −1
versus the styrene/m-TMI wt ratio and agrees with the following equation: A1601cm −1 /A2255cm −1 =0.115+1.13×10⁻² (Sty/m-TMI).
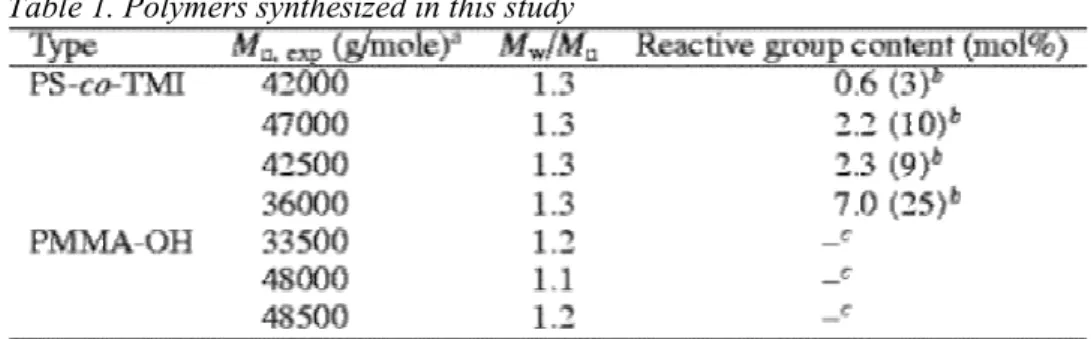
All the polymers synthesized in this study are listed in Table 1. Table 1. Polymers synthesized in this study
2.5. Sandwich assembly
PS and PMMA were compression molded at 200°C into 120×80×1 mm sheets. Toluene solution (2.5 g) of the premade copolymer (10 wt%) was spin-coated (2000 rpm) on the surface of both the PMMA and the PS compression molded sheets, that were then dried under vacuum at 40°C for 5 h, face-to-face assembled and annealed under very low pressure at 200°C for 40 min. Similarly, 2.5 g of a toluene solution of a mixture of the two reactive precursors (10 wt%), was spin-coated (2000 rpm) on the surface of both the PMMA and the PS sheets, that were treated as before. The coupling reaction did not occur significantly at RT.
2.6. Fracture toughness
After annealing, the PS/premade copolymer (or mixture of the reactive precursors)/PMMA sandwich-assembly was cooled down and 1 cm width samples were cut out. The interfacial fracture toughness was measured by the symmetric double cantilever beam test. A razor blade was inserted between the two constituent layers, and the length of the crack propagating ahead of the razor blade was measured. A 5 min equilibration time was used, having checked the stability of the length for 24 h at room temperature. The toughness of the interface (Gc) was calculated from the following equation proposed
by Creton et al. [8]: Gc=((3∆ 2 E1h1 3 E2h2 3 )/(8a4))×((E1h1 3 C2 2 +E2h2 3 C1 2 )/(E1h1 3 C2 3 +E2h2 3 C1 3 )2)
where C1=1+0.64h1/a and C2=1+0.64h2/a. Ei and hi are the elastic modulus and the thickness of the
component i, respectively, ∆ is the thickness of the razor blade, and a is the crack length.
2.7. Phase morphology
It was observed with a Philips CM 100 transmission electron microscope (TEM). A Reichert-Jung Ultracut FC 4 microtome equipped with a diamond knife was used to prepare ultrathin samples (50 nm thick) along the section of the sandwich assemblies at room temperature. PS was observed as the dark phase and PMMA as the white one. Fracture surfaces were also observed by Scanning Electron Microscopy (SEM) with a JEOL JSM-840A microscope (20 kV). Samples were coated by a 25 nm thick layer of Au/Pd alloy.
2.8. Raman confocal microscopy
Raman spectra were recorded with a Dilor "SuperLabram" spectrometer. This instrument was
cooled with liquid nitrogen. The excitation laser was an argon ion laser (Coherent 52B) and the power at the sample level was ca. 25 mW at 514.5 nm. The integration time for most samples was 20 s or less. The use of an objective (×100) and a 200 µm confocal hole allowed layers as thin as 3 µm to be easily distinguished, provided that the spectrograph was properly aligned.
3. Results and discussion
3.1. Interfacial adhesion promoted by premade graft copolymer
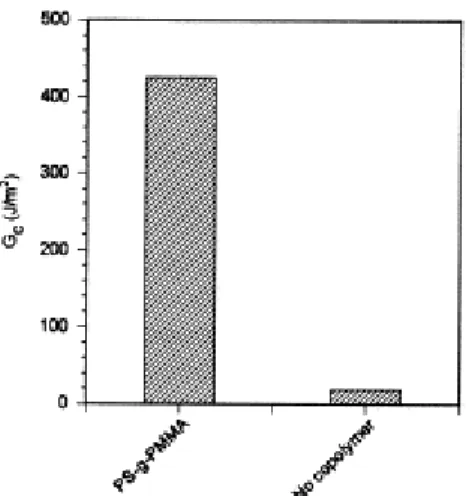
The interface between 1 mm thick-sheets of PS and PMMA was reinforced by a spin coated layer of the PS-g-PMMA copolymer prepared by coupling the two precursors of same molecular weight (50 K) (Section 2). This three-layer sample was annealed at 200°C for 40 min under a slight pressure in order to maintain the sheets in contact. Fig. 6 compares the fracture toughness (Gc) of the modified and
unmodified PS/PMMA interfaces, that was measured by the double cantilever beam test [8]. The fracture toughness for the interface modified by the copolymer is tremendously increased (by more than 20 times) compared to the unmodified interface. Gc is now close to the average value reported for
the cohesive fracture toughness of brittle homopolymers (including PS and PMMA), thus ca. 500 J/m2 [20]. The interfacial fracture toughness is not zero in the absence of compatibilizer. Indeed, statistical thermodynamics predicts that polymer segments can interdiffuse to some extent in order to minimize the interfacial energy [21]. This segmental interdiffusion increases as χ is smaller. For the PS/PMMA pair, χ=0.37 [9] and the experimental fracture toughness is 18 J/m2.
Fig. 6. Fracture toughness for the PS/PMMA interface before and after modification by the P(S-g-MMA) copolymer.
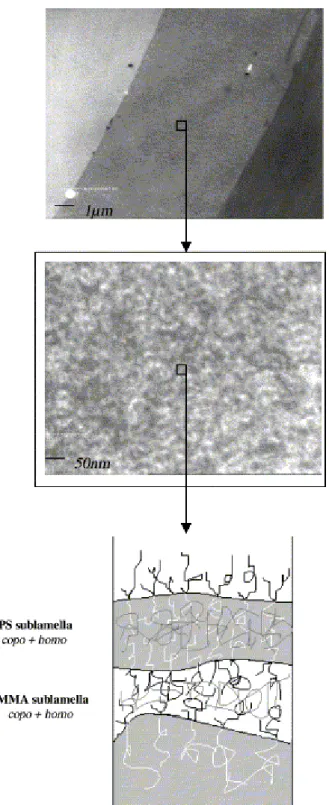
3.2. Mechanism of interfacial adhesion
The copolymer used in this study has a graft architecture and it contains a significant amount of homopolymers. Fig. 7 (top) shows that the copolymer forms an interphase between the two
homopolymers, such that two distinct interfaces are actually observed. Therefore, it is clear that the interfacial toughness does not result from the stitch-like organization of the copolymer at the interface (entanglement of each block of the individual copolymer chains within the parent phase). The
observation of this interphase by TEM shows a disordered lamellar structure (Fig. 7 (middle)), the PS sublamellae being dark and intermingled with the white sublamellae of PMMA. There may be several reasons for the long range disorganization of the lamellae in the interphase. (1) the spin coating technique used for the deposition of the copolymer layer and a too short annealing time, (2) the possibly non uniform distribution of the PMMA graft(s) along the PS backbone, (3) the copolymer contamination by the unreacted precursors, which are expected to swell the sublamellae with formation of "wet" sublamellae (as reported by Macosko et al. [23]). The high fracture toughness imparted by the copolymer to the PS/PMMA interface could result from the poor organization of the
copolymer interphase ( Fig. 7 (bottom)) which may favor chain entanglements in this region and thus the stress transfer across the whole lamella. According to Kramer et al. [22], a highly regular
organization of non contaminated sublamellae has a deleterious effect on the fracture toughness. The question may be addressed to which extent the poorly defined morphology of the interphase
contributes favorably to the interfacial strengthening. Further investigation is necessary to know whether it is better to use copolymers with highly uniform molecular structure and composition and rid of contaminating homopolymers or not.
Fig. 7. TEM observations of the distinct interphase (ca. 7.5 µm) formed by the copolymer layer (top), and of the phase morphology of this interphase (middle). Schematic representation of the interphase (bottom).
3.3. Locus of fracture
The high experimental Gc might indicate that crazing occurs at the crack tip and that the craze
ultimately fails by fibrils breakdown in the interfacial region, which would be the weakest point. Nevertheless, when the interface formed by two homopolymers of distinct elastic modulus (i.e. PS having the lower elastic modulus and thus the lower crazing stress in the PS/PMMA pair [10]) is modified by a copolymer, the locus of the fracture (and thus the fracture toughness) depends on the relative thickness of the two homopolymer layers and on the interfacial area occupied by the
copolymer chains. In order to know where the fracture occurs, the fracture surfaces were analyzed by SEM and Raman confocal microscopy. SEM observation shows plastic deformation which is the signature of a craze failure mechanism. Therefore, the structure of the fracture surfaces is not uniform, as assessed by rough and smooth regions ( Fig. 8).
Fig. 8. SEM observation of the PMMA surface after fracture.
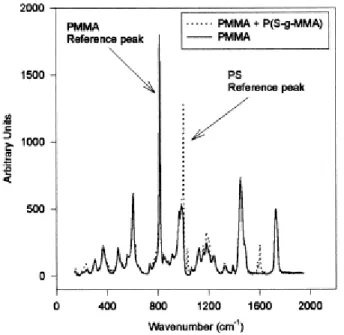
The composition of the PMMA surface after fracture was analyzed by Raman confocal microscopy. In order to make reference spectra available, the premade graft copolymer was spin-coated on the surface of compression molded sheets of PS and PMMA, and the Raman spectrum of these surfaces was recorded. The major scattering peaks of PMMA and PS were observed, and the intensity ratio of the peaks characteristic of PS and PMMA was used as reference (Fig. 9).
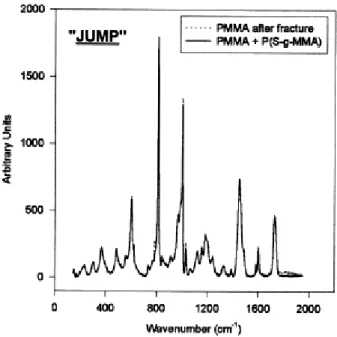
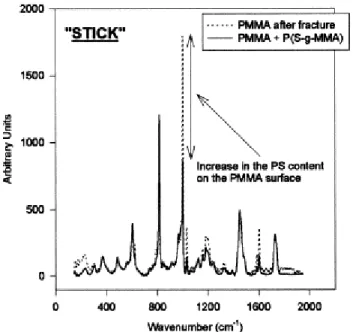
The rough areas will be further referred to as "stick" zones, in contrast to the "jump" smooth zones. The Raman confocal microscope is equipped with an optical camera that allows to select the area to be probed. Whenever a "jump" zone (Fig. 10) is analyzed, the PS content of the PMMA surface is not significantly higher than the reference, so indicating that the fracture is more likely to occur at the PS/copolymer interface. A "stick" zone with the rough morphology shown in Fig. 8, was also analyzed on the PMMA surface. The PS content now largely exceeds the reference value ( Fig. 11), which strongly suggests that the fracture occurs in the PS bulk phase and no longer at the PS/copolymer interface as it is the case for the smooth regions. Moreover, when the fracture surface on the PS side is analyzed by Raman confocal microscopy, no trace of PMMA is detected, which confirms that the fracture propagates within the PS phase or at the PS/copolymer interface. So, the crack occasionally penetrates the homopolymer PS phase, which increases the fracture toughness of the interface. The Raman confocal microscopy was very instrumental in the study of the fracture mechanism of the PS/PMMA interface reinforced by a P(S-gMMA) copolymer. Indeed, it is clear now that the fracture does not occur in the same region, but rather alternatively at the PS/copolymer interface and within the PS phase close to this interface. The crack does not propagate at the same rate as the razor blade, but in a "stick-jump" fashion [10]. For a while, the crack propagates more slowly than the blade, and a band of crazes is formed in front or at the leading edge of the crack ("stick"). When the crack tip passes through the band of crazes, the crack suddenly propagates and gives rise to a jump.
Fig. 10. Superimposition of the Raman spectra of a smooth area on the PMMA surface after fracture and the PMMA surface coated by the P(S-g-MMA) (reference).
Fig. 11. Raman spectra for a rough region of the PMMA surface after fracture, to which the reference of the (PMMA+PS-g-PMMA) surface has been superimposed
3.4. Interfacial adhesion promoted by a mixture of PS-co-TMI and PMMA-OH
In an additional series of experiments, a premixture of P(S-co-TMI) and PMMA-OH in a 1/1 wt ratio was spin coated between PS and PMMA sheets. The NCO content of the reactive PS was changed (0.6, 2.2 and 7 mol% of TMI), while keeping constant the other molecular parameters. The samples were annealed at 200°C for 40 min. Fig. 12 shows that no significant increase in the fracture toughness is observed in the case of the PS-co-TMI (Mn: 42000, Mw/Mn: 1.3, TMI: 0.6 mol%, ca. 3 groups per
chain)/PMMA-OH (Mn: 48500, Mw/Mn: 1.2) premixture, which might indicate that a critical content of
reactive groups is required for the interfacial reaction to occur under the experimental conditions used. When the content of the isocyanate groups attached to polystyrene is increased (PS-co-TMI (Mn:
42500, Mw/Mn: 1.3, TMI: 2.3 mol%, ca. 9 groups per chain)/PMMA-OH (Mn: 48500, Mw/Mn: 1.2)), the
fracture toughness is increased from 20 to 80 J/m2 (Fig. 12). So, the isocyanate containing PS has now the opportunity to react with the hydroxyl containing PMMA before these polymers have diffused into the parent homopolymer phases. When the reactive group content (RGC) is further increased (PS-co-TMI (Mn: 36000, Mw/Mn: 1.3, TMI: 7 mol%, ca. 25 groups per chain) / PMMA-OH (Mn: 33500,
Mw/Mn: 1.2)), the toughness of the PS/PMMA interface is comparable to the value imparted by the
premade copolymer (370 J/m2) (Fig. 12). Thus, when the average number of isocyanate groups per PS chains is increased, the probability of reaction with PMMA-OH is also increased, and the grafting of PS by PMMA makes their diffusion into the parent layer much less favorable, so accounting for the rapidly improved fracture toughness ( Fig. 12).
Fig. 12. Effect of the reactive group content of (P(S-co-TMI)) on the fracture toughness (Gc) of the
PS/PMMA interface.
Because the interfacial fracture toughness is close to that one imparted by the premade copolymer, the morphology of the interface modified by the premixture containing PS-co-TMI with the highest RGC was observed by TEM. Fig. 13 shows no distinct interphase, but rather a sharp interface in contrast to the situation triggered by the premade copolymer (Fig. 7 (top)), used in the same amount. At least because of higher melt viscosity PMMA is expected to form the dispersed phases in the spin-coated blend of the reactive polymers. Dispersed PMMA phases are actually observed as large bright PMMA droplets in the dark (PS) phase and probably stabilized by the interfacial reaction. Nevertheless, as result of the slow NCO/OH reaction, some reactive polymer chains may have time to diffuse towards the parent phases (PS-X in PS and PMMA-Y in PMMA) and organize at the PS/PMMA interface before reacting with formation of the graft copolymer. However, depending on their composition and balance of interaction with the homopolymers, some copolymer chains, richer in PMMA (due to the multifunctionality of the PS chains), can leave the interfacial region to form micelles, which can be seen as small black PS droplets in the PMMA phase ( Fig. 13).
Fig. 13. TEM observations of the PS/PMMA interface modified by the premade copolymer (top) and the reactive P(S-co-TMI)/PMMA-OH blend.
Once again, the fracture surfaces were analyzed by SEM. Plastic deformation areas (more likely PS fibril residue) and smoother areas were observed on the PMMA side. According to the Raman
confocal microscopy, the rough zones consist of PS residues, since the Raman spectrum is comparable to that one of PS modified, however, by the more intense PMMA scattering peaks (Fig. 14).
Moreover, no PS is detected in the smoother areas (Fig. 15). Therefore, the fracture propagates alternatively within PS (craze failure) and at the sharp PS/PMMA interface (smooth areas rid of any PS trace). No trace of PMMA is observed on the fracture surface on the PS side (Fig. 16) in agreement with the above conclusion.
Fig. 15. Raman spectrum of the smooth regions on the PMMA surface after fracture.
Fig. 16. Raman spectrum of the PS surface after fracture.
4. Conclusions
The PS/PMMA interface has been modified by a premade P(S-g-MMA) graft copolymer and by a reactive mixture of the PS and PMMA precursors, i.e. P(S-co-TMI) of various RGC and PMMA-OH. In the case of the premade copolymer, the fracture toughness is multiplied by more than 20 with respect to the unmodified interface. Nevertheless, the reactive mixture leads to a fracture toughness close to that one promoted by the premade copolymer, in spite of a different organization of the copolymer formed at the interface. The premade copolymer actually forms a strong interface as result of a short-range organization of PS and PMMA lamellae swollen by the parent homopolymer. An
efficient entanglement of the copolymer chains is thought to favor the stress transfer from one phase to the other one. In contrast, a sharp interface is formed in the reactive system, the copolymer chains more likely acting as bridging chains.
Whatever the way the interface is modified, the Raman confocal microscopy shows that the fracture occurs alternatively within the PS phase and either at the PS/copolymer interface for the non-reactive system, or at the sharp PS/PMMA interface and within the PS phase for the reactive one (Fig. 17). These observations can account for the high experimental fracture toughness which is close to the cohesive energy of PS.
Fig. 17. Schematic view of the crack propagation in the PS/PMMA assembly: premade system (left), in situ system (right).
Acknowledgements
R.J. is grateful to the "Services Fédéraux des Affaires Scientifiques, Techniques et Culturelles" for general support to C.E.R.M. in the frame of the "PAI-4: Chimie Supramoléculaire et Catalyse Supramoléculaire". The authors wish to thank M. Dejeneffe for TEM analysis and M.S. Khorari for some Raman confocal microscopy experiments.
References
[1] Koning C, Van Duin M, Pagnoulle C, Jérôme R. Prog Polym Sci 1998;23:707. [2] Fayt R, Jérôme R, Teyssié P. J Polym Sci, Polym Commun 1989;27:775. [3] Fayt R, Jérôme R, Teyssié P. Makromol Chem 1986;187:837.
[4] Fayt R, Teyssié P. Polym Engng Sci 1990;30:937.
[5] Luzinov I, Xi K, Pagnoulle C, Huynh-Ba G, Jérôme R. Polymer 1999;40:2511. [6] Dai CA, Dair BJ, Dai KH, Ober CK, Kramer EJ, Hui CY, Jelinski LW. Phys Rev Lett 1994;73:2472.
[7] Ide F, Hasegawa AJ. Appl Polym Sci 1974;18:963.
[8] Creton C, Kramer EJ, Hui CY, Brown HR. Macromolecules 1992;25:3075. [9] Brown HR, Char K, Deline VR, Green PF. Macromolecules 1993;26:4155. [10] Sikka M, Pellegrini NN, Schmitt EA, Winey KI. Macromolecules 1997;30:445. [11] Lee Y, Char K. Macromolecules 1994;27:2603.
[12] Pagnoulle C, Jérôme R. Macrom Symp, 2000;149:207.
[13] Koriyama H, Oyama HT, Ougizawa T, Inoue T, Weber M, Koch E. Polymer 1999;40:6381. [14] Keller RN, Wycoff HD. Inorg Synth 1946;2:1.
[15] Haddelton D, Waterson C, Derrick PJ, Jasieczek CB, Hannon MJ, Schooter AJ. Chem Commun 1997:683.
[16] Patten TE, Matyjaszewski K. Adv Mater 1998;10:901. [17] Dexter RW, Saxon R, Fiori DE. J Coat Tech 1986;58:43. [18] Yin Z, Koulic C, Pagnoulle C, Jérôme R. in preparation. [19] Hu G, Kadri I. J Polym Sci, Polym Phys 1998;36:2153.
[21] Paul RD, Newman S. Polymer blends, vol. 1. New York: Academic Press, 1978. [22] Dai C, Jandt KD, Iyengar DR, Slack NL, Dai KH, Davidason WB, Kramer EJ, Hui C. Macromolecules 1997;30:549.
[23] Orr CA, Adedeji A, Hirao A, Bates FS, Macosko CW. Macromolecules 1997;30:1243.

![Fig. 3. Dependence of M n (SEC) on conversion of MMA. [MMA] 0 =3 M; [2-OH- [2-OH-2′(MP)Br] 0 =[CuBr] 0 =[HMTETA] 0 =7 mM; toluene; T=85°C](https://thumb-eu.123doks.com/thumbv2/123doknet/6759379.186740/5.892.102.549.96.476/fig-dependence-sec-conversion-mma-cubr-hmteta-toluene.webp)