Titre:
Title:
Experimental investigation into rockfill dam failure initiation by overtopping
Auteurs:
Authors: Nasrin Javadi et Tew-Fik Mahdi
Date: 2014
Type: Article de revue / Journal article
Référence:
Citation:
Javadi, N. & Mahdi, T.-F. (2014). Experimental investigation into rockfill dam failure initiation by overtopping. Natural Hazards, 74(2), p. 623-637.
doi:10.1007/s11069-014-1201-9
Document en libre accès dans PolyPublie
Open Access document in PolyPublie
URL de PolyPublie:
PolyPublie URL: https://publications.polymtl.ca/5315/
Version: Version finale avant publication / Accepted version Révisé par les pairs / Refereed Conditions d’utilisation:
Terms of Use: Tous droits réservés / All rights reserved
Document publié chez l’éditeur officiel
Document issued by the official publisher
Titre de la revue:
Journal Title: Natural Hazards (vol. 74, no 2)
Maison d’édition:
Publisher: Springer
URL officiel:
Official URL: https://doi.org/10.1007/s11069-014-1201-9
Mention légale:
Legal notice:
This is a post-peer-review, pre-copyedit version of an article published in Natural Hazards. The final authenticated version is available online at:
https://doi.org/10.1007/s11069-014-1201-9
Ce fichier a été téléchargé à partir de PolyPublie, le dépôt institutionnel de Polytechnique Montréal
This file has been downloaded from PolyPublie, the institutional repository of Polytechnique Montréal
1
Experimental Investigation into Rockfill Dam Failure Initiation by Overtopping
12 3
Nasrin Javadi and Tew-Fik Mahdi* 4
5
Département des génies civil, géologique et des mines 6
Polytechnique Montreal 7
C.P. 6079, Succ. Centreville, 8
Montréal, Québec, Canada, H3C 3A7. 9
* Corresponding author: [email protected] , Tel: (514) 340-4711 ext. 5874 10
11
Abstract
12Rockfill is the most abundant building material. It is often used for water retention under 13
different contexts, such as dams, embankments or drainage systems. Climate change may cause 14
water levels to rise in reservoirs. As rockfill structures are not able to resist strong overtopping 15
flow, rising water levels will constitute a danger for rockfill dam stability as well as for people 16
living nearby. This work is aimed at the development of an empirical formula that enables 17
calculation of the critical water level of overflow at the crest from the geometrical and physical 18
parameters of a dam. 19
To achieve these objectives, several experimental tests on a rockfill dam model with two 20
different impervious cores, moraine with a sand filter and an empty wooden formwork, were 21
conducted in a hydraulic channel at the hydro-environmental laboratory at École Polytechnique 22
de Montréal. The purpose of these tests was to study the initiation of a riprap failure under the 23
influence of different variables, such as rock size, riprap bank, downstream side slope and bed 24
slope. Results showed linear trends between the critical water level and both the downstream 25
side slope and bed slope. Also, a power trend was observed between the critical level and riprap 26
grain size. A formula that gives the critical overtopping water level was developed from these 27
results. 28
Keywords
29Laboratory tests, Initiation of dam failure, Overtopping level, Critical hydraulic gradient 30
List of symbols
31 u C Uniformity coefficient (-) 32 crD Critical overflow height (L) 33
50
D Diameter of the sieve allowing 50% of soil to pass (L) 34
g Acceleration caused by gravity (L/T²) 35
2 Q Discharge (L3/T)
36
h Water level (L)
37
H Height of the dam (L)
38 n
H Height of the core (L) 39
hcr Critical water level in the tank (L) 40
K Hydraulic conductivity of the soil (L/T) 41
ieff Effective gradient (-) 42
L Length of the foot of the dam (L) 43 n Porosity of sediments (-) 44 u* Shear velocity (-) 45 V Flow velocity (L/T) 46
W Length of the dam crest (L)
47 n
W Length of the dam core (L) 48
α Empirical exponent (-) 49
or Downstream face angle of the dam (º) 50
α’ Downstream face angle of the core (º) 51
β Upstream face angle of the dam (º) 52
β’ Upstream face angle of the core (º) 53
θ Bed slope angle (º) 54 Fluid density (M/L³) 55 s Grain density (M/L³) 56
τ* Shear stress, Shields parameter (-) 57
1
Introduction
58For many climatological stations in Quebec, the increase in winter temperatures has resulted in 59
an increase in the frequency of freeze-thaw cycles. These episodes, during which temperatures 60
pass the freezing point and remain for some time above 0’C, can have significant impact on the 61
change in the water level upstream of dams and other retaining structures (Milly et al. 2002; 62
Yongpink et al. 2004; Tie and Tang 2009). These may increase the risk of extreme floods that 63
pass over the design of the structures and also increase the risk of ruptured structures caused by 64
overflow. Ralston (1987) has already reported more than 57,000 dams that have the potential for 65
overflow in the United States. 66
In Quebec, the law on dam safety requires that the crest of a dam that is susceptible to erosion at 67
its lowest point be at least 1 meter above the flood safety level, unless the owner demonstrates to 68
the satisfaction of the department that all hydrologic and hydraulic uncertainties and flood 69
management uncertainties are taken into account when establishing the flood safety height 70
(Assemblée Nationale du Québec 2000). 71
The rupture of a structure is understood to be the destruction or the movement of a portion of the 72
structure, its support or its foundations, rendering it unable to retain water (Marche 2008). The 73
observation of crumbling embankments has shown different modes of destruction. The most 74
3 frequent are breaks from overflow, erosion of the crest and downstream face, or internal erosion 75
of the structure or its foundation. The destruction of a backfill structure by an overflow creates a 76
flood over the crest and erosion resulting from the strength of the current at the foot of the dam, 77
followed by internal erosion of the structure and foundation of the dam, causing the reservoir to 78
empty. This flood then spreads downstream, filling the valley and endangering the lives of 79
inhabitants (Marche 2008). The Commission Internale des Grands Barrages (1994) has 80
demonstrated that around a third of all breaks in backfill dams have been caused by insufficient 81
holding capacity resulting in an overflow over the crest. 82
According to Goubet (1979), embankments often endure splits before breaking, due to the high 83
permeability of a layer of rock that, during flooding periods, allows excess water to pass through 84
or over the works up to a certain ma38+ximum height without causing the structure to collapse. 85
According to the work of Von Thun and Gilette (1990), a breach in a dam does not necessarily 86
occur when water passes over the crest. Depending on the properties of the fill material, the 87
structure can more or less tolerate overflow over its crest for a long time. 88
This work presents experimental studies that have dealt with different aspects of three types of 89
rockfill dams breaking: homogenous rockfill dams, rockfill dams that are naturally formed by 90
valleys and rockfill dams with a core. Many studies describe the geometry and development of 91
abreach as well as a hydrograph of homogenous rockfill dams breaking (MacDonald and 92
Langridge‐Monopolis 1984; Froehlich 1987; Singh and Scarlatos 1988; Rozov 2003; Chinnarasri 93
et al. 2004; Zerrouk and Marche 2005; Froehlich 2008; Macchione and Rino 2008).Some 94
physical experiments are not able to fully reveal the physical mechanism of flooding because of 95
their relatively small scale (Coleman et al. 2002; Schmocker et Hager 2009). According to Leps 96
(1973), the stability of a homogenous downstream facing rockfill dam depends on the relative 97
density of the material of the dam, the maximum flow rate of infiltration and the inclination of 98
the downstream face of the dam. Franca and Almeida (2004) presented the RoDaB model to 99
calculate the hydrograph resulting from the rupture of a homogenous rockfill dam. They used 100
laboratory experiments to characterize some phenomenological aspects for which, at this time, 101
no analytical approximation exists (a coefficient and an exponent of erosion depends on the 102
material used in the dam). In addition, they carried out a comparison of the model with results 103
from the BREACH model (Fread 1984). This comparison reveals that the potential failure of a 104
rockfill dam is minor compared to that of an earth dam and it will collapse in a different manner. 105
A series of tests conducted by Liao and Chou (2003) was specifically focused on understanding 106
the different mechanisms of failure of rockfill dams that are naturally formed in valleys by 107
landslides. For experimental purposes, a dam with a large crest length and a variable slope 108
between 12° and 24° was placed in a channel. Gregoretti et al. (2010) have worked to improve 109
the understanding of hydraulic and sedimentological conditions that lead to flooding and erosion 110
of the crest of rockfill dams that are naturally formed. To do this, they carried out a systematic 111
series of experiments for different configurations of the dam, as well as a wide range of grain 112
sizes and bed slopes. The experimental results were used to determine a dimensional relationship 113
4 between the critical water level of the reservoir and the available parameters such the channel 114
bed slope, several geometrical parameters characterizing the configuration of the dam, and the 115
physical properties of the material. According to their results, the critical water level reaches the 116
maximum peak of the dam. 117
This review found that the focus of previous work has been placed on geometry and the 118
development of a breach, on the hydrogram of the rupture and the stability of the downstream 119
slope. Little work has been done on models of a dam with a core. In addition, no study has been 120
found that is focused on the prediction of the initiation of the breach of a rockfill dam with a core 121
caused by the overflow of water over the crest using the geometrical parameters of the dam. 122
In the present work, we aim to improve the understanding of hydraulic and sedimentological 123
conditions that lead to the rupture of a dam because embankments are generally not capable of 124
withstanding strong outbursts. The overall objective in this research is to study the initiation of 125
the breakdown of the top layer of rock (charging) of a zoned embankment caused by the 126
overflow of water over the crest of the dam. The specific objective was to visually predict the 127
position of the start of erosion at the downstream face of the dam, which causes the beginning of 128
the movement of rock, and also to find an empirical relationship to determine the critical height 129
of the overflow that causes the initiation in the rupture by using a dimensional analysis. This 130
empirical relationship has the advantage of relying solely on geometrical parameters, which 131
makes it simple and practical. To do this, we performed multiple tests on laboratory scale models 132
of the hydro-environment at École Polytechnique de Montréal in order to determine the critical 133
height of the overflow over the crest of the dam that causes the initiation of the rupture as a result 134
of different parameters such as particle size, the slope of the downstream face and the slope of 135
the bed. 136
This article contains four sections. The first section introduces the topic, presents the existing 137
problems and the objectives and overview of previous work. The second section details the 138
experimental and physical properties of the materials used, as well as highlights the experimental 139
process of testing and the sensitivity analysis of different parameters. The third section illustrates 140
the experimental results followed by an analysis to emphasize the shape of the empirical 141
relationship representing the results. The final section concludes and makes recommendations 142
for future research. 143
2
Experimental study
1442.1 Apparatus and materials
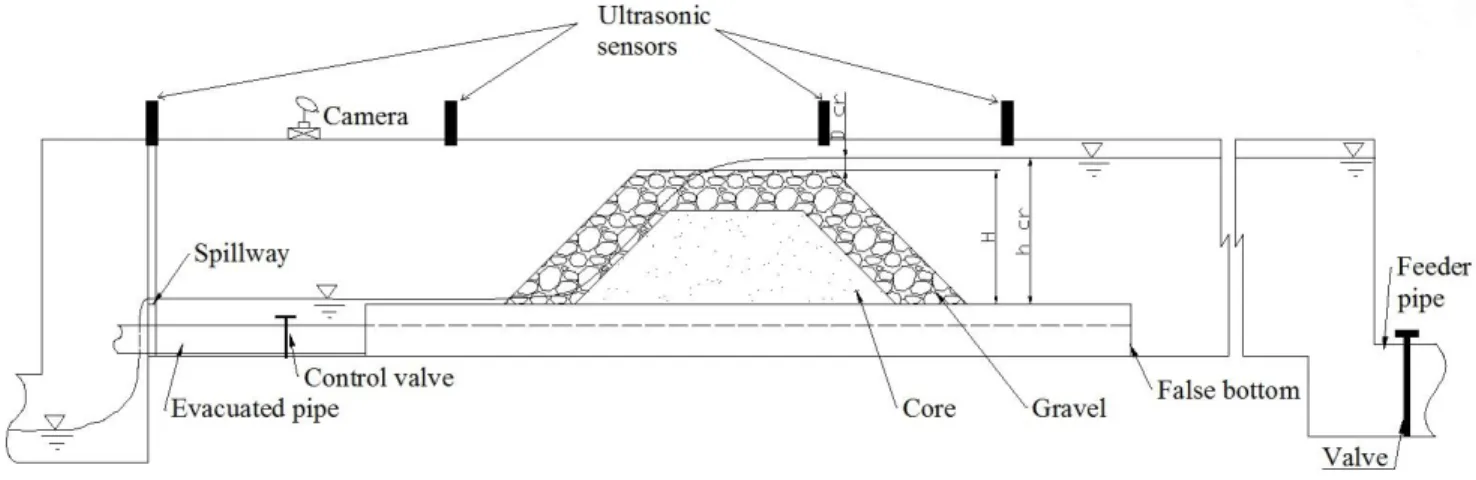
145The diagram in Figure 1 illustrates the configuration of the experimental setup. The dam was 146
built in a rectangular channel with a 14.8 m length, 0.5 m depth and 0.76 m width. At the dam 147
level, the wall of the channel is in glass, which allows for observation of the flow through the 148
dam and the movement of particles. The length of the channel allows the formation of a holding 149
5 tank of 5.7 m³. Four ultrasonic sensors were used in the tests. The sensors were placed in the 150
center of the channel to avoid walls’ influence on the reading of water levels. The use of these 151
ultrasonic sensors allows a measurement to be taken without water contact, which provides the 152
advantage of not disturbing the flow. 153 154 155 156 157 158
Figure 1: Diagram of the experimental setup 159
In its entirety, the dam spans the width of the channel. The crest length and base length were set 160
at 63 cm and 149 cm, respectively. The height was 43 cm. The upstream slope was set to 1V: 161
1H, while the downstream varied for the sensitivity analysis. 162
Two apparatuses have been studied in the choice of an impervious core in the dam: the first was 163
with moraine and sand and the second with an empty wooden formwork. The rip rap, sand 164
diameters and the geometrical dimensions are the same as those of Maknoon and Mahdi (2010). 165
• Dam with watertight soil core 166
The core consists of clay and sand moraine. The core has dimensions of 33 cm crest length, 63 167
cm base length and 15 cm height. Each slope, upstream and downstream, are formed at a 45° 168
angle. The filter layer, placed over the core, has a thickness of 15 cm and a length of 43 cm at the 169
peak and 103 cm at the base. The inclination of the two faces is the same as that of the core. The 170
gravel bed has a length of 63 cm at the peak, with a thickness of 13 cm. The slope of the 171
upstream face is fixed at 45°, while the downstream slope varies for different tests. Figure 2 172
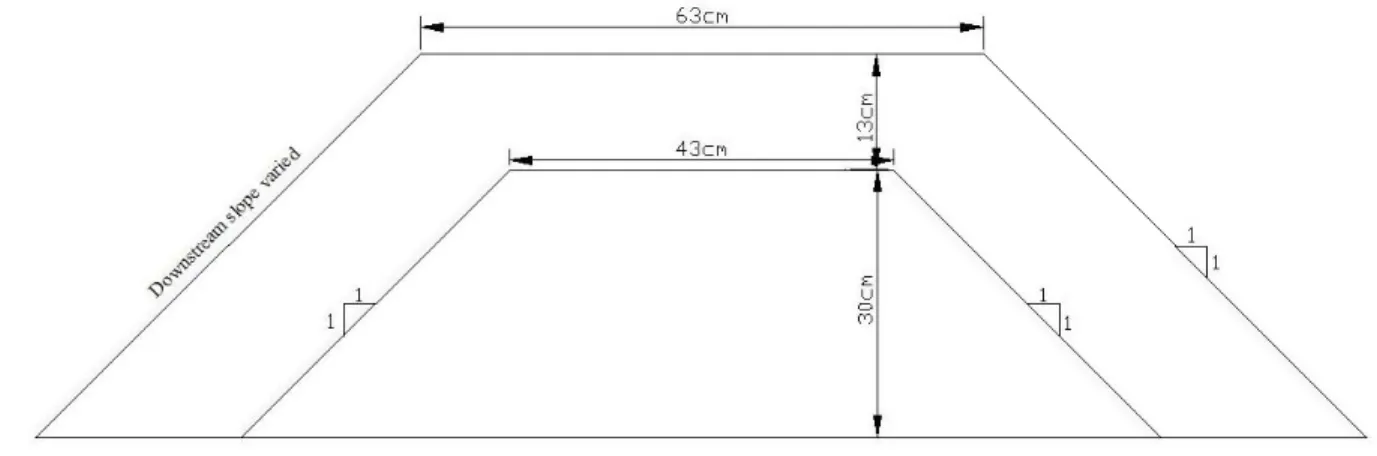
illustrates the typical cross-section of this model. 173
6 174
Figure 2: Cross section of the dam made with a soil core 175
• Dam with a sealed wooden core 176
The core was replaced by an empty wooden formwork. Its dimensions are those of the external 177
bounds of the sand (filter) layer, 43 cm length at the peak and 103 cm length at the base, with 30 178
cm height. The wooden formwork was sealed well and its location was fixed with silicone along 179
the sides of the channel. The gravel layer has the same dimensions as those present in the dam 180
with the earth core. A diagram of the dam is illustrated in Figure 3. 181
182
Figure 3: Cross section of the dam that contains a wooden core 183
Regarding the materials used, gravel in three different sizes was chosen for the outer layer: 10-184
14mm, 14-20 mm and 20-25 mm. Moraine was used to seal the model. The sand acted as a filter 185
between the core and the top layer of gravel. To ensure that the materials met the placement 186
requirements, some of their properties such as particle size, relative density, degree of 187
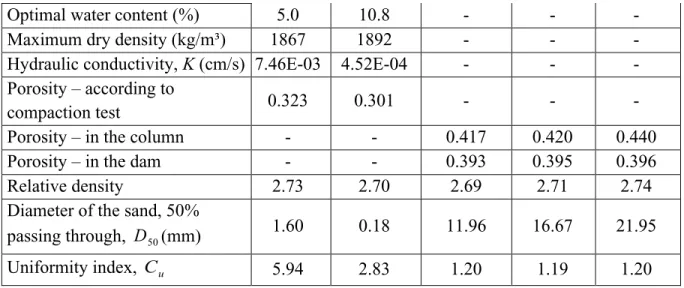
compaction and permeability were examined (Table 1). 188
Table 1: Properties of the material used 189
Sand Moraine Gravel 10-14 mm
Gravel 14-20 mm
Gravel 20-25mm
7
Optimal water content (%) 5.0 10.8 - - -
Maximum dry density (kg/m³) 1867 1892 - - -
Hydraulic conductivity, K (cm/s) 7.46E-03 4.52E-04 - - - Porosity – according to
compaction test 0.323 0.301 - - -
Porosity – in the column - - 0.417 0.420 0.440
Porosity – in the dam - - 0.393 0.395 0.396
Relative density 2.73 2.70 2.69 2.71 2.74
Diameter of the sand, 50%
passing through, D50(mm) 1.60 0.18 11.96 16.67 21.95
Uniformity index, Cu 5.94 2.83 1.20 1.19 1.20
2.2 Execution of the test
190Experiments on different geometries and compositions of dams were conducted to study the 191
beginning of the breach in the layer of the charge. The following sections detail the experimental 192
protocol. 193
2.2.1 Preparation of material and dam setup
194The first series of tests was carried out following the construction of a dam consisting of a core 195
and a filter in the ground. In the second series of tests, a wooden formwork replaced the core and 196
filter. 197
For each model, the predefined dimensions of the layers were marked on the outside of the side 198
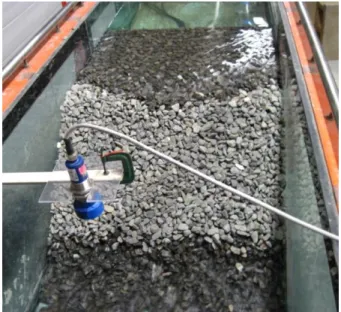
wall windows along the channel, to base the construction of the dam upon (Figure 4). 199
200
Figure 4: Marks on the glass walls of the channel of the dimensions of the layers 201
The moraine and sand were placed one layer at a time, each with a thickness of several 202
centimeters, and compressed by the dead weight of a mechanical hammer by 93% ±2% and 92% 203
± 2% degree of compaction, respectively for the layer of moraine and sand. After placing the 204
core and the filter, the rock layer was placed over the main body of the dam. 205
8 In the second model of the dam, the wooden casing was set in the channel with silicone. Once 206
the silicone was thoroughly dried, the next step was to lay the gravel layer. The gravel was 207
placed on top of the casing as it had been in the soil core model. 208
2.2.2 Test procedure
209To begin, the channel was fed by a constant flow of intake and the water level was regulated at a 210
constant level over the crest of the filter for three days to allow the moraine and sand become 211
saturated to obtain maximum hydraulic conductivity as well as maximum filtration output. 212
The initial condition of the test was characterized by a constant flow of intake, Q0. To minimize 213
the relative error on the critical height of the water that causes the initiation of a breach on the 214
downstream face, the flow rate was increased in small increments of 3×10⁻⁴ m³/s, resulting in 215
increased depth of water of 2×10⁻³ m. At each increment of the flow, 10 to 15 minutes was 216
required to stabilize the water level before beginning the measurements. Once the flow is equal 217
to Q0, we observe a thin blade at the foot of the downstream face as a result of infiltration into the 218
layer of sand. Once the flow rate increased, the water level crossed the sand/gravel interface and 219
we began to observe flow in the gravel level. The impact of this increase in the water level on the 220
stability of the downstream face depends on the size of the ripraps and the geometry of the dam. 221
Once the upstream water level exceeds the critical value, the flow at the foot of the downstream 222
face begins to erode particles. By gradually increasing the flow as illustrated in Figure 5, the 223
flow carries the particles at the bottom of the downstream face (it should be noted that while we 224
were in this phase, the structure remained stable and held its ability to retain water upstream); 225
next, the erosion spreads up the sides, forming a breach. The test was terminated before reaching 226
the final breach. 227
228
Figure 5: Phase beginning the breach at the foot of the downstream face 229
9 During the tests, the load of the tank and the charges at the entrance and the exit of the dam were 230
recorded by ultrasonic sensors. Note that when the water is inside the dam, a measuring tape 231
stuck on the glass showed water levels upstream of the crest, whereas levels were recorded by 232
ultrasonic sensor when the overflow occurred. 233
2.2.3 Sensitivity study
234The inability to analytically predict the time a breach begins from physical and geometric 235
parameters of a dam is mitigated by experimental approaches. The objective is to correlate, in a 236
direct relationship, the critical level in a reservoir causing the initiation of a breach, and the 237
physical and geometrical parameters of a dam. 238
First of all, it is important to develop the parameters that play an important role in the instability 239
of a dam and the formation of the breach. The parameters affecting the rupture of the dams are 240
overflow liquid properties (such as density and viscosity), the flow conditions (such as the flow 241
rate and the upstream water level), and the material properties forming the dam such as 242
permeability, shape and particle size distribution (Zhao 1992). Local sediment stability and its 243
ability to be transported generally depends on several factors such as the properties of the fluid 244
and sediment, the water depth and the shear velocity (u*).The determination of the shear stress
245
(the counterpart dimension, the Shields Parameter, τ*) requires knowledge of quantities that are
246
difficult to estimate, such as the flow of the infiltration output (Gregoretti, Maltauro et al. 2010). 247
Rather than focusing on the local mobility of particles, the overall stability of the system was 248
connected to the overall geometrical and physical parameters of the structure. To characterize the 249
critical water level overflow over the crest, Dcr, it was proposed to use parameters that define the
250
overall stability, such as the following: , , s d50, g, L, H, W, Hn, Wn, tan,tan,tan
', 251'
tan , tan
, n, K. 252Following the dimensional analysis, only three variables of particle size distribution, slope of the 253
downstream face and slope of the bed, were made in the study. 254
• Particle size distribution
255
The size of the rock was one of the studied parameters. Three sizes of rock for the composition 256
of the backfill layer were selected: 10 to 14 mm, 14 to 20 mm and 20 to 25 mm. When studying 257
the influence of different sizes of granules, the slope of the downstream face and the bed of the 258
selected horizontal channel were set at 45 degrees. 259
• Slope of the downstream face
260
In order to analyze the influence of the slope on the initiation of the breach, different slope 261
values were tested: 45, 40, 35 and 30 degrees. For tests that had a variation in the slope of the 262
downstream face, the particle size distribution of 14-20 mm and a horizontal channel bed were 263
chosen. 264
• Slope of the bed
10 A wooden board, placed at the desired angle, produces different bed slopes. The slopes 266
considered are inclines of 0, 1.5, 3 and 5 degrees. The particle size distribution of 14-20 mm and 267
a 45 degree slope of the downstream face were selected for this study. These sensitivity studies 268
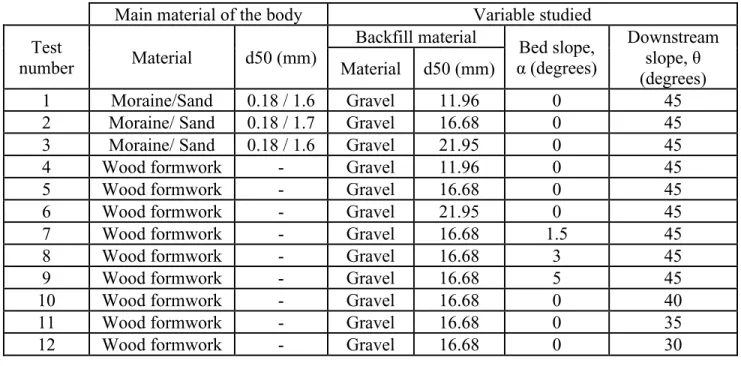
were conducted to achieve 12 different types of tests, summarized in Table 2: Tests conducted 269
Main material of the body Variable studied
Test
number Material d50 (mm)
Backfill material Bed slope, α (degrees) Downstream slope, θ (degrees) Material d50 (mm) 1 Moraine/Sand 0.18 / 1.6 Gravel 11.96 0 45
2 Moraine/ Sand 0.18 / 1.7 Gravel 16.68 0 45
3 Moraine/ Sand 0.18 / 1.6 Gravel 21.95 0 45
4 Wood formwork - Gravel 11.96 0 45
5 Wood formwork - Gravel 16.68 0 45
6 Wood formwork - Gravel 21.95 0 45
7 Wood formwork - Gravel 16.68 1.5 45
8 Wood formwork - Gravel 16.68 3 45
9 Wood formwork - Gravel 16.68 5 45
10 Wood formwork - Gravel 16.68 0 40
11 Wood formwork - Gravel 16.68 0 35
12 Wood formwork - Gravel 16.68 0 30
. 270 271
Table 2: Tests conducted 272
Main material of the body Variable studied
Test
number Material d50 (mm)
Backfill material Bed slope, α (degrees) Downstream slope, θ (degrees) Material d50 (mm) 1 Moraine/Sand 0.18 / 1.6 Gravel 11.96 0 45
2 Moraine/ Sand 0.18 / 1.7 Gravel 16.68 0 45
3 Moraine/ Sand 0.18 / 1.6 Gravel 21.95 0 45
4 Wood formwork - Gravel 11.96 0 45
5 Wood formwork - Gravel 16.68 0 45
6 Wood formwork - Gravel 21.95 0 45
7 Wood formwork - Gravel 16.68 1.5 45
8 Wood formwork - Gravel 16.68 3 45
9 Wood formwork - Gravel 16.68 5 45
10 Wood formwork - Gravel 16.68 0 40
11 Wood formwork - Gravel 16.68 0 35
11
3
Results and discussion
273
The tests on the rockfill dam model with a tight core were used to study the threshold level of 274
water flowing over the crest of the dam, causing the beginning of the breach on the downstream 275
face. Once the central zone was sealed, the passage of water through the body of the 276
embankment is made in the layer of gravel. The initiation of the breach took form at a given 277
place and it was of great interest to locate the critical point in order to calculate the losses that 278
generated the break at that point. The focal point of the flow at the exit of the dam was located at 279
the base of the downstream face. The increase in flow rate was done gradually and caused a 280
thickening of the depth at the exit point, as well as caused the erosion of stone at the foot of the 281
downstream base. This has been identified as the critical position, because the increased flow 282
caused particles to be washed out following a slip in the siding materials. 283
3.1.1 Analysis of the critical gradient
284The effective hydraulic gradient through, ieff , the dam was evaluated in order to ascertain the 285
losses between the input and the critical position at the exit of the dam. 286 x h ieff = (1) 287 With: 288
Δh : head difference between the two measurement points
289
Δx : horizontal distance between the two measurement points
290
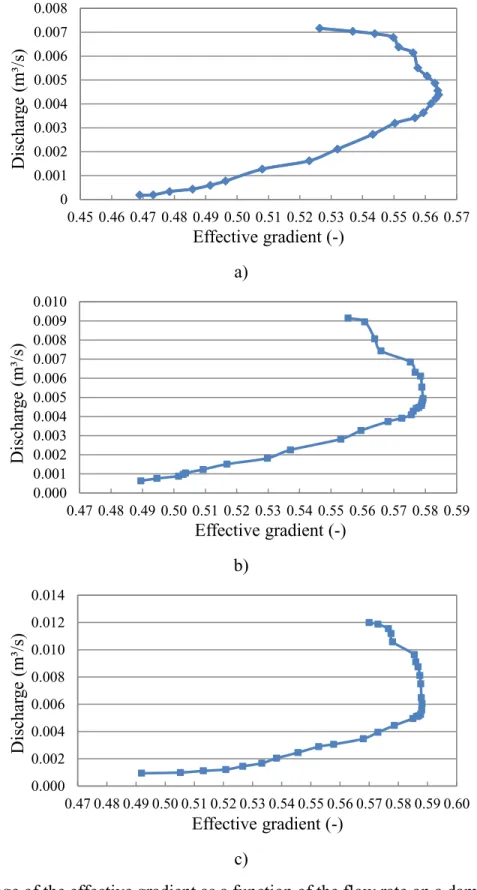
The evolution of the effective gradient in function of the flow rate has been plotted for the 291
purpose of illustrating the increase in gradient, to the point of inflection, ieffc, which is associated
292
with the critical water level (initiation of the breach), from which there is a decrease in the 293
gradient while the flow continues to increase. Figure 6 illustrates this procedure for the tests on 294
the sensitivity of the particle size (a trial for each category is presented). The evolution of the 295
curves shows a gradual increase in the flow rate and the effective gradient. Once the rupture 296
initiates, following the gradual erosion at the foot of the dam, this causes a decrease in the 297
gradient. Since the dam maintains its resistance for some time after the initiation of the breach, 298
the decrease in the gradient is very slow (additionally, the ripraps are large in size, or the 299
downstream side and bed slopes are softer, and the final formation of the breach is slowed). The 300
increases in the flow causing landslides of the slopes explain small ruptures on the bends. 301
12 303 a) 304 305 b) 306 307 c) 308
Figure 6: Change of the effective gradient as a function of the flow rate on a dam with a wooden 309
formwork a) 10-14 mm gravel with α = 45º and θ = 0º b) 14-20 mm gravel with α = 45º and θ = 310
0º and c) 20-25 mm gravel with α = 45º and θ = 0º 311 0 0.001 0.002 0.003 0.004 0.005 0.006 0.007 0.008 0.45 0.46 0.47 0.48 0.49 0.50 0.51 0.52 0.53 0.54 0.55 0.56 0.57 Disc ha rg e (m³/s) Effective gradient (-) 0.000 0.001 0.002 0.003 0.004 0.005 0.006 0.007 0.008 0.009 0.010 0.47 0.48 0.49 0.50 0.51 0.52 0.53 0.54 0.55 0.56 0.57 0.58 0.59 Disc ha rg e (m³/s) Effective gradient (-) 0.000 0.002 0.004 0.006 0.008 0.010 0.012 0.014 0.47 0.48 0.49 0.50 0.51 0.52 0.53 0.54 0.55 0.56 0.57 0.58 0.59 0.60 Disc ha rg e (m³/s) Effective gradient (-)
13 The shape of the curve is essentially the same from one test to another for each variant. Small 312
differences in results exist at each flow change, but it is possible that the variations in the flow 313
are not exactly the same because the opening of valves was done manually. 314
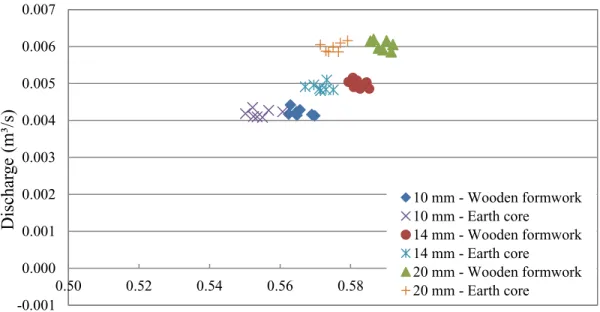
By comparing the results obtained from testing the model with the dam made of a soil core and 315
the model of the dam with a wooden frame, it was concluded that the gap starts at the same 316
upstream water level. However, there is an increase in the water level at the output of the dam of 317
one centimeter maximum in length at the beginning of the breach in the instance of the soil core, 318
which corresponds to the decrease of the gradient. Figure 7 presents the results of the critical 319
point of these tests. According to the calculation of the maximum infiltration rate through the 320
entire core and filter, a flow rate of 2
×
10-6 m³/s was obtained. Since the infiltration is negligible 321based on the hypothesis of the existence of a proper seal in the dam, it was decided to replace the 322
earth core with a wooden formwork for the remainder of the tests. The form directly conducted 323
the water towards the most permeable layer, the gravel, eliminating the need to retouch the filter 324
during the application of gravel during each test, and facilitating the reconstruction of the dam 325
during a study of the sensitivity of the slope of the bed. 326
327
Figure 7: Comparison of the gradient that is critical to the initiation of the breach for two core 328
types: soil and wood formwork 329 330 -0.001 0.000 0.001 0.002 0.003 0.004 0.005 0.006 0.007 0.50 0.52 0.54 0.56 0.58 0.60 0.62 0.64 Disc ha rg e (m³/s)
Critical effective gradient (-)
10 mm - Wooden formwork 10 mm - Earth core 14 mm - Wooden formwork 14 mm - Earth core 20 mm - Wooden formwork 20 mm - Earth core
14
3.1.2 Critical water height over the crest
331
The results of three sensitivity tests on the initiation of the breach in the dam correspond to the 332
critical water overflow height over the crest of the dam in a dimensionless form. For each 333
sensitivity analysis, six to seven successive tests were run on the same model to ensure 334
consistent results. The critical water level in the tank, hcr, is associated with the critical gradient,
335
ieff c, corresponding to the critical flow rate. The difference between the critical water level in the 336
tank and the elevation of the crest of the dam, the critical height of the overflow, Dcr, was
337
calculated. 338
The size of the ripraps, represented by d50, was the first variable in the study. The level of the
339
reservoir was obtained by the particle sizes of 20-25 mm and was 3 cm above the crest. Using 340
the best curve and applying the method of least squares on the result of the critical water level of 341
the overflow, a power curve shape (y=a+bxc) fits the measured data well with a regression 342
coefficient of 0.955 (Figure 8a). The second variable of interest was the slope of the downstream 343
face, α. This is what allowed for the highest levels of water for the gentlest slopes. A linear form 344
curve (y=a+bx) is consistent with the results obtained with a regression coefficient of 0.924 345
(Figure 8b). The third variable studied was the influence of the bed slope, θ, on the critical water 346
height of the overflow. As with the slope of the downstream face, a linear curve ( y=a+bx) was 347
adjusted to the measured data for a regression coefficient of 0.982 (Figure 8c). 348
15 350 a) 351 352 b) 353 354 c) 355
Figure 8: Dimensionless critical water heights over the crest under the effect of different 356
variables a) particle size b) the downstream slope and c) the slope of the bed. 357 0 0.01 0.02 0.03 0.04 0.05 0.06 0.07 0.08 0 10 20 30 40 50 60 Dcr / H ( -) d50 / H (-) 0 0.01 0.02 0.03 0.04 0.05 0.06 0.07 0.08 0.09 0 0.1 0.2 0.3 0.4 0.5 0.6 0.7 0.8 0.9 1 1.1 Dcr / H ( -) tan α (-) -0.005 0 0.005 0.01 0.015 0.02 0.025 0.03 0.035 0.04 0.045 0 0.01 0.02 0.03 0.04 0.05 0.06 0.07 0.08 0.09 0.1 Dcr / H ( -) tan θ (-)
16
3.2 Development of the regression curve
358
For a multivariate analysis, it was possible to connect all variations of the four variables. The 359
objective was to present a practical empirical relationship for the critical height of the overflow, 360
in function of other variables that are easier to obtain, such as the slope of the downstream face, 361
the size of the particles and the slope of the bed. To do this, using the general regression of each 362
variable depending on the dimensionless height of the critical water overflow, the form 363
suggested by Gregoretti et al. (2010) was used: 364
e f α
H d d c θ b a H Dcr g tan tan 50 + + + = (2) 365The coefficients a, b, c, d, e, f and g of the empirical formula (2) were determined by minimizing 366
the sum of the square differences between measured values and those that were calculated. The 367
following values were obtained: a= 0.0391, b = 0.4446, c = 0.1299, d = 0.4173, e = 0.3931, f = -368
0.2042 et g = 0.7247. 369
Equation 3 is therefore the relationship between the critical height overflow with the variables 370
involved in the test conditions. 371
0.0391 0.4446tan
0.1299 0.4173
0.3931 0.2042tan
7247 . 0 50 − + − = H d H Dcr (3) 372The points shown in Figure 9 are the result of eleven experiments on eight geometries and three 373
different sizes of gravel. Looking at the graph reveals a match between the empirically calculated 374
values and the experimentally measured values. This is confirmed by the perfect fit line (y = x), 375
in which all the values found experimentally coincide with the results of the empirical formula 376
that was developed. The correlation coefficient for the best fit is 0.96. All items, except for five, 377
were situated between the dotted lines, which correspond to the maximum uncertainty of ± 378
0.0103 in empirically determining Dcr/ H.
17 380
Figure 9: A comparison of the measured dimensionless overflow heights (Dcr/H)m and empirical 381
calculations (Dcr/H)c corresponding to the beginning of the breach. 382
It should be noted that the relationship developed has limits to its application. In effect, the 383
downstream slope must obey the rules of the stability of the slope: the angle at which the gravel 384
rests is 45°, which must be taken as an upper limit for . The minimal angle used in the tests is 385
30° taking into account the constraints of the length of the channel in the experiment; this 386
relationship is not guaranteed below 30° slopes. The angle of inclination of the channel varied 387
between 0° and 5°, which corresponds to a slope between 0 and 8.7%. This interval is 388
representative of natural slopes. The values of d50/H that were used are between 0.023 and 0.046.
389
It is expected that the developed relationship provides better performance in this interval. 390
The calculation of uncertainty is an important aspect in any laboratory experiment because the 391
inaccuracy of the experimental data can affect the results. The absolute uncertainty of the results 392
based on the one hand, the accuracy of measuring instruments and human factors, and the other, 393
the error propagation on the errors of variables involved. The absolute uncertainty in different 394
amounts directly measured or calculated, is compiled in Table 3. Uncertainty ranges for some 395
calculated amounts are also presented. The uncertainties were determined by the extreme value 396
method for amounts with a linear dependence on a single variable and differential method for 397
equations with more than two variables with uncertainty. 398 -0.01 0 0.01 0.02 0.03 0.04 0.05 0.06 0.07 0 0.01 0.02 0.03 0.04 0.05 0.06 0.07 (Dcr / H ) c (-) (Dcr/ H )m (-) 10mm 14mm 20mm 45° 40° 35° 30° 0° 1.5° 3° 5° Maximum uncertainty
18 Table 3: Absolute uncertainties on some measured and calculated amount
399
Measured or calculated amount Units Absolute uncertainty
Dimensions of the dam m ± 0.001
Critical overflow height calculated* (Dcr) m ± 0.0008 – 0.0009 Critical water level in the tank (hcr) m ± 0.003
Discharge* (Q) m³/s ± 0.000018 – 0.000032
Effective gradient (ieff) - ± 0.0014 – 0.0015 Flow velocity mesured* (V) m/s ± 0.0005 – 0.0015 Water level (read by ultrasound sensor) (h) cm ± 0.0165 Water level (visual reading) (h) m ± 0.001
Height of the dam (H) m ± 0.004
Downstream face angle of the dam (α) - ± 0.3
Bed slope angle (θ) - ± 0.2
Representative diametre (d50) mm ± 0.05
*
Uncertainties Obtained by calculating400
4
Conclusion
401This paper investigates under which conditions a earth dam may fail: presently, the standards 402
used to perform hydraulics safety studies, initiates the breach when the water level reached the 403
dykes top. The experiment described in this paper show that the failure occurs for a water level 404
higher than the dyke’s top. An empirical relationship for the critical effective hydraulic gradient 405
is proposed to evaluate the water level at which the breach may initiate. Please note that a delay 406
in the breach formation, compared to standards’ recommendations, has a positive impact on dam 407
break flood’s time of propagation and hence on the evacuation available time. 408
This work has led to a better understanding and analysis of the mechanisms of a rupture of 409
rockfill dams with an impervious core through the use of an experimental model. Systematic 410
rupture tests of overflow in different geometric and physical configurations of the model were 411
made. These tests considered the position of the foot of the dam as a point of reference for the 412
initiation of the breach, which is practical and physically identifiable in practice. The 413
understanding of this allows for the calculation of an effective gradient that increases gradually 414
and according to the flow rate through the dam until it reaches the critical value, which is the 415
moment of the onset of a rupture. This point indicates the critical water level in the tank. 416
Dispersion points on the graph show that the critical overflow height varies linearly with the 417
downstream slope with that of the bed of the channel, while it varies with a power relationship in 418
the size distribution of the gravel. The effect of this latter parameter on obtaining a high critical 419
water height was more significant than those of the other geometric parameters. By collecting 420
critical water levels of the reservoir in all tests, an empirical relationship has been developed. 421
This approach has the advantage of relying on only four parameters of entry, which are: the 422
height of the dam, the angle of the downstream slope, the angle of the dam bed and the size of 423
the gravel. 424
19
References
425
Assemblée Nationale du Québec (ANQ) (2000). "Loi sur la sécurité des barrages, Projet de loi 426
93." Publications du Québec. 427
Chinnarasri, C., S. Jirakitlerd, et al. (2004). "Embankment dam breach and its outflow 428
characteristics." Civil Engineering and Environmental Systems 21(4): 247-264. 429
Coleman, S. E., D. P. Andrews, et al. (2002). "Overtopping breaching of noncohesive 430
homogeneous embankments." Journal of Hydraulic Engineering 128: 829. 431
Commission internationale des grands barrages (CIGB) (1994). "Comptes rendus." Congrès 432
international des grands barrages, Paris 433
Franca, M. and A. Almeida (2004). "A computational model of rockfill dam breaching caused by 434
overtopping (RoDaB)." Journal of Hydraulic Research 42(2): 197-206. 435
Fread, D. (1984). "A breach erosion model for earthen dams." National Weather Service (NWS) 436
Report, Silver Spring, MA, USA 437
Froehlich, D. C. (1987). EMBANKMENT-DAM BREACH PARAMETERS. Hydraulic 438
Engineering, Proceedings of the 1987 National Conference., Williamsburg, VA, USA, 439
ASCE. 440
Froehlich, D. C. (2008). "Embankment Dam Breach Parameters and Their Uncertainties." 441
Journal of Hydraulic Engineering 134(12): 1708-1721. 442
Goubet, A. (1979). "Risques associés aux barrages." La Houille Blanche(8): 475-490. 443
Gregoretti, C., A. Maltauro, et al. (2010). "Laboratory Experiments on the Failure of Coarse 444
Homogeneous Sediment Natural Dams on a Sloping Bed." Journal of Hydraulic 445
Engineering 136: 868. 446
Leps, T. M. (1973). "Flow through rockfill." Embankment-Dam Engineering. 447
Li, B. and M. H. Davies (1998). "Relationships for non-Darcy flow in rockfill." Journal of 448
Hydraulic Engineering 124: 206. 449
Liao, W. M. and H. T. Chou (2003). Debris flows generated by seepage failure of landslide 450
dams. 3rd International Conference on Debris-Flow Hazards Mitigation: Mechanics, 451
Prediction, and Assessment, September 10, 2003 - September 12, 2003, Davos, 452
Switzerland, American Society of Civil Engineers. 453
Macchione, F. and A. Rino (2008). "Model for predicting floods due to earthen dam breaching. 454
II: Comparison with other methods and predictive use." Journal of Hydraulic Engineering 455
134: 1697. 456
MacDonald, T. C. and J. Langridge‐Monopolis (1984). "Breaching Charateristics of Dam 457
Failures." Journal of Hydraulic Engineering 110: 567. 458
Maknoon, M. and Mahdi, T.F. (2010). Experimental Investigation Into Embankment External 459
Suffusion. Natural Hazards, 54(3), p. 749-763. 460
Marche, C. (2008). Barrages: crues de rupture et protection civile, Presses inter Polytechnique. 461
Maknoon M. and T. Mahdi (2010). 462
Milly, P. C. D., R. T. Wetherald, et al. (2002). "Increasing risk of great floods in a changing 463
climate." Nature 415(6871): 514-517. 464
Ralston, D. C. (1987). Mechanics of embankment erosion during overflow, ASCE. 465
Rozov, A. L. (2003). "Modeling of washout of dams." Journal of Hydraulic Research 41(6): 565-466
577. 467
Schmocker, L. and W. H. Hager (2009). "Modelling dike breaching due to overtopping." Journal 468
of Hydraulic Research 47(5): 585-597. 469
20 Singh, V. P. and P. D. Scarlatos (1988). "Analysis of gradual earth-dam failure." Journal of 470
Hydraulic Engineering 114(1): 21-42. 471
Tie, Y. B. and C. Tang (2009). "Progress in glacier lake outburst assessment system." Advances 472
in Water Science 20(3). 473
Von Thun J. L., G. D. R. (1990). "Guidance on Breach Parameters, un published internal 474
document, U. S. Bureau of Reclamation." Denver, Colorado: p.17. 475
Yongping, S., D. Yongjian, et al. (2004). "An increasing glacial lake outburst flood in the 476
Yarkant River, Karakorum in past ten years." Journal of Glaciology and Geocryology 477
26(2): 234. 478
Zerrouk, N. E. and C. Marche (2005). "Une contribution experimentale a l'etude de l'erosion 479
d'une digue par submersion et son analyse." Revue des Sciences de l'Eau 18: 381-401. 480