Science Arts & Métiers (SAM)
is an open access repository that collects the work of Arts et Métiers Institute of Technology researchers and makes it freely available over the web where possible.
This is an author-deposited version published in: https://sam.ensam.eu Handle ID: .http://hdl.handle.net/10985/6802
To cite this version :
Mohamed ACHOURI, Guénaël GERMAIN, Philippe DAL SANTO, Jean-Lou LEBRUN, Delphine SAIDANE - Development of a microscopic damage model for low stress triaxiality - Key
Engineering Materials - Vol. 473, p.460-467 - 2011
Development of a microscopic damage model for low stress triaxiality
Mohamed Achouri
1, a, Guenael Germain
1, b,
Philippe Dal Santo 1, c,
Jean Lou Lebrun
1, dand Delphine Saidane
2, e1LAMPA (EA 1427), 2 Boulevard du Ronceray BP 93525, 49035 Angers-France 2DEVILLE SA, ZI de Beauregard 49150 Baugé-France
a[email protected], b[email protected],
c[email protected],d[email protected], e[email protected]
Keywords: HSLA steels, ductile damage, shear, micrographic analysis, in-situ tests, numerical
simulation
Abstract. This work deals a contribution to ductile damage of High-Strength Low-Alloy (HSLA) steel steels under low stress triaxiality. This work is based on micrographics observations and in situ shear tests to examine the evolution of microstructure in this kind of loading and to identify the damage process associated. Numerical simulations by finites elements has been performed to simulate the material behavior of nucleation mechanism and the interaction between cavities during the coalescence phase, as well as the effect of the relative position of the inclusions in the shear plane. The model used as a reference in this work is the Gurson-Tvergaard- Needleman (GTN) model. It has been recently improved in order to take into account the effects of low triaxiality during shearing. The implementation of this model in a finite element code is in progress.
Introduction
Blanking operations used for the manufacturing of automobile safety components are very important as they make it is possible to fulfill technical functions that include mass optimization. The principal problem associated with these operations is the formation of burrs during the forming process. The burred zones induce dimensional and geometric inaccuracies which can damage other components, for example seat belts.
Better knowledge of the mechanisms involved in forming these burrs and the associated residual stress, residual strain and residual damage states, is important for manufacturers of these types of components. Their objective is to minimize the number of operations and production time for a functional component. Certain material damage models (e.g. Gurson type models) are defined, on the basis of an analysis conducted using tensile monotonic loadings, and attempt to describe the evolution of cavities in the material (germination, growth and coalescence). However these damage models, currently implemented in many commercial finite element packages, do not predict with sufficient accuracy the physical states that appear during shearing operations.
The damage process in alloys always involves some degrees of decohesion in the interface matrix-inclusion or fragmentation of inclusion [1]. The nucleated damage subsequently grows in a manner consistent with the stress state and the material degrades rapidly as individual damage sites begin to interact. Two families of ductile damage mechanisms have been identified for steels. A first family in which the mechanism of coalescence of cavities is a consequence of the growth mechanism of the cavities, this family is generally associated with high triaxiality loading. A second family in which the fracture occurs by micro-void shear localization process, in the case of low triaxiality, like find in blanking process [15]. For the second family, mechanism can initiate and propagate along the plane of maximum shear and reduces the ductility of materials. Most previous studies in the context of ductile fracture have focused on the behavior of cavities nucleated under high triaxiality loading [2, 3]. Experimental studies on the growth of cavities in the case of traction have been performed [4,5,14]. Several factors related to the growth of cavities have been also studied, such as changing the size of a spherical cavity [6]. The extension of this study for an
ellipsoidal cavity have been also performed [7]. The effect of the configuration of the cavity growth and coalescence have been modeled [8]. The resulting models of experimental and numerical studies presented above are unable to predict the onset of shear localization mechanism that can occur over a range of loading conditions and is solely responsible for the failure under shear loading. The analysis and understanding of this mechanism is the subject of this work.
When voids grow so large that they begin to interact with another; the deformation becomes highly localized. This process is understood as ‘‘void coalescence’’. In the case of coalescence, the shape of an individual void becomes no longer regular and thus the Gurson’s solution breaks down [9]. In general, such void linkage can occur at any orientation. In particular, the ligament between voids often may break in one of two directions: (a) perpendicular to the loading directions (intervoid ligament necking) and (b) in the localized shear direction (void shearing). The coalescence starts when the size of the voids and the ligament between voids becomes nearly equal [10, 11].
This research is based, in first time, on micro-structural observation, analyzed by Scanning Electronic Microscope (SEM) and in situ tests to observe the evolution of the physical damage process of cavities under low triaxiality loading conditions. In second time, the mechanism of coalescence of two cavities and the effect of the position of two inclusions on the shear localization in the ligament between cavities were simulated.
Experimental characterization
The material used in this study is a HLSA steel, S500MC, whose chemical composition is shown in Table 1. This material is commonly used in manufacture of automotive safety parts such as the buckle belt safety.
Table1: Chemical composition of S500MC steel.
Elements C (%max) Mn (%max) Si (%max) P (%max) S (%max) Al (%max) Nb (%max) V (%max) Ti (%max) Value 0.12 1.70 0.50 0.025 0.015 0.015 0.09 0.20 0.15
Microscopic analysis. The in situ tests allow observing microstructure evolution of particular area of the material at different levels using a Scanning Electron Microscope SEM. This has an important advantage, because they help identify the origin of damage observed without ambiguities. They allow also determine exactly location and time of occurrence of damage. The disadvantage of the procedure in situ is that only the surface can be observed.
Specimen tested. Various forms of shear specimens are tested by the finite element simulation to validate the best geometry, especially to obtain a low triaxiality in shear loading. The form used is described in Figure 1. The specimens was cut by wire Electrical Discharge Machining EDM in the transverse direction of sheet which thickness is 1.5 mm. Polishing was applied to the specimens to obtain a clean surface to observe clearly the evolution of the microstructure. The specimen was mounted and fixed to the micro-test module and installed in the SEM room.
Identification of inclusions kinds found in material. The density of inclusions and precipitates created during the development phase of the material will influence the behavior of the sheet during forming. Inclusions located at points of grain or in the matrix are generally harder and more fragile than the latter. In the initial structure, the inclusions are mainly globular type especially in the heart of the sheet. Inclusions present the principal motor of damage. EDS analysis allow to identify the elements present in inclusions encountered, which are essentially of alumina (Al2O3) with their size
varied between 1 and 10 microns. Figure 2 illustrates the different types of inclusions identified in the material.
(a) Alumina Al2O3
(b): Alumina coupled with calcium and
magnesium
Al2O3-(CaO-MgO)
(c): Alumina coupled with manganese, sulfur
and calcium
(Mn-Ca)S-CaO
(d) : Silicon oxide coated with alumina coupled to calcium and
Magnesium
Al2O3-(CaO-MgO)/ SiO2
Figure 2: Different types of inclusions found in the material
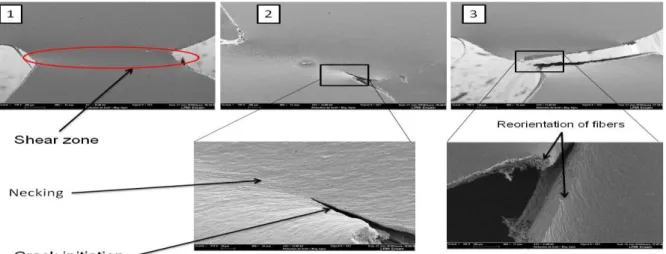
Evolution of the microstructure. The damage mechanisms of material are generally attributed to the effect of initiation and growth of micro-defects, which are usually reflected by the degradation of macroscopic properties. Microcracks and microcavities are two common micro-defects in the material. Nucleation, coalescence and propagation of micro defects are the primary mechanism of material damage. The pictures in Figure 3 show the creation of a shear band and it's evolution until failure of the specimen. The shear stresses are localized along a zone which is observed on a reduction in thickness which ends with the initiation of cracks at the edge and then a complete break. An expansion on the edge shows a reorientation in fibers, creating a burr caused by tearing of the material in this area.
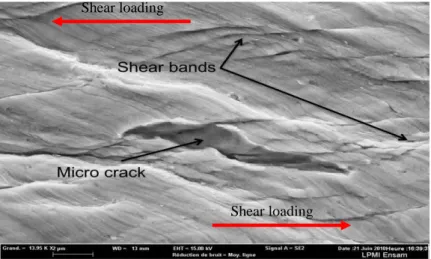
Figure 4 illustrates the evolution of damage in the material matrix. In effect, we observe the creation of shear bands under the effect of stresses localization in the area followed by the creation of microcracks resulting from slip bands. These are elongated and propagated in the directions of shear loading.
Figure 4: The damage evolution in matrix
Evolution of cavities. The sequence of pictures in figure 5 shows the evolution of three inclusions at different loading levels, located at two different locations as noted in figure 1. Inclusions located on line 1 (Fig. 5-a-b) are the most solicited in shear stress because the location is more dense than those found on line 2 (Fig. 5-c). In an unloaded state (0%), inclusions are integral in matrix. However, the difference in stiffness in level matrix / inclusion interfaces gives a local stress concentration. The application of shear mechanical stress, then a strain, generates a decohesion of the inclusions from one side then the other side from a certain load (Fig. 5-a at 88% of breaking load), or fragmentation of the inclusion without decohesion for that which is located at the location 2. Some inclusions on the line the most solicited (place 1) may have two mechanisms together, decohesion and fragmentation as shown in Figure 5-b. The void created between the matrix and inclusions, or between two parts of the broken inclusion, forms a cavity. The mechanism of micro-cavities birth is the nucleation stage or germination which is the origin of ductile fracture. However it is observed that germination can also be done by damage to the matrix in the immediate vicinity of an inclusion (Fig. 7-a at 88%) due to the concentration of shear stresses in bands. The void generated during the germination stage, grow in a state of shear stress. This growth is driven by plastic flow resulting in a hardening of the matrix around the cavities. This flow is not uniform and depends largely on the stress state and shape of the cavity, which is different to that observed in tension and tends to grow in both directions of loading in shear forming corners angular two sides. Deformed cavity also undergoes a rotation depending on loading levels. When the remaining ligament between two cavities is sufficiently small, direct interaction between the two cavities is essential and cannot be neglected. The plastic flow in the ligament causes the fracture by plastic shear (instability). The achievement stage of coalescence of the cavities is assumed to define the initiation of a macroscopic crack. The macroscopic crack propagation is then a succession of stages of coalescence occurring in the structure until the complete fracture.
Shear loading
(a)
(b)
(c)
Figure 5: Evolution of germination and growth mechanisms: (a) germination by decohesion of inclusion, (b) germination by decohesion and fragmentation of inclusion, (c) germination by
fragmentation of inclusion
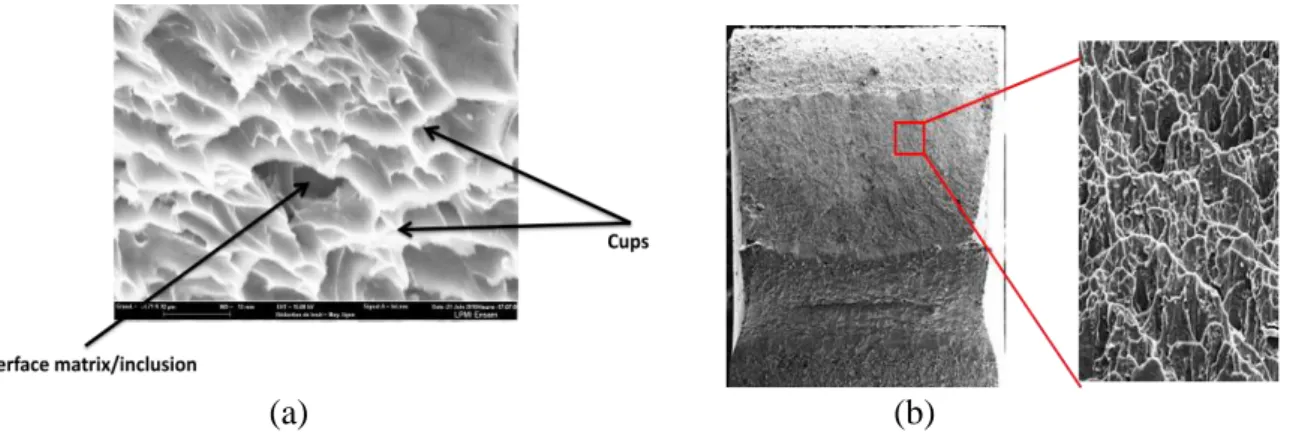
Fracture surface. Examination of fracture surfaces with sufficient magnification (Figure 6-a) shows the strong presence of cups within which are located inclusions, which confirms the ductile damage case. The elongation of voids on the surface shear is shown in Figure 6-b.
(a) (b)
Figure 6: Fracture surface: (a) ductile damage, (b) elongation of voids on the fracture section Numerical analysis
Previous research has tended to investigate micro-void sheets in terms of growth and coalescence in the plane of maximum shear during tensile loading. In that case the dominant stress state within the void sheet is one of shear; however a significant positive triaxiality still exists locally which explains the ease with which micro-voids grow and coalesce. This fails to explain how a micro-void sheet can cause failure in an alloy subjected to zero triaxiality loading conditions, as was observed experimentally in previous sections, in which case the local triaxiality remains extremely low. In the current study we simulate the experimental conditions with the goal is to understand the micro-void interaction mechanism under zero triaxiality and the resulting shear instability i.e. a micro-void shear localization process. This is achieved by directly modeling the nucleation, growth and
coalescence of interacting micro-voids under shear-loading conditions through a computational cell modeling technique.
In previous papers [12, 13], a similar high strength steel was investigated. However the authors were unable to simulate a terminal shear localization process arising at the scale of the secondary particles, perhaps because the system of particles being examined was constructed using average particle spacing data. In this section, a cell of two particles has been simulated in order to observe the interaction between the cavities nucleated. The effect of the relative position of inclusions has been studied. The finite element analysis software used in this study is ABAQUS Standard.
2D analysis of inclusion-matrix decohesion. A cellular model introduced by Figure 7 has been studied to determine the behavior of matrix-inclusion decohesion by conducting a finite element analyses of a cell square formed a matrix containing an inclusion of radius 1.9 microns. The cell is subject to a condition imposed macroscopic stress shear. The matrix material used in the finite element analysis has properties elastic, which are identical to properties steel, a Young's modulus E= 210 GPa and a Poisson's ratio = 0.3. However, properties of the material are those of S500MC steel. Hence, assuming isotropy with respect to plastic yielding a model of the matrix material, chosen in this study, obeys a power-law hardening, for which the plastic portion of the true stress– plastic strain curve is fitted to the following function:
σ = 563 + 584εp0.5 (1) Parameters of this law have been identified by the inverse method using experimental data from a uniaxial tensile test.
The material used is the inclusion of elastic properties, which are identical to the properties of alumina Al2O3, including a Young's modulus E = 390 GPa and a Poisson's ratio = 0.3.
(a) (b) (c)
Figure 7: The 2D plane strain unit cell after inclusion-matrix decohesion: (a) assumed type of boundary conditions, (b) shear strain contour, (c) shear stress contour.
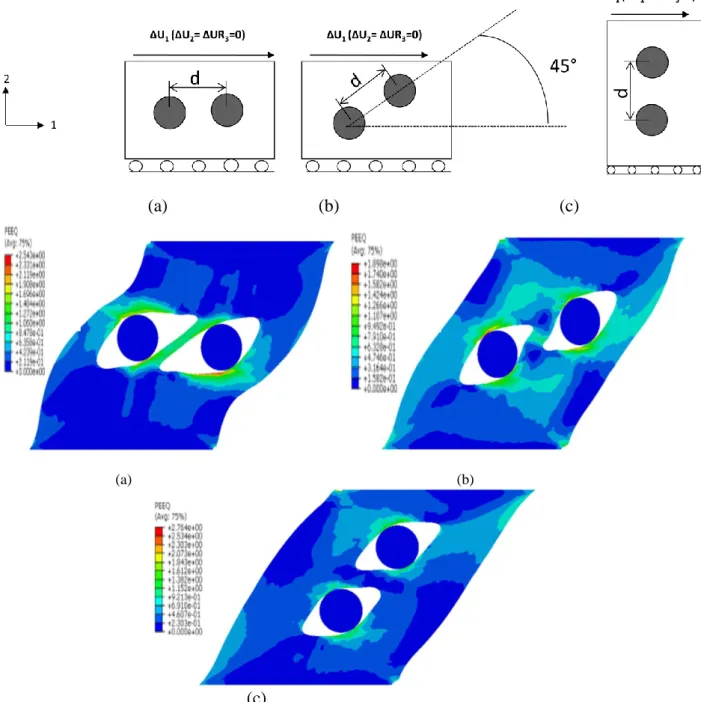
Growth and interaction between cavities. To construct a more realistic model of the possible interactions between particles during shear and orientation effect of ligament with the loading direction, a 2D plane strain analysis of a random particle cluster is undertaken. The particle radii are 1.9 microns. The alloy matrix is again modeled using a power-law hardening data used in previous section. Approximately 100 elements were used along the periphery of each particle to avoid mesh distortion effects at large deformations. The goal is to predict the behavior of equivalent strain in the ligament and around cavities in each case as shown in Figure 8, using the same mechanical properties in the previous section. Indeed, the strain field is higher with the angle between ligament and direction shear loading. Each cavity is elongated at 45° in the shear plan. In Figure 8-b, the top of a cavity is aligned with the bottom other and tend to join.
(a) (b) (c)
(a) (b)
(c)
Figure 8: Numerical simulation of interaction between cavities: (a) inclusions parallel to the loading direction, (b) inclusions at 45 ° to the loading direction, (c) inclusions perpendicular to the
loading direction. The distance d is constant in three configurations.
Conclusion
The proposed study has been used to qualify and understand the physical mechanisms of damage under low stress triaxiality in HSLA steels. Experimentally, using in situ shear tests in the SEM, we were observed the evolution of microstructure. At the interface matrix- inclusion (alumina), we were found two modes of nucleation: matrix-inclusion decohesion or inclusion fragmentation and it depends on the position inclusion in shear zone where stresses are more localized. The growth of cavities by the fact elongation at 45 ° in the shear plan forming of sharp corners on each side of the cavity. After, cavities tend to join them on one hand and established with microcracks in the matrix, resulting slip bands, on the other hand, it’s the coalescence mechanism. These mechanisms have been numerically simulated in 2D under the assumption of plane strain to determine the behavior around the cavities and ligament at them for different initials configurations of the inclusions in the shear plan.
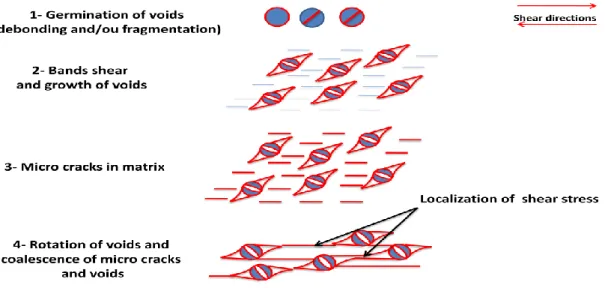
At the end we can conclude the full damage process evolution under shear loading (Fig. 9). This study is useful in the context of development, in progress, a micromechanical damage model adjusted with low triaxiality loading.
Figure 9: Schematic of the damage process observed in shear References
[1] J. Sarkar, T.R.G. Kutty, K.T. Konlon, D.S. Wilkinson, J.D. Embury and D.J. Lloyd: Mater. Sci. Eng. Vol. 316 (2001), p.52–59.
[2] M.F. Horstemeyer, S. Ramaswamy and M. Negrete: Mech. Mater. Vol. 35 (2003), p. 675–687. [3] F.M. Beremin: Metall. Trans. Vol. 12A (1981), p. 723–731.
[4] B.Verhaege, F. Louchet, Y. Brechet and J.P. Massoud:. Acta Mater Vol. 45 (1997), p. 1811– 1819.
[5] M. Manoharan and J.J. Lewandowski: Scripta Metall Vol. 23 (1989), p. 1801–1804. [6] J.R. Rice and D.M. Tracey: J. Mech. Phys. Solids Vol. 17 (1969), p. 201–217. [7] B.J. Lee and M.E. Mear: J. Mech. Phys. Solids Vol. 40 (1992), p. 1805–1836.
[8] M.F. Horstemeyer, M.M. Matalanis, A.M. Sieber and M.L. Botos: Int. J. Plast. Vol. 16 (2000), p. 979–1015.
[9] A.L. Gurson: J. Eng. Mater. Technol. Vol. 99 (1977), p. 2–15.
[10] A.A. Benzerga, J. Besson and A. Pineau: Acta Mater. Vol. 52 (2004), p. 4639–4650. [11] A.R. Ragab: Engng. Fract. Mech. Vol. 71 (2004), p.1515.
[12] S. Hao, B. Moran, W.K. Liu and G.B. Olson: J. Comput.-Aided Mater. Des. Vol. 10 (2003), p. 99–142.
[13] S. Hao, W.K. Liu, B. Moran, F. Vernerey and G.B. Olson: Comput. Methods Appl. Mech. Eng. Vol. 193 (2004), p.1865–1908.
[14] E. Soppa, S. Schmauder, G. Fischer, J. Brollo and U. Weber: Computational Materials Science Vol. 28 (2003) p: 574–586.