Science Arts & Métiers (SAM)
is an open access repository that collects the work of Arts et Métiers Institute of
Technology researchers and makes it freely available over the web where possible.
This is an author-deposited version published in:
https://sam.ensam.eu
Handle ID: .
http://hdl.handle.net/10985/14436
To cite this version :
Pablo WILSON, Nicolas SAINTIER, Thierry PALIN-LUC, Sebastien BERGAMO - Isothermal
fatigue damage mechanisms at ambient and elevated temperature of a cast Al-Si-Cu aluminium
alloy - International Journal of Fatigue n°121, p.112-123 - 2019
Any correspondence concerning this service should be sent to the repository
Administrator :
archiveouverte@ensam.eu
is an open access repository that collects the work of Arts et Métiers ParisTech
researchers and makes it freely available over the web where possible.
This is an author-deposited version published in:
https://sam.ensam.eu
Handle ID: .
http://hdl.handle.net/null
To cite this version :
Nicolas SAINTIER - Isothermal fatigue damage mechanisms at ambient and elevated
temperature of a cast Al-Si-Cu aluminium alloy - International Journal of Fatigue n°121, p.112-123
- 2019
Any correspondence concerning this service should be sent to the repository
Administrator :
archiveouverte@ensam.eu
Isothermal fatigue damage mechanisms at ambient and elevated
temperature of a cast Al-Si-Cu aluminium alloy
Pablo Wilson
a,b, Nicolas Saintier
a,⁎, Thierry Palin-Luc
a, Sebastien Bergamo
baArts et Metiers ParisTech, I2M bordeaux, CNRS, Esplanade des Arts et Metiers, 33405 Talence, France bRenault S.A.S, 1 avenue du Golf, 78280 Guyancourt, France
A R T I C L E I N F O Keywords:
Aluminum alloys Low-cycle fatigue High temperature testing Tomography
Casting defects
A B S T R A C T
Cast aluminium alloys have a key position as structural materials for the automotive industry combining good mechanical performance, excellent castability and thermal conductivity, making them a suitable choice for engine parts such as cylinder heads. In this paper, the low-cycle fatigue behaviour of a cast aluminium alloys is investigated at ambient and elevated temperatures by the use of in situ optical surface crack monitoring, sec-ondary electron microscopy and X-ray tomography which are combined to study the fatigue mechanisms. The observations highlight the effect of defect distribution and temperature on the crack propagation path and in particular the change of the role of eutectic regions as the temperature increases. In addition, based on the defects population analyses by tomography, a fatigue crack initiation model is proposed to consider both temperature and defect effects on the total low-cycle fatigue life and fatigue crack growth rates.
1. Introduction
Cast aluminium alloys have been widely used in industry for many years. They present good mechanical performance along with excellent castability and thermal conductivity[1], making them a suitable choice for engine parts such as cylinder heads[2,3]. Their low specific mass also makes them an interesting choice regarding reduction of energy consumption, a paramount criterion in the development of new pro-ducts.
When used in cylinder head components, the material can undergo temperatures up to 250 °C. These high temperatures, associated with the constraints caused by the structure, submit the intervalve section to thermo-mechanical fatigue (TMF) and low-cycle fatigue (LCF). Secondary Dendritic Arm Spacing (SDAS)[4,5], Iron content[6,7]and heat treatment[8]are some of the main parameters that can be opti-mized to tailor the mechanical and fatigue behaviour of an aluminium alloy.
However, the casting process causes material defects: these can be induced by gas presence during the casting producing gas porosities defects, or by local heterogeneities in the material cooling, known as shrinkage defects[9]. The different processes generate different defect sizes and concentrations: compared to the gravity mold casting used in this study, the Hot Isostatic Pressing (HIP) process highly reduces porosity [10], while Lost Foam Casting increases the microstructure
scale and the porosities size and number.
For low-cycle fatigue, these defects are of critical importance. Various studies[11–13] have shown not only the size, but also the location, of the defects are the main factors for fatigue crack initiation mechanisms. More recently, use of in situ X-ray synchrotron tomo-graphy[14,15]has made studies of the kinetics of 3D crack propaga-tion possible on Lost Foam Casting specimens.
In this study, a series of low-cycle fatigue tests are conducted (with or without artificial defects). Particular attention is given to the crack propagation mechanisms by the use of secondary electron microscopy,
in situ surface observation and X-ray tomography which are combined
together. The systematic observations of fracture surfaces provide in-sight on the critical aspects of crack initiating defects (size and location) as well as the effect of temperature increase on crack propagation mechanisms. Finally, a crack propagation model is used to predict the number of cycles to failure based on strain energy quantities and defect size.
2. Experimental procedure
2.1. Material and composition
The material used in this study is an Al-Si-Cu (Aluminium-Silicon-Copper) based aluminium alloy. The nominal composition is shown in
⁎Corresponding author.
E-mail address:nicolas.saintier@ensam.eu(N. Saintier). https://doi.org/10.1016/j.ijfatigue.2018.11.016
Received 5 September 2018; Received in revised form 12 November 2018; Accepted 13 November 2018
Table 1. The specimens are cast in 2 cm diameter and 20 cm length round bars. These bars then undergo a T5 thermal treatment: after casting, they are cooled by forced air current, and then artificially aged for approximately 5 h at 230 °C.
The microstructure exhibits dentritic solidification shown inFig. 1. The secondary dendritic arm spacing (SDAS) is measured over 1 mm2in
the center of the round bar, corresponding to the fatigue tested zone. Table 2shows the observed mean SDAS value equal to 24µm (mea-sured on 102 values), which is among the values observed in the lit-erature for similar casting process[16]. The casting process of the bars was specifically tailored in order for the SDAS to be relatively low and reproduce high cooling rates locations in components.
2.2. Fatigue testing
Fatigue tests are performed on cylindrical low-cycle fatigue speci-mens (seeFig. 2). The active zone is a 7 mm diameter and 14 mm height cylinder. A 12 mm gauge class 0.5 extensometer is used to perform strain controlled tests. Fatigue tests are performed through an Instron® 8500 servo-hydraulic machine equipped with a high-temperature MTS® furnace. The strain imposed signal waveform is triangular as to main-tain a constant strain-rate ( ) of1.10 s3 1 at strain amplitudes ( /2)
ranging from ± 0.2% to 0.4%, and strain ratioR = 1. Surface rough-ness of all the specimens (arithmetic average of absolute values) is set lower than Ra=0.8 µm. For specimens observed during crack mon-itoring experiments, the surface is further polished up to 0.5µm using diamond paste. Tests are conducted under 4 different controlled tem-peratures: 20 (ambient), 150, 200 and 250 °C. The number of cycles to failure is defined by a 10% drop from the trend line of the maximum stress per cycle.
2.3. Surface observation and crack monitoring
Artificial microdefects were machined at the surface of some spe-cimens to follow crack propagation more easily. An hemisphere of 400µm was machined by electro discharge.Fig. 3(a) shows micro de-fect in the middle part of a test specimen, whileFig. 3(b) shows SEM image used to measure the micro defect diameter before fatigue testing. All diameters are in the interval [359–401µm]. For later crack propa-gation calculations, the measured value is used avoiding part of the bias caused by the scatter in the microdefect sizes.
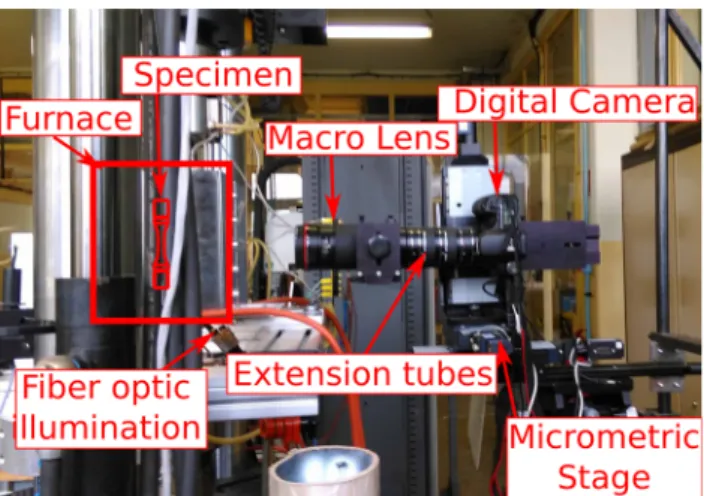
To monitor the crack propagation, the digital camera was syn-chronized with the test rig and a picture was taken for each cycle at the maximum load, therefore maximizing the crack opening (seeFig. 4). Special care is taken as to obtain high quality pictures during crack propagation over a large surface of the cylindrical specimen. While standard direct illumination can be used to observe flat area, such as for SENT specimens, indirect illumination is here used and allows us to monitor crack propagation on standard LCF cylindrical specimens: the walls of the furnace are illuminated, and the reflection of the walls on the specimen are captured by the camera. Compared to direct illumi-nation, this method avoids a glare effect caused by the specimen cur-vature. The camera settings are set to minimize the motion blur while maximizing signal to noise ratio (Canon EOS 40D, Canon EF 180 mm f/ 3.5L Macro USM Macro lens, f /8, 1/13s, iso 1000). An image treatment is then applied. Firstly, all the pictures are registered to the first one thereby eliminating slight translations between pictures. Secondly, an averaging is done over sequential images: considering time (i.e. cycles) as the third dimension, a Gaussian filter of standard deviation 6 time unit (i.e. 6 cycles) is applied. The image enhancement obtained can be seen inFig. 5: the crack path can clearly be identified with respect to the microstructure. For the last cycles, when the crack tip propagation is too fast and image averaging causes blur, the raw data images are considered. The observation setup allows for microstructure observa-tion of an approximate area of 33 mm2(the 11 mm height is limited by
the sensor size, whereas the 3 mm width is limited by the depth-of-field).
2.4. Tomography analysis
Tomography observations of failed specimens (after significant loss of global stiffness or after final failure) are done on a General Electrics® phoenix X-ray Nanotom® at Renault SAS (Guyancourt, France). Using 2 h scans, a voxel of 4.8 × 4.8 × 4.8µm is obtained. A non-local means filter using Avizo®software is applied to enhance image quality.
3. Fatigue damage mechanisms
3.1. Classification of crack initiating defects
For all the test conditions (27), crack initiation always appears on casting defects. Four types of defects are identified (Table 4summarizes Table 1
Cast alloy measured composition.
Si Cu Mg Ti Fe Mn Zn Ni Al
Measured (w%) 7.86 3.18 0.33 0.14 0.34 0.23 0.35 0.04 Balance
Fig. 1. Optical microstructure of specimen and SDAS measurement.
Table 2
Secondary Dendritic Arm Spacing measurements.
Quantity Value (µm)
mean 24
max 38
min 16
standard deviation 5
the defect at crack initiation for each loading condition):
•
Gaz porosity: large gaz porosities (>100µm) were are close to the specimen surface.Fig. 6a shows such a defect identified by micro-tomography, revealing the crack initiates around the mid plane of the defects, where the stress concentration factor is the highest.•
Casting shrinkage: large shrinkages (>100µm) are also found closeto the specimen surface (seeFig. 6(b)). The convolutions caused by the shrinkage imply a lower defect sphericity and high acuteness.
•
Defect cluster: also located close to the specimen surface, theyap-pear larger than isolated defects (>500µm). Fig. 6(c) displays a cluster of defects that caused the main crack initiation. In this case, rigorous measurement of the defect size cannot be achieved (the frontiers of the cluster being unclear).
•
Large oxides: in three cases, large oxides are revealed on the fractureFig. 3. Test setup of crack monitoring specimens.
Fig. 4. Crack propagation monitoring setup.
Fig. 5. Image treatment of crack propagation monitoring (a) raw image, (b) after image processing.
surface by optical microscopy (seeFig. 6(d)). No special test con-dition (imposed strain or temperature) reveals this type of initiation. These oxides are a consequence of the casting process (no oxide filter is used before casting, whereas these filters are present for real component casting). Therefore, these tests are not taken into ac-count for the rest of this study.
3.2. Defect size measurement
In order to systematically measure defects size, SEM images are manually binarized.Fig. 7shows such an example of image processing. While more robust, automatized treatments are here unable to identify defects, hence a manual process is used.
After binarization, the resulting images are treated using particle analysis to measure the Feret diameter (as is shown inFig. 7a). As-sumptions or limitations can be made concerning this measurand (de-picted inFig. 7a):
•
defect type: given the small statistical sample, no distinction is made between gas porosities and shrinkage defects, and these defects are considered only with respect to their size.•
2D aspect: surface topography is not strictly horizontal in the crack initiation area and either perpendicular to the loading direction. Some surfaces appear to link surfaces of different mean heights (see ”a” inFig. 7a) indicating the 3D nature of the surface. Therefore, the different quantities are measured on the 2D projection of the sur-face. However, the height differences appear limited and the effect of projection negligible.•
surface intersection: the original microstructural defect size can appear to be sliced by the specimen initial machining (see ”b” in Fig. 7a). The measurand can therefore be smaller than the initial as-cast defect.•
defect coalescence: some boundaries are unclear, and possible defect clustering can make identification complicated (see ”c” inFig. 7a, which could be considered as the boundary between 2 defects). Despite those difficulties, the Feret diameter is here considered as representative of the defect size and measured for each crack initiating defect. For all defects both SE and BSE images were used to un-ambiguously identify defects limits. Feret diameters (for gas and shrinkage porosities) are between 127 and 415µm (seeTable 4). The empirical cumulative defect size distribution is presented inFig. 9a Fig. 6. Crack initiation on defects: classification.together with the two best distribution fittings among a wide range of tested distributions.
The first defect size distribution is the log-normal whose probability density function (PDF) flognis:
= > f ( )x 1 x µ x 2 exp (ln ) 2 , 0 logn logn logn logn 2 2 (1) whereµlognis the location parameter and lognthe scale parameter. The log-normal distribution is defined only for positive values.
The generalized extreme values distribution PDF fgevis given by:
= + + fgev( )x 1 1 x µ exp 1 x µ gev gev gev gev gev gev gev gev gev ( 1/ ) 1 1/ (2) where µgevis the location parameter, gev> 0the scale parameter and gevthe shape parameter. The distribution fittings are done by maximum likelihood estimation (MLE). The results displayed inTable 3show that both distributions provide an equivalent fit. Using a larger statistical sample (i.e. more fatigue tests) could help discriminate between the two statistical distributions.
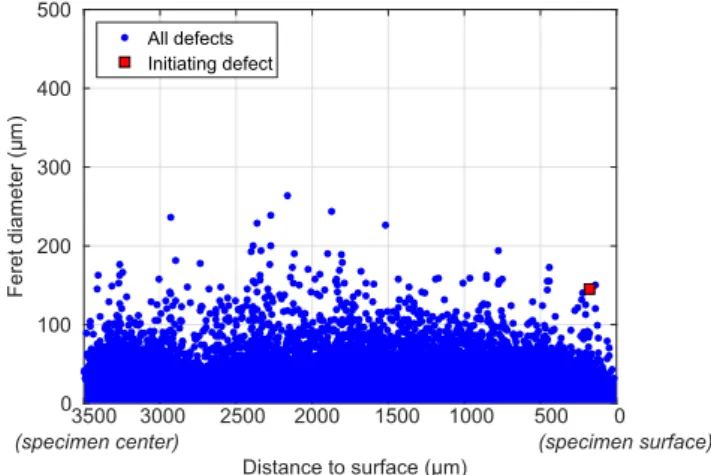
Beside the defect size, the defect location with respect to the spe-cimen surface is known to have an impact on fatigue life (see for ex-ample[17]for LCF and[18]for multliaxial high-cycle fatigue). In order to assess the effect of the distance of the defect to the specimen surface, a fatigue test was interrupted before final failure and observed by to-mography. The critical defect size was compared to the total population of defects. Given the small crack opening, the crack initiating defect could be identified and the 3D Feret diameter still be measured (see example inFig. 6(b)). Distance to the surface was measured from the closest edge of the defect to the specimen surface (seeFig. 9). Using this method, the distance to the surface of a defect intersecting the specimen surface is equal to 0. Results are shown in Fig. 8where the critical defect is highlighted compared to the global defects population. Even though the crack initiating main defect is amongst the largest ones (150µm), other defects located further from the specimen surface are
larger in size illustrating the fact that the defect size is not the critical parameter to identify the crack initiating defect: both size and defect location have to be considered.
The criticality of defect location is confirmed by observing fracture surfaces of all LCF tests. Histogram9b shows distance to surface for identified defects (gas, shrinkage and cluster defects). 13 of the 20 in-itiation defects occur at or very close to specimen surface, and all are less than 260µm from the specimen surface, confirming previous ob-servation from tomography data: defect size and location (noticeably with respect to the free surface) combined analysis has to be done in order to assess the defect criticality.
3.3. Crack propagation mechanism
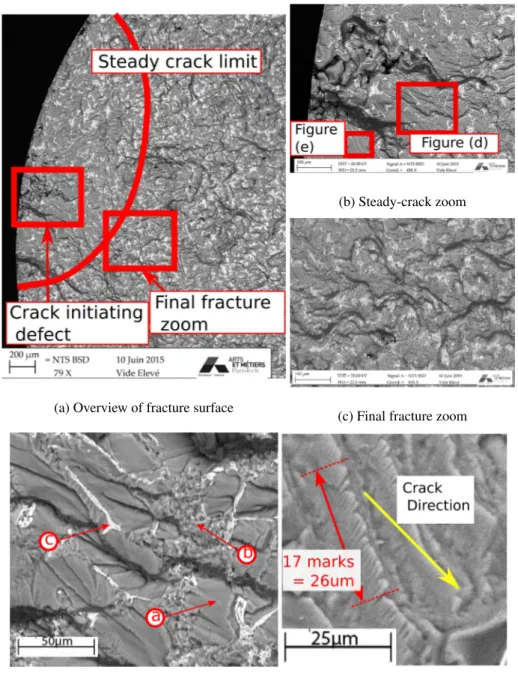
Fatigue crack propagation features are detailed depending on crack propagation regime. Detailed mechanisms are illustrated on specimen 87T5 ( /2= ±0.3%). Firstly, Fig. 10a gives us an overview of the fracture surface by SEM.
The crack propagation can be separated in two or three main parts.
Crack initiation (Fig. 10b). While unclear at higher temperatures, relatively lower temperature tests show a first propagation stage that can be differentiated from the subsequent steady-crack propagation. During this first crack initiation, several cracks develop along the re-gions of highest stress concentrations around large defects (as was seen in[14]or[19]). However, these regions of high stress concentration are not necessarily in the same horizontal plane (i.e. the plane
Fig. 7. Manual identification of defects. (specimen 87T5, /2= ±0.30%, 20 °C,R = 1,Nf=2904).
Table 3
Defect distribution fitting.
Distribution Parameters Log-likelihood GEV: generalized extreme
value gev= 0.0937;µgev=209;gev=74.5 −111.12 LOGN: log-normal
distribution
= =
µln 5.44;ln 0.371 −111.03
Fig. 8. Defect population of cycled specimens: the crack-initating defect is not the largest in the whole volume (Specimen 130T5: /2= ±0.3%, 150 °C,
= =
R 1,Nf 2396cycles). P. Wilson et al.
perpendicular to the loading direction): several cracks, connected by tear ridges, appear to grow outwards of the initiating defects coalescing in a larger and more horizontal elliptic crack.
Steady-crack propagation (Fig. 10d). The initiating porosity defect appears on the left side, and large flat areas perpendicular to the loading direction appear, corresponding to mode I crack propagation. These can better be seen inFig. 10d where 3 morphological features appear: label (a) corresponds to flat regions perpendicular to loading, corresponding to crack propagation in the aluminium dendrites; label (b) is typical of the propagation in the eutectic region; label (c) shows a sliced intermetallic. The propagation in the aluminium dendrites leads to the development of fatigue striations as is indicated inFig. 10e, and confirms observations proposed in[20].
Final fast propagation surface (Fig. 10c). In comparison, the final fast
fracture area exhibits much higher roughness. There are no flat sur-faces, corresponding to dendrite fracture, and a higher number of sliced intermetallics. This shows that the fast fracture preferably propagates through the eutectic regions rather than through aluminium dendrites.
3.4. Effect of test temperature
In comparison withFig. 10d, which is on a specimen tested at 20 °C, Fig. 11displays the steady-crack region for a higher test temperature (200 °C) with an identical imposed total strain amplitude ( /2= ±0.3%). A detailed observation shows the crack propagation occurs in pure mode I at ambient temperature: the crack path is only slightly modified by the microstructure. At higher temperature, as is observed in[21], more tear ridges appear on the fracture surface, these tear ridges occurring mostly in the eutectic regions. This shift in me-chanisms could be attributed to the increased plasticity levels at the crack tip caused by the higher temperatures. Indeed, in front of the crack, strain incompatibility cause the brittle particles (such as eutectic silicon and intermetallics) to fracture. The crack path is then later modified and tends to propagate through these fractured particles (see [14]).
The same comparison can be emphasized inFig. 12where two short fatigue cracks are illustrated. These fatigue cracks probably developed slower than the main crack, observed elsewhere, and show the first stages of crack propagation. The fatigue crack displayed inFig. 12a, at ambient temperature, shows much more aluminium matrix than at higher temperature, where the fracture surface consists mostly of eu-tectic and intermetallic particles (as is shown inFig. 12b). These ob-servation suggest that the temperature significantly modifies the nature of the plastic deformation in the crack tip zone. It is also noteworthy despite the different mechanisms, the total fatigue life (Nf) only slightly decreases with temperature increase for identical imposed total strain. In order to better show the temperature effect on the short crack propagation, surface observations were performed on short fatigue cracks initiated from artificial defects.Figs. 13a–d illustrates the case of crack propagation at ambient temperature (Specimen 76T5:
= ±
/2 0.4%, 20 °C,R = 1, Nf =734) whileFigs. 13e–h illustrates the high temperature case (Specimen 89T5: /2= ±0.4%, 250 °C,
= =
R 1, Nf 701).
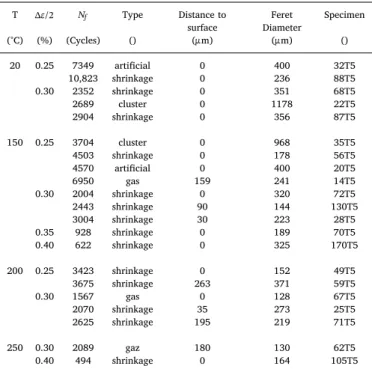
In both cases, secondary crack is observed ahead of the initial crack. For low temperature test, despite some localisation of the deformation Table 4
Defect harmfulness.
T /2 Nf Type Distance to
surface DiameterFeret Specimen
(°C) (%) (Cycles) () (µm) (µm) () 20 0.25 7349 artificial 0 400 32T5 10,823 shrinkage 0 236 88T5 0.30 2352 shrinkage 0 351 68T5 2689 cluster 0 1178 22T5 2904 shrinkage 0 356 87T5 150 0.25 3704 cluster 0 968 35T5 4503 shrinkage 0 178 56T5 4570 artificial 0 400 20T5 6950 gas 159 241 14T5 0.30 2004 shrinkage 0 320 72T5 2443 shrinkage 90 144 130T5 3004 shrinkage 30 223 28T5 0.35 928 shrinkage 0 189 70T5 0.40 622 shrinkage 0 325 170T5 200 0.25 3423 shrinkage 0 152 49T5 3675 shrinkage 263 371 59T5 0.30 1567 gas 0 128 67T5 2070 shrinkage 35 273 25T5 2625 shrinkage 195 219 71T5 250 0.30 2089 gaz 180 130 62T5 0.40 494 shrinkage 0 164 105T5
Fig. 9. Distance of critical defects to the surface.
between the two fatigue cracks, the initial crack does not coalesce with the secondary one and propagates through the aluminium matrix re-sulting in a rather flat fracture surface. The final images (such as is seen inFig. 13d) clearly indicate that, later in the test, the secondary crack closes due to the stress shielding effect induced by the main crack propagation. In the case of high temperature tests however, the artifi-cial defect induced fatigue crack quickly coalesce with the secondary crack through a mode II transition (seeFig. 13c). For the high tem-perature test, two reasons may explain the different observed me-chanisms. Firstly, a significant change in the cyclic plastic zone at the crack tip that could induce a larger interaction range with secondary cracking. Similar crack tip interactions and strain localization at high temperature can be seen in[19]. In addition, this localization may be favoured by a shift in plastic deformation mechanisms with higher temperature: Al-Si-Cu alloys (high-stacking fault energy) are known to exhibit dynamic softening mechanisms, such as dynamic recovery during deformation at elevated temperatures. Cyclic plastic deforma-tion ahead the crack tip may trigger such softening mechanisms and
favour crack interactions.
By analysing a specimen interrupted before final failure by tomo-graphy, defect interaction with crack can be seen inFig. 14for a high temperature test. The method applied is similar to that in[22]: the crack is thresholded and the crack opening displacement (COD) mea-sured by counting the number of voxels belonging to the crack per vertical line l and converting using voxel resolution (seeFig. 14a). It must be noted the opening displacement is measured after testing, implying the specimen is not under tensile loading. In presence of de-fects, the measured displacement is the sum of COD and defect height, causing defects to appear red1on the map. Several defects can be seen
for all crack advances. Especially, for the latter stages of crack propa-gation, defects influence the crack path at larger scales ( 1 mm). This can be seen on the slice (seeFig. 14a) which displays a defect (label (a) inFig. 14) that strongly influences the crack path.
Fig. 10. Crack propagation fracture surface(Specimen 87T5: /2= ±0.3%, 20 °C,R = 1,Nf=2904cycles).
1For interpretation of color in Fig. 14, the reader is referred to the web
version of this article. P. Wilson et al.
4. Fatigue crack growth model
4.1. Fatigue crack growth model
The fatigue crack propagation model is adapted from the model introduced in [23]. The model uses the elastic energy We and the plastic dissipated energy Wpdefined as:
= Wp : dt cycle p (3) = W E T 1 ( )(max(trace )) e cycle 2 (4) with the stress tensor, pthe plastic strain rate tensor and E T( )the Young modulus as a function of the temperature T. The crack model propagation is given by:
= + da dN Wa W a 1 e e e m p p p m e p (5) with e (resp. p) the elastic (resp. plastic) crack geometry effect, e (resp. p) the surface energy associated with elastic (resp. plastic dis-sipated) energy and me (resp.mp) the chosen exponent for the elastic (resp. plastic) part. The parameter is a geometric length used to ra-tionalize the crack increment and can be linked, for example, to the grain diameter. For this study, this length is normalized to = 1 m. Further investigations are needed to precisely evaluate this value. In order to predict the fatigue life of the specimens, the Feret diameter of defects measured on the fracture surfaces is considered as an initial crack lengtha0in a crack-like defect approach. The considered values
of elastic energy Weand plastic dissipated energy Wpare calculated at mid-life. This is possible and realistic because the cyclic behaviour of the studied alloy is quasi-stabilised, even for the higher temperatures. Considering other cycles do not lead to significant differences in com-puted fatigue lives. While it is numerically possible to use all the measured cycles and to calculate the crack propagation cycle per cycle, using constant values for the energies allows for a rapid numerical in-tegration of the ordinary differential equation, needed for the para-meter optimization. The fatigue life Nf of a smooth specimen can be therefore estimated by:
= N da W W a ( , , ) f sim a a da dN e p , f 0 (6)
where af is the final crack length. Given the different lengths of tran-sition to the measured final fracture, an averaged value of =af 3 mmis chosen. It can be noted that, the crack propagation having an
exponential kinetic (seeFig. 17), this final length has little impact on the final result.
In a first approximation, no crack closure is considered in the pro-posed approach. However, for future work, this aspect could be taken into account by using, for example, only the positive part of the stress tensor.
4.2. Parameter optimisation
The parameters of the crack propagation model are optimized based solely on specimens where the natural crack initiating defect is mea-sured (18 specimens). The second half of the data will be used for va-lidation. The number of data used to identify the model could be con-sidered as significant. However, the problem in reducing the data set is that due to the scatter of the fatigue behaviour a sufficient number of data are needed to correctly capture the mean fatigue behaviour. The risk in reducing the data set used to fit the model is to identify model parameters on non representative fatigue data. For this reason the global data set was splited in two parts.
Since all cracks are considered to have the same geometry, the parameters e(resp. p) and e (resp. p) represent the same degree of freedom for the optimisation procedure and, therefore, the parameters
e and pare set equal to 1.
The elastic part of the model can be related to the Paris Law (see [23]): = da dN Wea C K C( a) C a( ) e m m m m2 e (7) Therefore, the elastic parameter esur for a semi-circular surface crack (see[24]) could also be used (consequently modifying the surface energy e):
= 1.122 ×
esur
2
(8) For metallic materials, the exponent m is often close to 4. To be consistent, the exponent meis set to 2 (see Eq.7).
In the end, the optimisation procedure aims at minimizing the cost function f: = f m N N N ( , , ) log log log e p p k f sim k f exp k f exp , , , 2 (9) where Nf simk, is the simulated fatigue life of the k-th experiment and Nf expk, the corresponding experimental value.
4.3. Results
The results of the parameters optimisation are shown inFig. 15(full markers) and the optimised parameters inTable 5. All the results are in the fatigue scatter band ofNf exp, ×2,Nf exp, /2.
The same parameters are used to numerically evaluate the specimen fatigue life where the crack initiating defect is not identified. In those cases, the initial crack length a0 is taken as the median defect size amedianof the experimentally measured defects (only gas and shrinkage defects):
=
amedian 236 µm (10)
The results are presented inFig. 15(empty markers). The model provides good fatigue life estimations for all the temperatures and imposed strains. However, for the highest temperature (250 °C), the model does not seem to capture the propagation kinetic and me-chanism. This could be caused by the shift in propagation mechanism, with the increased plasticity effect, and the lack of measured defects. Indeed, only 2/8 specimens initiating defects are identified at this temperature, causing them to have small impact on the optimized parameters.
Fig. 11. SEM-BSE of fracture surface (Specimen 71T5: /2= ±0.3%, 200 °C,
= =
For most of the data points, the use of the median defect size allows for a conservative prediction of fatigue life.
Lastly, the results of the crack propagation monitoring experiments are compared to the model. Results are presented in Fig. 16. As is
observed previously, high temperature (250 °C) crack propagation rate is overestimated by the model for two specimens (89T5 and 29T5), but it still captures the right order of magnitude and appears to be con-servative, making the model suitable for design purposes. For the two Fig. 12. Effect of temperature on steady-crack propagation at 20 °C and 200 °C: small cracks (note that both figures use the same scale).
other specimens (76T5 and 20T5) at ambient temperature, the crack propagation rate is accurately predicted.
For the crack propagation experiments, the discrepancy for higher temperature could also be caused by the crack arrest: the monitored cracks do not cause final failure, and the main crack causes local un-loading in the specimen towards the end of the test.
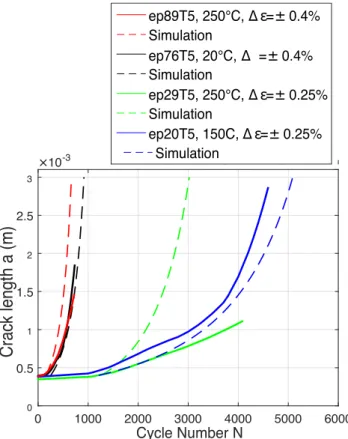
Crack length simulation is shown inFig. 17. The initial defect length is taken as the measured hemispherical defect diameter (around 400µm). The crack propagation model does not take into account the initiation period, and the experimental measured values of cycles to initiation (Ninit) are therefore used for both simulated and experimental crack propagation data (i.e. the simulated crack propagation only starts at (Ninit) inFig. 17). The simulated crack length are in good agreement with the observed data except for the high-temperature (250 °C) low strain ( /2= ±0.25%) experiment, which still remains conservative.
5. Conclusions
In this study, the damage mechanisms in low cycle fatigue of a cast aluminium are investigated. By combining the different available ob-servation techniques available (SEM, crack monitoring and tomo-graphy), several results are found:
•
For ambient and high temperatures, cracks initiate on casting de-fectsFig. 13. Crack propagation monitoring. Figures (a)–(d): branching crack mechanism (Specimen 76T5: /2= ±0.4%, 20 °C,R = 1, Nf=734 cycles). Figures
(e)–(h): coalescence crack mechanism (Specimen 89T5: /2= ±0.4%, 250 °C,R = 1, Nf=701cycles).
Fig. 14. Crack opening displacement and defect interaction. (specimen 62T5, /2= ±0.3%, 250 °C,R = 1, Nf=2089cycles).
Fig. 15. Numerically predicted fatigue life as a function as experimentally measured for all specimens. Marker area is proportional to Feret diameter, the marker in the legend corresponding to 100 µm. Full markers are used for model identification while empty ones are used for validation for unmeasured defects.
•
The damage mechanisms can be divided in three steps: (1) cracks initiate on natural defects that act as stress concentrators, (2) steady-crack propagation with little interaction with microstructure, (3) final failure with strong interactions with the microstructure.•
The increase in temperature increases the material plasticity, and favours the propagation through eutectic regions, thereby rough-ening the surface fracture.•
The natural defect size has to be considered together with the defect position in order to assess the defect criticity.•
Defect interactions: the natural defects can interact with each other (thereby creating clusters), can create small cracks which interact with each other (crack coalescence) and/or can interact with the final crack propagation stage.•
Using a crack-like defect approach, the measured defects can be used as an initial crack size for a crack propagation model and the specimens life estimated. The use of elastic and plastic strain energy in the simulation of crack propagation allows for a good correlation with the experimental data (of fatigue life of specimens, as well as of crack-propagation rates of crack-monitoring experiments).•
Further analyses of the local fatigue crack propagation ratesmea-sured from striations should help to further evaluate and understand the combined effects of microstructure and temperature on the macroscopic fatigue life.
For further studies, the observed initiating defects will be compared to the statistical distributions of defects inferred from tomography data of virgin specimens.
Then, the different interactions between defects and cracks could be further investigated and simulated. Especially for the higher tempera-tures, these interactions appear crucial to understand the observed crack surfaces.
Appendix A. Supplementary material
Supplementary data associated with this article can be found, in the online version, athttps://doi.org/10.1016/j.ijfatigue.2018.11.016.
References
[1] Mondolfo LF. Aluminium alloys, structure and propreties. Butterworths; 1976. [2] Thomas JJ, Verger L, Bignonnet A, Charkaluk E. Thermomechanical design in the
automotive industry. Fatigue Fract Eng Mater Struct 2004;27(10):887–95.https:// doi.org/10.1111/j.1460-2695.2004.00746.x.
[3] Smith TJ, Sehitoglu H, Fleury E, Maier HJ, Allison J. Modeling high-temperature stress-strain behavior of cast aluminum alloys. Metall Mater Trans A
1999;30(1):133–46.https://doi.org/10.1007/s11661-999-0201-y.
[4] Atzori B, Meneghetti G, Susmel L. Fatigue behaviour of AA356-T6 cast aluminium alloy weakened by cracks and notches. Eng Fract Mech 2002;72:759–68.https:// doi.org/10.1016/S0013-7944(03)00036-5.
[5] Firouzdor V, Rajabi M, Nejati E, Khomamizadeh F. Effect of microstructural con-stituents on the thermal fatigue life of A319 aluminum alloy. Mater Sci Eng: A 2007;454–455:528–35.https://doi.org/10.1016/j.msea.2007.01.018. [6] Yi J, Gao Y, Lee P, Lindley T. Effect of Fe-content on fatigue crack initiation and
propagation in a cast aluminum–silicon alloy (A356-T6). Mater Sci Eng A 2004;386(1-2):396–407.https://doi.org/10.1016/s0921-5093(04)00964-5. [7] Ovono-Ovono D. Recyclabilité des alliages d’aluminium de fonderie: influence des
éléments résiduels sur la microstructure et le comportement mécanique [Ph.D. thesis]. France: Université de Technologie de Compiègne; 2004.
[8] Azadi M, Shirazabad MM. Heat treatment effect on thermo-mechanical fatigue and low cycle fatigue behaviors of A356.0 aluminum alloy. Mater Des 2013;45:279–85.
https://doi.org/10.1016/j.matdes.2012.08.066.
[9] Casting Design and Performance. ISBN: 978-0-87170-724-6 Edition. ASM International; 2009.
[10] Atkinson HV, Davies S. Fundamental aspects of hot isostatic pressing: an overview. Metall Mater Trans A 2000;31(12):2981–3000. https://doi.org/10.1007/s11661-000-0078-2.
[11] Gao YX, Yi JZ, Lee PD, Lindley TC. The effect of porosity on the fatigue life of cast aluminium-silicon alloys. Fatigue Fract Eng Mater Struct 2004;27(7):559–70.
https://doi.org/10.1111/j.1460-2695.2004.00780.x.
[12] Mo D-F, He G-Q, Hu Z-F, Liu X-S, Zhang W-H. Effect of microstructural features on fatigue behavior in A319-T6 aluminum alloy. Mater Sci Eng: A
2010;527(15):3420–6.https://doi.org/10.1016/j.msea.2010.02.055. [13] Buffière J-Y, Savelli S, Jouneau P, Maire E, Fougères R. Experimental study of
porosity and its relation to fatigue mechanisms of model Al–Si7–Mg0.3 cast al al-loys. Mater Sci Eng: A 2001;316(1-2):115–26. https://doi.org/10.1016/s0921-5093(01)01225-4.
[14] Dezecot S, Buffiere J-Y, Koster A, Maurel V, Szmytka F, Charkaluk E, et al. In situ 3D characterization of high temperature fatigue damage mechanisms in a cast alu-minum alloy using synchrotron x-ray tomography. Scr Mater 2016;113:254–8.
Table 5
Crack propagation model parameters.
Parameter Value
e 1.08×10⁶
me 2 (fixed)
p 28.3×10⁶
mp 1.201
Fig. 16. Experimental (markers) and model (lines) crack propagation rates versus crack length.
Fig. 17. Experimental (full line) and simulated (dashed line) crack length as a function of the number of cycles.
https://doi.org/10.1016/j.scriptamat.2015.11.017.
[15] Wang L, Limodin N, El Bartali A, Witz J-F, Seghir R, Buffiere J-Y, et al. Influence of pores on crack initiation in monotonic tensile and cyclic loadings in lost foam casting A319 alloy by using 3D in-situ analysis. Mater Sci Eng: A 2016;673:362–72.
https://doi.org/10.1016/j.msea.2016.07.036.
[16] Shabestari S, Moemeni H. Effect of copper and solidification conditions on the microstructure and mechanical properties of Al-Si-Mg alloys. J Mater Process Technol 2004;153-154:193–8.https://doi.org/10.1016/j.jmatprotec.2004.04.302. [17] De-Feng M, Guo-Qiua H, Zheng-Feia H, Xiao-Shana L, Wei-Huab Z. Effect of
mi-crostructural features on fatigue behavior in A319-T6 aluminum alloy. Mater Sci Eng A 2010;527:3420–6.
[18] Le V-D, Morel F, Bellett D, Saintier N, Osmond P. Multiaxial high cycle fatigue damage mechanisms associated with the different microstructural heterogeneities of cast aluminium alloys. Mater Sci Eng: A 2016;649:426–40.https://doi.org/10. 1016/j.msea.2015.10.026.
[19] Dahdah N, Limodin N, El Bartali A, Witz JF, Seghir R, Charkaluk E, et al. Damage investigation in A319 Aluminium alloy by X-ray tomography and digital volume
correlation duringin situhigh-temperature fatigue tests. Strain 2016;52(4):324–35.
https://doi.org/10.1111/str.12193.
[20] Song M, Kong Y, Ran M, She Y. Cyclic stress-strain behavior and low cycle fatigue life of cast A356 alloys. Int J Fatigue 2011;33(12):1600–7.https://doi.org/10. 1016/j.ijfatigue.2011.07.004.
[21] Zhang Q, Zuo Z, Liu J. High-temperature low-cycle fatigue behaviour of a cast Al-12Si-CuNiMg alloy. Fatigue Fract Eng Mater Struct 2013;36(7):623–30.https://doi. org/10.1111/ffe.12029.
[22] Zhang H, Toda H, Hara H, Kobayashi M, Kobayashi T, Sugiyama D, et al. Three-dimensional visualization of the interaction between fatigue crack and micropores in an aluminum alloy using synchrotron x-ray microtomography. Metall Mater Trans A 2007;38(8):1774–85.https://doi.org/10.1007/s11661-007-9214-6. [23] Maurel V, Rémy L, Dahmen F, Haddar N. An engineering model for low cycle
fa-tigue life based on a partition of energy and micro-crack growth. Int J Fafa-tigue 2009;31:952–61.https://doi.org/10.1016/j.ijfatigue.2008.09.004.
[24] Broek D. Elementary engineering fracture mechanics. Netherlands: Springer; 1986.
![Table 2 shows the observed mean SDAS value equal to 24 µ m (mea- (mea-sured on 102 values), which is among the values observed in the lit-erature for similar casting process [16]](https://thumb-eu.123doks.com/thumbv2/123doknet/7436893.220301/4.892.62.429.108.456/table-observed-values-observed-erature-similar-casting-process.webp)