Science Arts & Métiers (SAM)
is an open access repository that collects the work of Arts et Métiers Institute of
Technology researchers and makes it freely available over the web where possible.
This is an author-deposited version published in: https://sam.ensam.eu Handle ID: .http://hdl.handle.net/10985/15600
To cite this version :
Gabriel MARGALIDA, Antoine DAZIN, Pierric JOSEPH, Olivier ROUSSETTE - Detailed Pressure Measurements During the Transition to Rotating Stall in an Axial Compressor: Influence of the Throttling Process - In: ASME 2018 5th Joint US-European Fluids Engineering Division Summer Meeting, Canada, 2018-07-15 - ASME 2018 5th Joint US-European Fluids Engineering Division Summer Meeting. Flow Manipulation and Active Control; Bio-Inspired Fluid Mechanics; Boundary Layer and High-Speed Flows; Fluids Engineering Education; Transport Phenomena in Energy Conversion and Mixing; Turbulent Flows; Vortex Dynamics; DNS/LES and Hybrid RANS/LES Methods; Fluid Structure Interaction; Fluid Dynamics of Wind Energy; Bubble, Droplet, and Aerosol Dynamics - 2018
Any correspondence concerning this service should be sent to the repository Administrator : archiveouverte@ensam.eu
Science Arts & Métiers (SAM)
is an open access repository that collects the work of Arts et Métiers ParisTech
researchers and makes it freely available over the web where possible.
This is an author-deposited version published in: https://sam.ensam.eu Handle ID: .http://hdl.handle.net/null
To cite this version :
Gabriel MARGALIDA, Antoine DAZIN, Pierric JOSEPH, Olivier ROUSSETTE - Detailed Pressure Measurements During the Transition to Rotating Stall in an Axial Compressor: Influence of the Throttling Process - In: Volume 1: Flow Manipulation and Active Control; Bio-Inspired Fluid Mechanics; Boundary Layer and High-Speed Flows; Fluids Engineering Education; Transport Phenomena in Energy Conversion and Mixing; Turbulent Flows; Vortex Dynamics; DNS/LES and Hybrid RANS/LES Methods; Fluid Structure Interaction; Fluid Dynamics of Wind Energy; Bubble, Droplet, and Aerosol Dynamics, Canada, 2018-07-15 - ASME Proceedings | 13th Symposium on Flow Manipulation and Active Control - 2018
Any correspondence concerning this service should be sent to the repository Administrator : archiveouverte@ensam.eu
DETAILED PRESSURE MEASUREMENTS DURING THE TRANSITION TO
ROTATING STALL IN AN AXIAL COMPRESSOR: INFLUENCE OF THE
THROTTLING PROCESS
Gabriel Margalida
Laboratoire de Mécanique des Fluides de Lille FRE CNRS 2017, Arts et Métiers ParisTech
Lille, France
Antoine Dazin
Laboratoire de Mécanique des Fluides de Lille FRE CNRS 2017, Arts et Métiers ParisTech
Lille, France
Pierric Joseph
Laboratoire de Mécanique des Fluides de Lille FRE CNRS 2017, Arts et Métiers ParisTech
Lille, France
Olivier Roussette
Laboratoire de Mécanique des Fluides de Lille FRE CNRS 2017, Arts et Métiers ParisTech
Lille, France
ABSTRACT
This paper presents experimental unsteady pressure measurements gathered on a single stage axial compressor during pre-stall and transition to stall operations. The aim of this study is to analyze the transition from a stable operating point to the fully developed rotating stall regime, and more specifically, the effect of the throttling process on the development of the instabilities. To do so, experiments have been repeated leading the compressor to stall operations with various throttling speed.
On one hand, this paper analyses the effect of the throttling speed on the dynamic of the instability development from the first detection of spike type precursors to completely developed rotating stall.
On the other hand, a stall warning signal based on the correlation of the instantaneous pressure signal with a reference pressure signal is built. The influence of the location of the pressure transducer used for the warning signal is first analyzed. Then an analysis of the effect of the throttling process on the time between the warning signal and the effective stall development is proposed.
INTRODUCTION
Rotating stall and surge are now well-known problems that have accompanied axial compressors development since the first steps of aero-engines, decades ago. One of the main concerns of these phenomena is the need to use a large security
margin to stay away from the stall and its catastrophic implications. This leads to limitations on the operating range of compressors and on the maximum of pressure ratio they can reach.
All along the development of aero-engines and the study of the stall phenomenon, several discoveries have been made, each one of them rising new questions and highlighting new ramifications of the problem, from surge to rotating stall, then to precursors. “Modal” type precursors were first considered, later followed by “spike” type ones [1]. Different approaches to grasp the problem have been adopted over the years and the interest has shifted periodically from physics understanding of the phenomenon to stall warning [2, 3] and stall control, both passive [4] and active [5, 6, 7]. To illustrate the potential gains from Surge Margin Improvement (SMI) associated to stall control research, one can cite the recent works of Tahara et al. [8]. They stated that a reduction from 20% to 10% of the required surge margin would “results in a two-stage reduction of a ten-stage compressor”. In this challenging times where every kilograms matters, this is an attractive offer.
Most of the contemporary work is divided in two parts. On one hand, recent investigations carried out by Inoue et al. [9] or Pullan et al. [10] for example, have exhibited new types of prestall events. Some of them are visible long before stall and known as rotating instabilities, when other ones are more elusive, appear directly prior to spikes and are referred as tornado-like vortex. They have also linked them to the interaction between the incoming flow and the tip leakage flow [11]. However, this subject is still largely discussed among the
scientific community regarding its source or its precise characteristics.
On the other hand, the need to develop a method producing an early indicator of the stall approach drives researchers to work on new detection methods. Tahara et al. [8] then Dhingra et al. [3] and Christensen et al. [12] proposed for example to use local correlation calculations to detect changes in the pressure signature of blade passages.
The first objective of this paper is to come back to the root of the problem and to study the onset of the rotating stall. The influence of the throttling process is examined in particular. Despite being a common technic to promote stall in axial compressor test benches, throttling process is often barely described neither studied. This part of the paper presents also some original findings, shedding a new light on the link between spikes and rotating stall.
The second objective of this work is to consider the correlation method as described by Tahara et al. [8] for stall warning purpose and to study its behavior with different throttling parameters.
These results were gathered on the CME2 compressor test rig belonging to the Lille Laboratory of Fluid Mechanics (ENSAM Lille), which is described on Section 1, along with the experimental procedure. Influence of the throttling speed on the transition from spike to rotating stall is then considered in Section 2. Section 3 presents finally the effect of this throttling parameter on the correlation coefficient with the perspective of a closed loop control of the stalling process.
EXPERIMENTAL SETUP
The CME2 compressor used for this experimental work is an axial single-stage compressor operating at 3200RPM. More details about the test rig and machine parameters are given in Figure 1 and Table 1. In Figure 2 is plotted the performance curve of the machine, where ψt−s is the total-to-static pressure
rise coefficient (ΔPt−s /0.5ρU2) and ϕ the flow coefficient
(Vx/𝑈). In this figure, point 1 corresponds to the design point of
the compressor.
Figure 1 CME2 Compressor
Table 1 Compressor parameters
Rotational speed 3200 rpm Design mass flow rate at 3200rpm 5.3 kg/s Rotor blade number 30 Stator blade number 40 Casing diameter 550 mm Hub-tip ratio, leading edge 0.75 Hub-tip ratio, trailing edge 0.78 Rotor tip chord 84 mm Rotor tip stagger angle 54 ° Rotor tip gap 0.5 mm
Figure 2 Compressor performances
The measurements were realized by pressure transducers (ENDEVCO 8507C-1 and 8510B-1), flush mounted on the compressor casing and located over the rotor. The transducers can be placed:
- On 45 locations evenly distributed between 3 rings at different axial positions, 4mm upstream and 27mm downstream the leading edge and 6mm downstream the trailing edge of the rotor. These sensors rings are respectively labeled station “a”, “f” and “k”. The implantation of the sensors in each ring is the same but they are rotated from one another for the sensors to be parallel to the camber line of the blade tip. This arrangement can be seen on Figure 3.(b) and Figure 3.(a) which respectively represents the first ring of pressure transducers seen from upstream and a close up of the azimuthal projection of the 3 rings. All the transducer locations of the first ring are used during this work, see Figure 3.(b), but only 4 on the second and third ring. Those last locations are depicted with green triangles.
- The test rig includes a measurement window, visible on Figure 1, with a more refined sensors cluster (see [13]). It consists in a 14 by 7 positions grid
with a resolution of 6mm by 2°. The window is represented by the blue arc on Figure 3.(b) and the locations used during this work are shown in Figure 3.(c).
The sampling rate of the unsteady pressure measurements is 100 kHz, which is high enough to catch the flow dynamics as the blade passage frequency is equal to 1.6 kHz in the present study. The pressure transducers uncertainty ranges from 0.5% to 1.5% of the full scale output.
Figure 3 Pressure transducer locations
EXPERIMENT PROCEDURE
As stated before, the first goal of this study is to investigate the effect of the throttling process on the stall onset.
For each test, the operating point of the compressor has been moved continuously along the characteristic from stable operating conditions (marked point 2 in Figure 2), to a point just after stall inception (point 3 in Figure 2). To do so, a throttling valve placed downstream to the compressor (see Figure 1), is continuously closed with a DC motor.
Three throttling speeds have been used. This three speeds lead to constant decreases of the mass flow rate of 0.295kg.s-2, 0.174kg.s-2 and 0.060kg.s-2. They are referred respectively as fast, moderate and slow throttling speed in the following. Figure 4 shows the evolution of the mass flow rate for the 3 speeds. One can observe that the throttling process starts at 5s, the mass flow rate then decreases almost linearly (1) until the onset of the rotating stall around 5kg.s-1. A sudden decrease of the mass flow rate (2) then occurs because of compressor stall. The mass flow continues to decrease as the throttling is active
(3), before stabilizing when the valve reaches the mechanical stop. For each throttling speed, the experiments have been repeated at least 15 times.
Figure 4 Mass flow rate for 3 throttling speeds
EFFECT OF THE THROTTLING SPEED ON ROTATING STALL ONSET
Figure 5 Stall inception through pressure traces at station “a”
Time evolution of the raw pressures are presented Figure 5 which shows the data from 9 pressure transducers located all around the compressor at station “a”. A low pass filter has been applied to remove the Blade Passing Frequency (BPF) and to highlight phenomena associated with the transition to stall. It is possible, thanks to this plot, to locate the emergence of the (a) (b) (c) 1 2 3 4 5 6 7 8 ω 9
spike around location 4, growing in one revolution and then giving birth to rotating stall. In the following, the use of the general term “instability” will refer either to the spike or the rotating stall (what is usually called rotating instabilities in axial compressor are not considered in the present study because the tip gap of this compressor is too small and so it does not exhibit this kind of disturbances).
Figure 6 is a color map giving the time evolution of the static pressure of all pressure transducers placed at station “a”. A threshold fixed at 250 Pa has been applied to get rid of the mean and negative values and to focus on the motion and growth of the instability over time. This graph allows a good observation of the wave front of the instability. The blue crosses indicate the time when a pressure signal reaches the threshold and locate the wave front of the instability.
Figure 6 Static pressure around the annulus at station 'a' during stall inception
The angular positions of the wave front are summarized in Figure 7. Polynomial functions are then fitted on these points. They are then used to compute the resulting instability speed evolution by deriving the position laws and averaging them on the 15 tests available for each throttling speed. The results are presented in Figure 8. From this graph, two main conclusions can be drawn:
Figure 7 Angular position of the instability during stall inception
- First, it appears clearly that the curves of the three throttling speeds are superimposed with one another. The conclusion from this observation is simple; the throttling speed has no influence on the rotational speed of the instability.
- Second, the instability speed varies continuously from 90% (at spike inception) to 40% of the shaft speed when stall is completely developed, which is the classical order of magnitude of rotating stall cells propagation speed.
Figure 8 Instability speed evolution for the three throttling speeds. The y-axis is expressed as a percentage of the rotor
speed
This last observation leads to two comments.
- First, the instability found in this compressor starts rotating at speeds really close to the rotor speed. This behavior can be linked to the observations made by Pullan et al. [10]. Indeed, the authors observed, on several numerical studies, the existence of prestall tornado-like vortex attached for one end to the suction side of the blades and for the other end to the casing. These structures, bounded to one blade pitch, are expected, therefore, to rotate close to the shaft rotational speed when they appear before slowing down as they extend to the nearby blade passages. It is difficult to say if the speed of this instability starts at 90% of the shaft speed (speed of the instability when it is recorded for the first time) or close to 100%. It is highly probable that, at the very first instants of the instability, the perturbation level is so small that the information is lost by applying the threshold. It would be interesting to locate the position of the instability using convolution or time-frequency analysis with more sensors around the casing to try elucidating this question.
- The second remark is linked to the statement made earlier about referring to the spike or the rotating stall with the general term of “instability”. This compressor exhibits an instability whose rotational speed continuously decreases from 90% to 40% of the shaft
speeds unlike the large majority of the works found in the literature. Indeed, usually, as shown by Pullan et al. [10] or Weichert et al. [11], the instability is found to rotate first around 70% of the shaft speed during several revolutions before transitioning to a fully established rotating stall moving at 40% of the rotor speed. For the present compressor, there is, consequently, a continuous variation of the flow dynamics from the first detection of the instability to the completely established stall cell and no clear distinction between both phenomena. Nothing allows us to tell that the spike exists in this compressor, as it is currently defined in the literature and as a specific structure of the flow different from the rotating stall cells. Instead it appears that the rotating stall emerges small at first, progressively slows down and increases in size to reach a stable state with a fixed rotational speed.
STALL WARNING PARAMETERS
POST PROCESSING METHOD
Previous section has shown that the rotational speed of the instability is insensitive to the throttling speed variation. We will now investigate the first part of the throttling process and its effect on the flow.
In order to have quantifiable parameters to be compared from one test to another, the pressure signals from different locations are processed through an algorithm depicting their level of irregularity. This algorithm is based on intercorrelations and has already been used in axial compressors. It was first proposed by Tahara et al. [2] and then perfected by Dhingra et al. [3] and Christensen et al. [12]. It is described in the following.
During nominal operations, the blade passage signature tends to be mostly periodic but when the compressor is throttled close to the stability limit, irregularities pop up erratically. The idea is to evaluate a coefficient which is representative of these irregularities. The aim of the post-processing technique is to monitor the irregularities in the pressure signal by computing the intercorrelation between the instantaneous blade passage signatures measured by a pressure transducer located over the rotor with a reference signal which will be defined below.
The correlation function is then expressed as:
𝐶 = ∑ 𝑃𝑡−𝑖𝑃𝑟𝑒𝑓
𝑤𝑛𝑑 𝑖=1
√∑𝑤𝑛𝑑𝑖=1 𝑃𝑡−𝑖2√∑𝑤𝑛𝑑𝑖=1 𝑃𝑟𝑒𝑓2
(1)
where wnd is the length of the window and Pt-i the current
discrete blade pressure signature. In this paper, wnd is equal to one blade pitch. Pref is a reference blade pressure signal
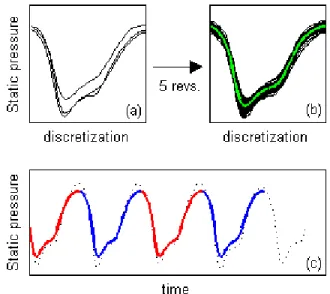
computed from several passage acquired at a fixed stable operating point for 5 revolutions. The pressure signals from each passage are then averaged to obtain the reference profile used for the calculation of the correlation. This process is represented in Figure 9.(a) and Figure 9.(b) with the pressure signal of each blade passages from 5 revolutions stacked on each other (black traces) and with the reference blade pressure signal in green.
Figure 9 Data analysis procedure
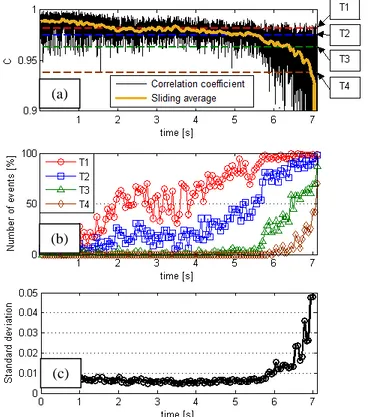
To compute the correlation, the reference profile is then matched with the real time pressure trace, has shown in Figure 9.(c) where the black dotted line is the real time pressure signal and the solid red and blue lines are the reference pressure profile. The time evolution of the maximum of the correlation coefficient obtained for each blade passage, simply referred as correlation coefficient in the following, is plotted Figure 10.(a). The average value of the correlation coefficient, computed over 5 rotor revolutions, is also represented by the plain yellow line. It has to be noted that, in Equation (1), the coefficient is normalized and as a consequence, the correlation coefficient reaches the unity if the instantaneous pressure signal is exactly the same as the reference signal and decreases towards 0 as much as it differs from the reference signal. Consequently, the more irregularities there are in the pressure signal, the more often the correlation coefficient will take low values.
Two other parameters are also calculated to quantify the irregularity during the throttling process. The first one corresponds to the number of times the correlation coefficient crosses a given threshold during a given period of time. This parameter is close to the one used by Liu [14]. The second parameter is the standard deviation of the correlation. An example of these parameters is presented in Figure 10 where the number of events (i.e. the number of times the correlation function crosses the threshold) is plotted for 4 different thresholds noted T1 to T4 and respectively equal to a
correlation coefficient value of 0.9817, 0.9755, 0.9630 and 0.9380. Their behavior is discussed in next section.
Figure 10 Correlation coefficient (a), number of events crossing 4 different thresholds (b) and correlation standard
deviation (c)
PARAMETERS EVOLUTION VERSUS SENSORS LOCATION
The algorithm presented in the previous section has been applied on every sensors of the compressor (i.e. for different angular and axial positions), for several runs at the three throttling speeds.
Figure 11 shows the evolution of the correlation for different transducers around the casing at station “a” for a moderate throttling speed. At the beginning of the process, the coefficient remains close to 0.98 but starts decreasing as stall approaches for sensors 1 and 2 mainly. Sensors 3 and 4 do not show any noticeable evolution until the very last instants before stall onset. This non axisymmetric behavior has already been observed by Tahara et al. [8] and later by Young et al.[15] who linked it to the existence of an eccentric tip-clearance.
In these studies, it appears that the correlation drop happens long before stall in regions of large tip-clearance. They also observed that rotating stalls onset, in eccentric compressor, tend to start very often just after the region of large tip clearance (around sensor 2 in the present case). The repartition of stall onset in the present compressor is summed up in Table 2. The start of a rotating stall is attributed to one of the four quadrants, see Figure 3 for convention, when the first irregularity is detected by a sensor from this specific sector.
These results confirm the initial trend seen on Figure 11 and suggest the presence of a region of larger tip-clearance in this test rig.
Figure 11 Correlation evolution around the casing at station "a"
Table 2 Location and rate of stall onset
Angle [°] 0-90 90-180 180-270 270-360 Stall rate [%] 8% 73% 16% 1%
Along the axial direction, the correlation coefficient exhibits different behaviors depending on the location of the sensor, as shown in Figure 12. For the first sensors, “a” to “c” (lettering of the sensors refers to Figure 3), the coefficient shows none or few variations but appears to be much more degraded from probe “d” to “g”. Moreover, the further the sensor is downstream, the sooner the correlation coefficient starts decreasing. On Figure 12, the red solid arrows show the approximate start of the growth of the coefficient. It is interesting to note that these probes are placed at a circumferential position where only 1% of the rotating stalls start, and so where the correlation coefficient shows one of the lowest degradation (the results from probe “a” in Figure 12 are the same than the one from probe “5” in Figure 11). This can
5 6 1 2 3 4 ω (c) (b) (a)
certainly be related to an increase, especially at off-design flow conditions, of the unsteadiness of the flow which increases with the axial position. This effect has to be taken into account during the design of a control system to optimize the sensors locations. If the sensors are too upstream, they may miss some instability and trigger the control system later than with an optimal positioning. But if they are too downstream, the flow may be too chaotic and the correlation coefficient too noisy to be of any use in a control system.
Figure 12 Correlation results for different axial positions at θ=328°
PARAMETERS EVOLUTION DURING THROTTLING
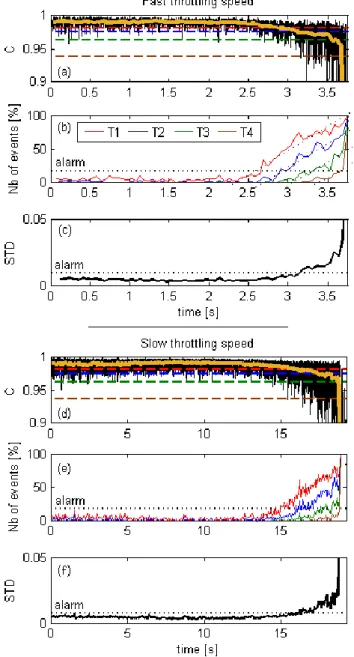
For this section, the influence of the throttling process on the evolution of the 3 parameters presented earlier is discussed. In this purpose, attention is given on instants long before the onset of the stall. Figure 13, shows the evolution of the analysis parameters during the throttling process for a test representative of fast and slow throttling speed (moderate throttling speed is not presented to facilitate the comparison but exhibit the exact
same trends than the ones presented). On plot (b), (c), (e) and (f), a line has been added to represent the level at which the alarm will trigger if one of the parameters crosses it. The purpose of such an alarm would be to be used in a control system as a trigger to start an actuator. These levels have been respectively fixed at 30% for the number of events crossing one of the four thresholds (Figure 13.(b) and (e)) and 0.01 for the standard deviation (Figure 13.(c) and (f)). At the beginning of the throttling process, regardless of the speed, the correlation coefficient is constant and really close to 1. This result indicates that the blade pressure signature presents no irregularities for flow coefficients far from the stability limit. As a consequence, the number of events crossing one of the thresholds and the standard deviation stay small.
Figure 13 Analysis parameters evolution during fast and slow throttling
But as the working point is moved close to the stability limit, the correlation coefficient starts decreasing and two effects are noticeable.
- First, the mean value of the correlation decreases. This trend, represented by the plain yellow line on Figure 13.(a) and (d), is due to a larger number of irregular blade profiles seen by the sensor and a general degradation of the profiles shape;
- Second, the amplitude of the correlation fluctuations increases and scatters. This behavior is caused by the appearance of stronger irregularities.
Figure 13.(b), (c), (e) and (f) depict this two effects. On one hand, the number of degraded profiles, as shown on Figure 13.(b) and (e) starts increasing at a given time (and so for a given flow coefficient) for each throttling speed and increases almost linearly until stall occurs. On the other hand, the size of the irregularities, monitored through Figure 13.(c) and (f), starts increasing smoothly and then increases exponentially.
In the perspective of using these parameters as warning signal in a control system, the number of events seems the most appropriate. Indeed, its evolution exhibits an abrupt change in slope, and is thus easier to detect and less sensitive to errors and fluctuations.
Figure 14 Construction of the warning time
Comparing the plot from fast and slow throttling speed, one can appreciate that their trends are very similar one from each other. To evaluate the influence of the throttling speed on those parameters, the mean warning time Δtalarm between the
triggering of the alarm talarm and the stall onset tstall, has been
calculated. These times are reported on Figure 14 which is a schematic representation of one of the parameters presented earlier. A dimensionless version of this time, Δt*
alarm, is also
used and expressed as follow:
𝛥𝑡∗ 𝑎𝑙𝑎𝑟𝑚= 1 𝑁× ∑ 𝑡𝑠𝑡𝑎𝑙𝑙,𝑖− 𝑡𝑎𝑙𝑎𝑟𝑚,𝑖 𝑡𝑡ℎ𝑟𝑜𝑡𝑡𝑙𝑖𝑛𝑔,𝑖 𝑁 𝑖=1 (2)
where N is the number of tests, and tthrottling a characteristic
time of each throttling speed.
The mean warning time for the 4 threshold and the deviation number is presented in Figure 15. In Figure 15.(a) we can see that the warning time decreases as the throttling speed increases suggesting a link between the two aforementioned. This link is made clearer thanks to the dimensionless mean warning time, presented in Figure 15.(b). Indeed, it shows little variations between the three throttling speed indicating that the warning time is inversely proportional to the throttling speed.
This clearly shows that the warning time is directly linked to the way the compressor is lead to rotating stall conditions: this interrogates on the ability of defining a stall warning signal which would be universal in the sense of giving similar results whatever the throttling process is. This, at least, demonstrates the necessity to take the throttling process into account when working on stall warning definition.
Figure 15 Mean warning time for the three throttling speed
CONCLUSION
This paper has reported some analysis on the transition from stable regime to rotating stall of an axial compressor. More specifically, it has focused on the effects of the throttling process on the transition to stall. To do so, experiments were conducted on a single-stage axial compressor during which the operating point has been continuously moved from stable regime to completely developed rotating stall operations using three different throttling speeds. Unsteady measurements have been made using pressure transducers flush mounted on the
compressor casing at different axial and azimuthal locations at the rotor level.
The analysis of the results focused on two different stages of the transition to stall: i/ a first stage during which the compressor is still stable but during which the unsteadiness of the flow increases. This unsteadiness increase has been evaluated by the use of a correlation function between the instantaneous pressure signal and a reference pressure signal. ii/ a second stage which corresponds to the very short time of transition between the first detection of a spike type precursor to fully developed rotating stall.
The main contribution of the present paper is that the first stage dynamic is directly linked with the throttling process whereas the second stage dynamic is completely independent from the throttling process.
More precisely, during the first stage, it has been shown that the evolution of the irregularity of the signal during the throttling process is strongly dependent on the transducer location. On the azimuthal direction, the differences are attributed to the rotor eccentricity as already observed in literature. On the axial direction, the increase of the irregularity is attributed to the increase of the flow unsteadiness with the axial chord. A stall warning signal was then built. It is based on the number of time the correlation signal crosses a given threshold. The time duration between the warning signal and the arising of rotating stall is directly linked with the throttling process and is proportional to a time characteristic of the throttling speed.
During the second stage, the instability wave front speed was determined from the first detection of the instability to fully established rotating stall. On this compressor, it has been shown – for the first time, at the authors’ knowledge- that this speed evolves: (1) continuously and (2) from a speed whose order of magnitude is the one of the rotor to the speed of the fully developed stall cell. As pointed out above, this speed evolution is completely independent on the throttling speed.
ACKNOWLEDGMENTS
The present work was supported by the ANR project NUMERICCS (ANR-15-CE06-0009).
REFERENCES
[1] I. J. Day, “Stall, Surge, and 75 Years of Research,” J.
Turbomach., vol. 138, no. 1, pp. 011001–011001, Oct.
2015.
[2] N. Tahara, T. Nakajima, M. Kurosaki, Y. Ohta, E. Outa, and T. Nisikawa, “Active stall control with practicable stall prediction system using auto-correlation coefficient,” in
37th Joint Propulsion Conference and Exhibit, 2001.
[3] M. Dhingra, Y. Neumeier, J. V. R. Prasad, and H.-W. Shin, “Stall and Surge Precursors in Axial Compressors,” in 39th
AIAA/ASME/SAE/ASEE Joint Propulsion Conference and Exhibit, American Institute of Aeronautics and Astronautics, 2003.
[4] M. D. Hathaway, “Self-Recirculating Casing Treatment Concept for Enhanced Compressor Performance,” pp. 411–420, Jan. 2002.
[5] K. L. Suder, M. D. Hathaway, S. A. Thorp, A. J. Strazisar, and M. B. Bright, “Compressor Stability Enhancement Using Discrete Tip Injection,” J. Turbomach., vol. 123, no. 1, pp. 14–23, Feb. 2000.
[6] C. Nie, G. Xu, X. Cheng, and J. Chen, “Micro Air Injection and Its Unsteady Response in a Low-Speed Axial Compressor,” J. Turbomach., vol. 124, no. 4, pp. 572–579, Nov. 2002.
[7] J. Li, F. Lin, Z. Tong, C. Nie, and J. Chen, “The Dual Mechanisms and Implementations of Stability Enhancement With Discrete Tip Injection in Axial Flow Compressors,” J. Turbomach., vol. 137, no. 3, pp. 031010– 031010, Oct. 2014.
[8] N. Tahara, M. Kurosaki, Y. Ohta, E. Outa, T. Nakajima, and T. Nakakita, “Early Stall Warning Technique for Axial-Flow Compressors,” J. Turbomach., vol. 129, no. 3, pp. 448–456, July 2006.
[9] M. Inoue, M. Kuroumaru, T. Tanino, S. Yoshida, and M. Furukawa, “Comparative Studies on Short and Long Length-Scale Stall Cell Propagating in an Axial Compressor Rotor,” J. Turbomach., vol. 123, no. 1, pp. 24–30, Feb. 2000.
[10] G. Pullan, A. M. Young, I. J. Day, E. M. Greitzer, and Z. S. Spakovszky, “Origins and Structure of Spike-Type Rotating Stall,” J. Turbomach., vol. 137, no. 5, pp. 051007–051007, May 2015.
[11] S. Weichert and I. Day, “Detailed Measurements of Spike Formation in an Axial Compressor,” J. Turbomach., vol. 136, no. 5, pp. 051006–051006, Sep. 2013.
[12] D. Christensen et al., “Development and Demonstration of a Stability Management System for Gas Turbine Engines,”
J. Turbomach., vol. 130, no. 3, pp. 031011-031011-9, May
2008.
[13] M. Vegliò, A. Dazin, G. Bois, and O. Roussette, “Unsteady pressure measurements of spike type inception in axial compressor: Time frequency analysis and averaging procedure,” presented at the 11th European Conference on
Turbomachinery Fluid Dynamics and Thermodynamics,
ETC 2015, 2015.
[14] Y. Liu, M. Dhingra, and J. V. R. Prasad, “Active Compressor Stability Management Via a Stall Margin Control Mode,” J. Eng. Gas Turbines Power, vol. 132, no. 5, pp. 051602–051602, Mar. 2010.
[15] A. Young, I. Day, and G. Pullan, “Stall Warning by Blade Pressure Signature Analysis,” J. Turbomach., vol. 135, no. 1, pp. 011033-011033-10, Oct. 2012.