A
CUTE
I
NSULT OF
A
MMONIA
L
EADS TO
C
ALCIUM
-DEPENDENT
G
LUTAMATE
R
ELEASE FROM
C
ULTURED
A
STROCYTES
,
AN
E
FFECT OF P
H
Christopher Rose, Wolfgang Kresse and Helmut Kettenmann‡
Max-Delbrück Center for Molecular Medicine, Cellular Neuroscience, 10 Robert-Rössle Strasse, D-13092 Berlin, Germany ‡ To whom correspondence should be addressed. Tel.: 49-30-9406-3325; Fax: 49-30-9406-3819; E-mail: kettenmann@mdc-berlin.de.
A
BSTRACT
Hyperammonemia is a key factor in the pathogenesis of hepatic encephalopathy (HE) as well as other metabolic encephalopathies, such as those associated with inherited disorders of urea cycle enzymes and in Reye's syndrome. Acute HE results in increased brain ammonia (up to 5 mm), astrocytic swelling, and altered glutamatergic function. In the present study, using fluorescence imaging techniques, acute exposure (10 min) of ammonia (NH4+/NH3 ) to
cultured astrocytes resulted in a concentration-dependent, transient increase in [Ca2+]i. This calcium transient was due to release from intracellular calcium stores, since the response was thapsigargin-sensitive and was still observed in calcium-free buffer. Using an enzyme-linked fluorescence assay, glutamate release was measured indirectly via the production of NADH (a naturally fluorescent product when excited with UV light). NH4+/NH3 (5 mm) stimulated a
calcium-dependent glutamate release from cultured astrocytes, which was inhibited after preincubation with 1,2-bis(2-aminophenoxy)ethane-N,N,N′,N′-tetraacetic acid acetoxymethyl ester but unaffected after preincubation with glutamate transport inhibitors dihydrokainate and dl-threo-β-benzyloxyaspartate. NH4+/NH3 (5 mm) also induced a
transient intracellular alkaline shift. To investigate whether the effects of NH4+/NH3 were mediated by an increase in
pHi, we applied trimethylamine (TMA+/TMA) as another weak base. TMA+/TMA (5 mm) induced a similar transient increase in both pHi and [Ca2+]i (mobilization from intracellular calcium stores) and resulted in calcium-dependent release of glutamate. These results indicate that an acute exposure to ammonia, resulting in cytosolic alkalinization, leads to calcium-dependent glutamate release from astrocytes. A deregulation of glutamate release from astrocytes by ammonia could contribute to glutamate dysfunction consistently observed in acute HE.
The abbreviations used are: ALF, acute liver failure; HE, hepatic encephalopathy; GPT, glutamate pyruvate transaminase; AM, acetoxymethylester; BCECF, 2′,7′-bis-(carboxyethyl)-carboxyfluorescein; TBOA, dl-threo-β-benzyloxyaspartate; BAPTA, 1,2-bis(2-aminophenoxy)ethane-N,N,N′,N′-tetraacetic acid; ER, endoplasmic reticulum; TMA, trimethylamine; DHK, dihydrokainate.
I
NTRODUCTION
Hyperammonemia consequently leads to increased concentrations of ammonia, up to 5 mm, in the brain. This high level of brain ammonia is a key factor in the pathogenesis of central nervous system dysfunction in acute and chronic liver failure. The nature and severity of the central nervous system disorder mainly depend upon the degree and acuteness of the onset of hyperammonemia (1). Acute liver failure (ALF)1 resulting from viral infections or toxic liver injury is a life-threatening condition where hepatic encephalopathy (HE) develops rapidly and mortality rates are high due to brain stem herniation caused by increased intracranial pressure, a fatal consequence of cytotoxic brain edema. Excess ammonia is toxic to the brain resulting in deleterious effects, by both direct and indirect mechanisms, on cerebral metabolism and neurotransmission.
Over the past 10 years, there has been an increasing body of evidence demonstrating that ammonia toxicity is involved in alterations of glutamatergic synaptic regulation which is implicated in the pathophysiology of HE in ALF. Several reports have consistently described increased extracellular concentrations of brain glutamate in different models of experimental ALF (2–5); however, neither the cell type nor the underlying release mechanisms have been identified. One possible explanation for the increased extracellular glutamate may be ammonia's inhibitory effects on the glutamate transporter system in astrocytes. It has been shown that ammonia inhibits glutamate uptake into astrocytes in vitro (6) and decreases protein and gene expression of the glutamate transporter GLT-1 (EAAT-2) in the frontal cortex of rats with ALF (7). The role of ammonia in the glutamatergic dysfunction demonstrated in HE is supported with a positive correlation between extracellular brain concentrations of glutamate and arterial ammonia concentrations in ALF in rats (4). In addition, using mild hypothermia as a treatment in rats with ALF, extracellular brain glutamate concentrations were normalized concomitantly with a lowering of brain ammonia (8).
Glutamate has been demonstrated to be an important signaling molecule for neuron-glia communication. Astrocytes express receptors and transporters for glutamate and recently have also been demonstrated to contain the protein machinery necessary to release glutamate by exocytosis through vesicles (9) and a fusion-related mechanism (10, 11). Overall, astrocytes have many characteristics that were previously considered exclusive for neurons and are therefore actively involved in cell signaling by releasing glutamate. Astrocytic glutamate release is calcium-dependent and can be triggered by any ligand that stimulates an increase in [Ca2+]i, such as bradykinins (12), prostaglandins (13), and ATP (14, 15). Even a spontaneous [Ca2+]i increase leads to glutamate release from astrocytes (16).
A rapid increase in ammonia results in an increase in pHi (intracellular alkanization) in all cell types, including astrocytes (17). It has been also demonstrated that intracellular alkalinization is accompanied with an increase in [Ca2+]i in cultured acinar cells (18), in enthothelial cells (19), in pituitary cells (20), and in neurons (21).
Furthermore, ammonia-induced intracellular alkalinization has been demonstrated to increase [Ca2+]i in microglia initiating Ca2+ release from thapsigargin-sensitive stores (22).
The purpose of our study was to investigate whether ammonia-induced intracellular alkalinization could have an effect on [Ca2+]i signaling in astrocytes and furthermore study whether the effects of ammonia could play a pathophysiological role in glutamate release from astrocytes.
EXPERIMENTAL
PROCEDURES
Preparation of Cultured Astrocytes—
Astrocytes were prepared from cortex of newborn NMRI mice as described previously (23). Briefly, cortical tissue was carefully dissected from blood vessels and meninges, rinsed with basal medium eagle solution, and incubated with 0.05% trypsin, 0.02% EDTA solution for 8 min at 37 °C, trypsinized, and gently triturated with a fire-polished pipette in the presence of 0.05% DNase (Worthington). After washing cells twice, cells were cultured in 75-cm2 plates on poly-l-lysine-coated coverslips using cultured basal medium Eagle's/10% fetal calf serum. One day later, cultures were washed twice with Hanks' balanced salt solution to remove cellular debris and maintained for 4 days. After reaching subconfluent state, cellular debris, microglia cells, oligodendrocytes as well as their early precursor cells were dislodged by manual shaking and removed by washing with Hanks' balanced salt solution. The purity of the astrocytes was routinely determined byimmunofluorescence using a polyclonal antibody against glial fibrillary acidic protein (DAKO, Hamburg, Germany), a specific astrocyte marker. The cultures showed more than 90% cells positive for glial fibrillary acidic protein. Measurements were made from cells between days 11 and 15.
Solutions—
All solutions were freshly prepared from refrigerated stock solutions. The standard bath solution was composed of 150 mm NaCl, 5.4 mm KCl, 2 mm CaCl2, 1 mm MgCl2, 10 mm HEPES, 10 mm glucose, pH adjusted to 7.4by NaOH. To obtain calcium-free solution, CaCl2 was omitted, replaced with equivalent amount of MgCl2 and 1 mm of EGTA (calcium chelator) was added. For ammonia and trimethylamine solutions, NH4Cl or TMACl were added to the solution by replacing an equivalent amount of NaCl.
Fluorescence Imaging System—
Cells were visualized under water immersion with a ×40 objective (numerical aperture 0.9) from a perfusion chamber mounted on a stage with an upright microscope (Axioskop FS, Zeiss, Oberkochen, Germany). Cells were superfused with standard physiological bath solution, and cell stimulation was achieved by changing the perfusate with ammonia or trimethylamine solution. Excitation light was provided by a monochromator (TILL Photonics, Munich, Germany), and the fluorescence emission was captured by a cooled CCD camera (SensiCam; PCO, Kelheim, Germany) and digitized by an image processing system (TILLVision; TILLPhotonics, Munich, Germany). The monochromator and CCD camera were controlled by TILLVision software, which was used for image analysis. Ratio images were collected at intervals every 1 s.
Measurement of Extracellular Glutamate—
Glutamate levels were detected using an enzymatic assay (13, 24, 25). In the presence of glutamate, GDH reduces NAD+ to NADH (Fig. 6 (inset), Reaction 1), a product that fluoresces when excited by UV light (360 nm). Provided that GDH and NAD+ are present in the cell medium, any glutamate released from the astrocytes into the medium will be detected as an increase in NADH fluorescence. NADH production can be amplified by adding glutamate pyruvate transaminase (GPT) and alanine (see Fig. 6 (inset), Reaction 2) to the medium. The newly formed α-ketoglutarate (from Reaction 1), driven by excess of supplied alanine, produces glutamate and pyruvate, forming a cycle and amplifying the NADH production (fluorescence). Cells were bathed in a solution containing GDH (∼70 units/ml), 1 mm NAD+, 140 mm NaCl, 5 mm KCl, 2 mm MgCl2, 2 mm CaCl2, 10 mm HEPES/NaOH, and 10 mm glucose, with a pH of 7.4. When GPT (∼23 units/ml) and alanine (1 mm) were added, adjustments with glucose were made to correct for osmolarity measured by a freezing point osmometer (model 5002; Precision Instruments, Natick, MA). All of the experiments were performed at room temperature (20–23 °C) using confluent astrocytic cultures.To estimate the extracellular levels of glutamate, known concentrations of glutamate were applied by pipette using cell-free buffer in the presence of GDH (or GDH + GPT), NAD+, and alanine. The flow of the solution was stopped to allow NADH to accumulate in a concentration- and time-dependent manner. With GDH alone, the amplitude of the fluorescent signal reached a peak after 20–30 s and sustained. With GDH + GPT, the amplitude of the fluorescent signal never reached a plateau, and therefore to be able to compare both assays, fluorescence was measured after 10 min for all experiments. The approximate concentration of glutamate released from cells was estimated from the respective standard curves.
Data are expressed as NADH formation (percentage of base line), where base line represents the fluorescence level of the optical field before cell stimulation, the sum of fluorescence emitted from GDH + NAD+ along with basal NADH (either as a contaminant or because of enzymatic activity). Data were collected from at least three different cultures.
Measurement of Intracellular Calcium—
Cultured astrocytes on coverslips were incubated with 5 μm fura-2/acetoxymethylester (AM) for 20 min in physiological buffer in the dark at room temperature. Cells were then washed with physiological buffer and stored in the dark for an additional 20 min to ensure fura-2/AM hydrolysis. Coverslips with loaded cells were transferred to the perfusion chamber and visualized under the microscope. Fura-2, a ratiometric dye, was excited with UV light at 340 and 380 nm, and the emission was measured at 530 ± 10 nm. The [Ca2+]i was calculated from the ratio of fluorescence recorded at 340 and 380 nm excitation wavelengths using the equation of Grynkiewicz et al. (26), [Ca2+]i = Kdβ(R – Rmin)/(Rmax – R); where R = F340/F380, Rmin is the fluorescence ratio of calcium-free/fura-2 and Rmax is the ratio of calcium-bound/fura-2. The constant Kdβ wasprocedure as described previously (27). The parameters Kdβ, Rmin, and Rmax characterizing the system were 1.6, 0.2, and 2.1 μm, respectively.
Measurement of Intracellular pH—
For measurements of pHi the H+-sensitive fluorophore 2′,7′-bis-(carboxyethyl)-carboxyfluorescein (BCECF) was used. Cultured astrocytes on coverslips were incubated at room temperature in the dark with a 5 μm concentration of the membrane-permeant BCECF/AM in physiological buffer for 15 min and then washed and stored in the dark for an additional 15 min to ensure BCECF/AM hydrolysis; BCECF, a ratiometric dye was measured at excitation wavelengths 440 and 488 nm. Emission was measured at 530 ± 10 nm. An acid pH shift is demonstrated with a decrease in BCECF fluorescence. Calibrations of pHi with different pH solutions (6.0, 6.5, 7.0, 7.5, and 8.0) were made in the presence of high K+ (105 mm) solution containing nigericin (10 μm) (28). Each calibration was repeated three times with 20–30 cells from different cultures.Glutamate Transporter Inhibitors—
To block glutamate release, cells were pretreated, for 5 and 10 min prior to the experiments, with dl-threo-β-benzyloxyaspartate (TBOA), an EAAT-1 glutamate transporter inhibitor, and dihydrokainate (DHK), an EAAT-2 glutamate transporter inhibitor at a final concentration of 10 and 100 μm, respectively. TBOA and DHK are nonsubstrate glutamate transporter inhibitors. An important functional distinction between substrate and non-substrate inhibitors is that substrate inhibitors can induce release of excitatory amino acids by heteroexchange or exchange with an intracellular transporter substrate. Nonsubstrate inhibitors block uptake reversal through transporters by binding at the extracellular surface and therefore are not transported (29), preventing glutamate from being transported into and out of the cell.Materials—
Fura-2/AM, BCECF/AM, and BAPTA/AM were obtained from Molecular Probes, Inc. (Eugene, OR). NH4Cl, TMA/Cl, GDH (G2626), GPT (G7003), NAD+ (N7004), alanine, nigericin, ionomycin, thapsigargin, TBOA, and DHK were obtained from Sigma.RESULTS
NH4+/NH3 Triggers a Transient Increase in [Ca2+]i—
Extracellular application of ammoniachloride (NH4+/NH3 ) (5 mm) at pH 7.4 triggered a transient increase in [Ca2+]i in cultured mouse astrocytes
measured with the cell permeant calcium-sensitive fluorophore fura-2/AM (Fig. 1).
Fig. 1. NH4+/NH3 stimulates a transient increase in [Ca2+]i in cultured astrocytes. Astrocytes were loaded with the
cell-permeant calcium-sensitive fluorophore fura-2/AM. The fluorescence image on the left shows the dye-loaded astrocytes. A region of interest (ROI) was selected from each astrocyte (typical example shown from one astrocyte). The corresponding trace to the right is the response from that ROI upon application of NH4+/NH3 (10 min, 5 mm).
An increase in [Ca2+]i peaked within ∼1 min and returned to base line within 5–8 min in the continuous presence of NH4+/NH3 (Fig. 2A). The absolute amplitude increase was, on average, 66.3 ± 4.4 nm (n = 217) (Fig. 2D). Higher
concentrations of NH4+/NH3 (10 and 20 mm) elicited a response with similar time course but with a higher
amplitude, whereas NH4+/NH3 at 1 mm did not stimulate a significant increase in [Ca2+]i (Fig. 2D). To test whether
NH4+/NH3 -stimulated [Ca2+]i transients could occur from an already elevated level of NH4+/NH3 , astrocytes were
bathed in 1 mm NH4+/NH3 and then stimulated with 6 mm NH4+/NH3 (Fig. 2C); this resulted in a similar [Ca2+]i
transient as observed when NH4+/NH3 (5 mm) was applied to a physiological bathing solution.
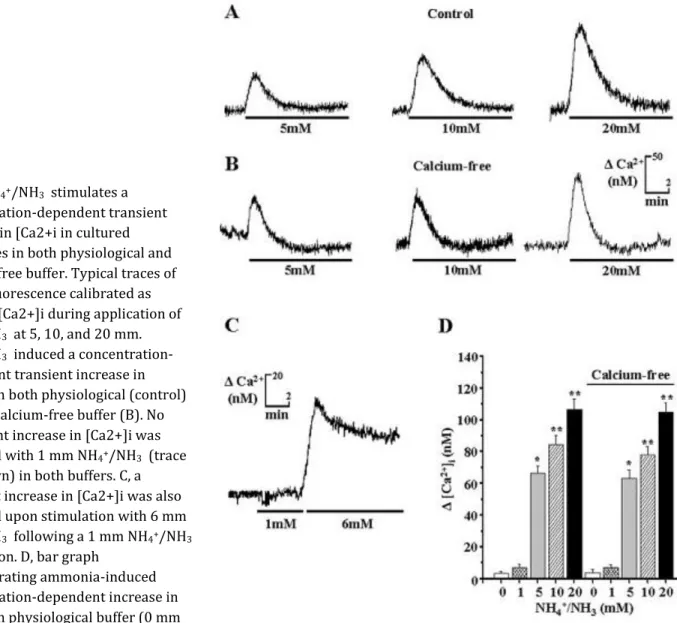
Fig. 2.NH4+/NH3 stimulates a
concentration-dependent transient increase in [Ca2+i in cultured astrocytes in both physiological and calcium-free buffer. Typical traces of fura-2 fluorescence calibrated as changes [Ca2+]i during application of NH4+/NH3 at 5, 10, and 20 mm.
NH4+/NH3 induced a
concentration-dependent transient increase in [Ca2+]i in both physiological (control) (A) and calcium-free buffer (B). No significant increase in [Ca2+]i was observed with 1 mm NH4+/NH3 (trace
not shown) in both buffers. C, a transient increase in [Ca2+]i was also observed upon stimulation with 6 mm NH4+/NH3 following a 1 mm NH4+/NH3
application. D, bar graph
demonstrating ammonia-induced concentration-dependent increase in [Ca2+]i in physiological buffer (0 mm
NH4+/NH3 (control), 3.2 ± 1.3 nm (n = 176); 1 mm NH4+/NH3 , 6.7 ± 2.2 nm (n = 165); 5 mm NH4+/NH3 , 66.3 ± 4.4 nm
(n = 217; *, p < 0.01); 10 mm NH4+/NH3 , 84.3 ± 5.8 nm (n = 198; **, p < 0.001); 20 mm NH4+/NH3 , 106.6 ± 6.5 nm (n
= 156; **, p < 0.001)) and in calcium-free buffer (0 mm NH4+/NH3 (control), 3.8 ± 2.0 nm (n = 179); 1 mm NH4+/NH3 ,
6.9 ± 1.8 nm (n = 187); 5 mm NH4+/NH3 , 62.9 ± 5.4 nm (n = 224; *, p < 0.01); 10 mm NH4+/NH3 , 77.6 ± 5.5 nm (n =
191; **, p < 0.001), 20 mm NH4+/NH3 ; 104.7 ± 5.7 nm (n = 173; **, p < 0.001). No significant difference in Δ[Ca2+]i
values was found with the same ammonia concentration treatment between physiological and calcium-free buffer. Data are expressed as means ± S.E. Significant difference between groups was calculated using a one-way analysis of variance and post hoc Tukey's test. Differences were considered when p < 0.05.
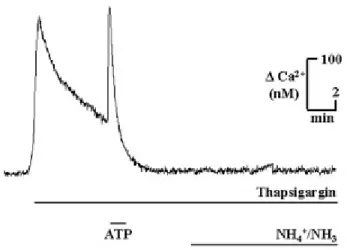
Fig. 3. NH4+/NH3 triggers calcium release from
thapsigargin-sensitive intracellular calcium stores. To investigate the source of NH4+/NH3 (5 mm) stimulated
increase in [Ca2+]i, a paradigm was used to deplete the ER calcium stores. In calcium-free buffer, thapsigargin (500 nm), a blocker for Ca2+ transport into the ER stores, was applied, resulting in a transient increase in [Ca2+]i. To further stimulate the efflux of calcium from the ER stores, ATP (100 μm) was additionally applied, which resulted in another transient increase in [Ca2+]i. After [Ca2+]i had reached a new base line, NH4+/NH3 (5 mm)
was applied and did not result in a change in [Ca2+]i.
NH4+/NH3 -triggered Increase in [Ca2]i Is Due to Release from Internal Stores—
To testfor the source of calcium, we compared [Ca2+]i responses to applications of NH4+/NH3 in physiological and
calcium-free bathing solutions. NH4+/NH3 triggered similar calcium responses in the calcium-free bathing solution as
compared with physiological (control) solution with respect to amplitude and time course and was effective at 5, 10, and 20 mm (Fig. 2B) but not 1 mm (Fig. 2D). To support the view that NH4+/NH3 triggered calcium release from
internal calcium stores, we used a paradigm to deplete endoplasmic reticulum (ER) stores; in the presence of thapsigargin (500 nm), a blocker for calcium transport into the ER stores, we applied ATP (100 μm) to further deplete ER stores. As shown before (30), ATP triggered a large increase in [Ca2+]i, and typically all subsequent metabotropic responses were abolished in the continuous presence of thapsigargin. When NH4+/NH3 (5 mm) was
applied following this paradigm and still in the presence of thapsigargin, it failed to elicit a calcium response (n = 91) (Fig. 3). We conclude that NH4+/NH3 triggers calcium release from thapsigargin-sensitive intracellular stores.
TMA+/TMA, Another Weak Base, Mimics NH4+/NH3 -triggered [Ca2+]i Increase and
Alkaline Shift—
An increase of NH4+/NH3 has been described to result in an alkalinization of the cell plasma inmost cells, including astrocytes (31). We therefore used another weak base, trimethylamine chloride (TMA+/TMA), to mimic the alkaline shift and test the impact of this alkalinization on [Ca2+]i signaling. We measured intracellular pH using the cell-permeant pH-sensitive fluorophore BCECF/AM. NH4+/NH3 (5 mm) triggered an intracellular
alkalinization by 0.44 ± 0.06 pH units (n = 173), and TMA+/TMA (5 mm) triggered one of 0.47 ± 0.05 pH units (n = 151) (Fig. 4, A and B). While in the continuous presence of NH4+/NH3 (5 mm), pHi returned to basal level within 4–6
min (Fig. 4A), whereas pHi remained elevated for at least 10 min in the continuous presence of TMA+/TMA (5 mm) (Fig. 4B). Both NH4+/NH3 (5 mm) and TMA+/TMA (5 mm) triggered a similar alkaline shift in calcium-free bathing
solution. NH4+/NH3 (5 mm) increased pHi by 0.41 ± 0.07 pH units (n = 146), and TMA+/TMA (5 mm) increased pHi
by 0.43 ± 0.06 pH units (n = 138). In conclusion, both agents trigger a similar alkaline shift.
TMA+/TMA (5 mm) triggered a transient increase in [Ca2+]i with a similar time course as recorded for NH4+/NH3 (5
mm) (Fig. 5A). The amplitude was comparable with that of the NH4+/NH3 -triggered response, namely 69.9 ± 5.3 nm
(n = 132) in physiological (control) and 65.9 ± 4.8 nm (n = 147) in calcium-free buffer (Fig. 5A). We then applied the above described paradigm to depleted ER stores, namely by adding thapsigargin to the bath (500 nm) and briefly applying ATP (100 μm). When TMA+/TMA (5 mm) was added (still in the presence of thapsigargin), it did not trigger a significant increase in [Ca2+]i (Fig. 5B). Taken together, these data indicate that alkaline shifts trigger the release of calcium from cytoplasmic thapsigargin-sensitive stores.
Fig. 4. NH4+/NH3 and TMA+/TMA stimulate
a transient increase in pHi in cultured astrocytes in both physiological and calcium-free buffer. A, a 10-min application of NH4+/NH3 (5 mm) induced a transient
increase in pHi (0.41 ± 0.07 pH units, n = 146), which returned to base line within 4–6 min in both physiological (control, left trace) and calcium-free buffer (right trace). B, applying TMA+/TMA (5 mm), another weak base, for 10 min stimulated a similar transient increase in pHi (0.43 ± 0.06 pH units, n = 138) as with NH4+/NH3 (5 mm);
however, pHi did not return to base line within 10 min.
An Enzyme-linked Fluorescence Assay Can Record Low Levels of Glutamate in the
Presence of NH4+/NH3 —
Glutamate released from cultured astrocytes has previously been recorded using an enzyme-linked fluorescence assay (13, 24, 25). With the enzyme GDH and the substrate NAD+ in the extracellular medium, glutamate produces α-ketoglutarate, NH4+/NH3 , and NADH (Fig. 6 (inset), Reaction 1). Formation of NADHwas recorded as a fluorescence signal when excited at 360 nm, and therefore changes in fluorescence reflect changes in glutamate levels in the bath. However, application of NH4+/NH3 results in product inhibition, decreasing the
formation of NADH. Testing the degree of inhibition, different concentrations of NH4+/NH3 were applied with
various concentrations of glutamate in a medium (without cells) containing NAD+ and GDH. NH4+/NH3 inhibited the
production of NADH in a concentration-dependent manner, at a given (known) concentration of glutamate (Fig. 6A). At 5 μm glutamate, NADH formation was barely detectable.
To increase the sensitivity to detect NADH, an enzymatic loop was produced to amplify the NADH production. This was accomplished by adding a second enzyme GPT and alanine (Fig. 6 (inset), Reaction 2).
Fig. 5. TMA+/TMA (5 mm) stimulates a transient increase in [Ca2+]i in both physiological (control) and calcium-free buffer. A, typical traces demonstrating where TMA+/TMA (5 mm) stimulated a similar transient increase in [Ca2+]i in both physiological (control, left trace) (69.93 ± 5.36 nm (n = 151)) and calcium-free buffer (right trace) (65.99 ± 4.84 nm (n = 167)) as seen with NH4+/NH3 (5 mm). B, after
depleting the thapsigargin-sensitive intracellular calcium stores with
thapsigargin (500 nm) and ATP (100 μm), TMA+/TMA (5 mm) did not stimulate a transient increase in [Ca2+]i.
To demonstrate the difference between a nonamplified (GDH only) and an amplified (GDH + GPT) response, typical traces are shown in Fig. 6B with 50 μm of glutamate given in the absence and presence of NH4+/NH3 (5 mm). In the
absence of NH4+/NH3 , a significant increase in NADH formation with GDH + GPT (102%) was found compared with
GDH alone (33%). NH4+/NH3 (5 mm) inhibited NADH formation in both assays, GDH and GDH + GPT; however, a
significant rise in NADH formation was demonstrated with GDH + GPT (58%) compared with GDH (10%) (Fig. 6B). In the presence of GDH alone, NADH formation reached a plateau within ∼3 min with or without NH4+/NH3 (5 mm).
Since NAD+ is present in excess, this plateau is most probably due to the limited amount of glutamate (i.e. all glutamate given has been converted to α-ketoglutarate). With GDH + GPT, a continuous increase in NADH formation is demonstrated within the observation time of up to 20 min. Eventually, a plateau will be reached when all NAD+ or alanine is converted, but this obviously did not occur within 20 min. This implies that NADH formation must be measured with respect to time, and we chose 10 min as our temporal end point. NH4+/NH3 at concentrations of 1, 5,
10, 20 mm again caused a dose-dependent inhibition; however, the increase in NADH fluorescence was clearly detectable (Fig. 6A). Thus, with the combined enzyme system, GDH + GPT, the level of NADH formation can be measured in response to application of glutamate as low as 500 nm in the presence of NH4+/NH3 at 1 and 5 mm. A
logarithmic standard curve with GDH + GPT demonstrating the inhibition of NH4+/NH3 at 0, 1, 5, 10, and 20 mm at
Fig. 6. Enzyme-linked fluorescence assay to record glutamate levels in the bath. A, the schematic diagram in the inset illustrates the detection assay. To detect levels of glutamate in the bathing solution, GDH (∼70 units/ml) and NAD+ (1 mm) are added to the extracellular medium. Upon glutamate release, GDH reduces NAD+ to NADH, which fluoresces when excited at 360 nm (reaction 1; see inset). NADH formation recorded as fluorescence indirectly reflects released glutamate concentrations. In the presence of GDH and NAD+, NH4+/NH3 (1, 5, 10, and 20 mm)
concentration-dependently inhibits (through product inhibition) the production of NADH with different concentrations of applied glutamate. Detectability of NADH formation is very low with 5 μm glutamate. NADH formation can be amplified with the addition of GPT (∼23 units/ml) and alanine (1 mm) (reaction 2; see inset). With amplification,
quantification of NADH formation is measured in relation to time. In all experiments, 10 min was the
standard time used. Amplifying NADH formation with the addition of GDH + GPT, in the presence of NAD+ and alanine, NH4+/NH3 (1, 5, 10, and 20 mm) again concentration-dependently inhibits the production of NADH with
different concentrations of applied glutamate; however, levels of NADH are much higher as compared with levels without GPT and alanine. Detectability of glutamate increased to as low as 500 nm in the presence of 1 and 5 mm NH4+/NH3 . B, typical traces demonstrating the significant increase in NADH formation (with 50 μm glutamate) with
GDH + GPT versus GDH in the absence (control) or the presence of NH4+/NH3 (5 mm). Note the plateau formation of
NADH with only GDH (limited by glutamate), whereas with GDH + GPT the loop is closed and amplification
continues. C, logarithmic standard curve of NADH formation in the presence of different concentrations of NH4+/NH3
along with different concentrations of glutamate.
Due to the strong inhibition of NH4+/NH3 at 10 and 20 mm, NH4+/NH3 at 5 mm was further used to study the effects
of ammonia on glutamate release from cultured astrocytes. Furthermore, 5 mm NH4+/NH3 is the pathophysiological
Application of NH4+/NH3 and TMA+/TMA Triggers Glutamate Release from Cultured Astrocytes—With GDH + GPT,
NAD+, and alanine present in the medium, NH4+/NH3 (5 mm) application to cultured astrocytes resulted in an
increase in NADH formation as a measure of glutamate release. In physiological buffer, the basal NADH formation within the 10-min recording period was 9.3 ± 1.5% (n = 19 coverslips). In the presence of NH4+/NH3 (5 mm), it was
significantly higher (23.7 ± 2.5%, n = 26 coverslips, p < 0.01). NADH formation occurred with a small delay after application of NH4+/NH3 (5 mm). We assume that, in the beginning, NADH levels are too low to be detected by our
system, but with further amplification, NADH levels surpassed the threshold of our detection system (Fig. 7A). No significant increase in NADH was seen when a similar volume of physiological buffer (without NH4+/NH3 ) was
applied as a control (n = 11 coverslips). Furthermore, NH4+/NH3 (5 mm) did not increase NADH production in the
absence of an enzyme-linked fluorescence system (n = 5 coverslips) in the extracellular medium.
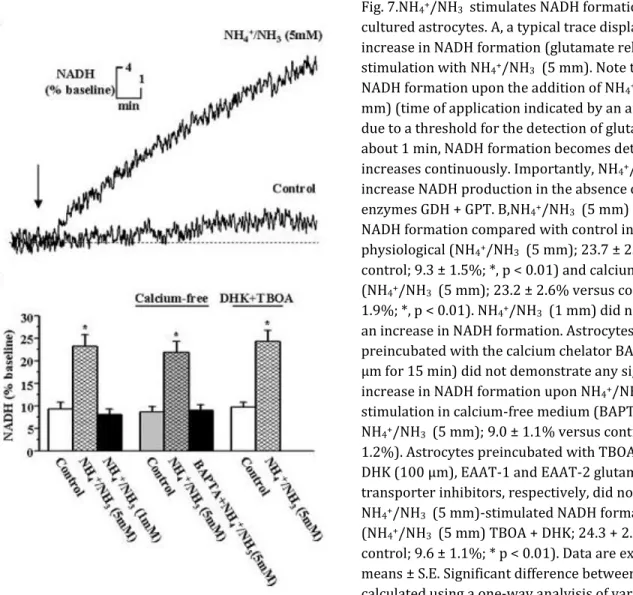
Fig. 7.NH4+/NH3 stimulates NADH formation from
cultured astrocytes. A, a typical trace displaying an increase in NADH formation (glutamate release) upon stimulation with NH4+/NH3 (5 mm). Note the lag of
NADH formation upon the addition of NH4+/NH3 (5
mm) (time of application indicated by an arrow). This is due to a threshold for the detection of glutamate. After about 1 min, NADH formation becomes detectable and increases continuously. Importantly, NH4+/NH3 did not
increase NADH production in the absence of the enzymes GDH + GPT. B,NH4+/NH3 (5 mm) stimulates
NADH formation compared with control in both physiological (NH4+/NH3 (5 mm); 23.7 ± 2.5% versus
control; 9.3 ± 1.5%; *, p < 0.01) and calcium-free buffer (NH4+/NH3 (5 mm); 23.2 ± 2.6% versus control; 10.7 ±
1.9%; *, p < 0.01). NH4+/NH3 (1 mm) did not stimulate
an increase in NADH formation. Astrocytes
preincubated with the calcium chelator BAPTA/AM (5 μm for 15 min) did not demonstrate any significant increase in NADH formation upon NH4+/NH3 (5 mm)
stimulation in calcium-free medium (BAPTA + NH4+/NH3 (5 mm); 9.0 ± 1.1% versus control; 8.6 ±
1.2%). Astrocytes preincubated with TBOA (10 μm) and DHK (100 μm), EAAT-1 and EAAT-2 glutamate
transporter inhibitors, respectively, did not influence NH4+/NH3 (5 mm)-stimulated NADH formation
(NH4+/NH3 (5 mm) TBOA + DHK; 24.3 + 2.4% versus
control; 9.6 ± 1.1%; * p < 0.01). Data are expressed as means ± S.E. Significant difference between groups was calculated using a one-way analyisis of variance and post hoc Tukey's test. Differences were considered when p < 0.05.
In contrast to NH4+/NH3 , TMA /TMA is not a product of the enzymatic reaction and thus is not expected to inhibit
NADH formation. Fig. 8A displays the relation between NADH formation and glutamate concentration in the
presence and absence of TMA+/TMA (5 mm), and as expected, there is no difference. Therefore, TMA+/TMA (5 mm) stimulated a significantly higher increase in NADH formation (40.4 ± 3.8%, n = 28 coverslips, p < 0.01) as compared with control (TMA+/TMA (0 mm); 8.9 ± 1.1%, n = 18 coverslips). In conclusion, both weak bases, NH4+/NH3 (5 mm)
and TMA+/TMA (5 mm), trigger glutamate release from astrocytes. Fig. 8. TMA+/TMA stimulates NADH formation from
cultured astrocytes. A, as described in the legend of Fig. 5, we determined the NADH formation in the presence and absence of TMA+/TMA (5 mm). It is obvious that TMA+/TMA (5 mm) did not influence the formation of NADH. B, TMA+/TMA (5 mm) stimulated a significant increase in NADH formation compared with control in both physiological (TMA+/TMA (5 mm); 40.4 ± 3.8% versus control; 8.9 ± 1.1%; *, p < 0.01) and calcium-free buffer (TMA+/TMA (5 mm); 45.0 ± 6.6% versus control; 10.7 ± 1.9%; *, p < 0.01). Astrocytes preincubated with BAPTA/AM (5 μm, for 15 min) did not demonstrate any significant increase in NADH formation upon
TMA+/TMA (5 mm) stimulation in calcium-free medium (BAPTA + TMA+/TMA (5 mm); 11.9 ± 2.8% versus control; 10.7 ± 1.9%). Astrocytes preincubated with glutamate transporters TBOA (10 μm) and DHK (100 μm) did not influence TMA+/TMA (5 mm)-stimulated glutamate release (TMA+/TMA (5 mm) + TBOA + DHK; 45.8 ± 3.2% versus control; 13.6 ± 2.8%; *, p < 0.01). TMA+/TMA (5 mm) did not increase NADH production in the absence of GDH + GPT. There was no significant difference in glutamate release within the TMA+/TMA-treated groups or the control groups. Data are
expressed as means ± S.E. Significant difference between groups was calculated using a one-way analyisis of variance and post hoc Tukey's test. Differences were considered when p was <0.05.
NH4+/NH3 and TMA+/TMA Stimulate Similar NADH Responses in Calcium-free Buffer,
Which Are Attenuated following Pretreatment with BAPTA—
We have described above that theNH4+/NH3 (5 mm)- and TMA+/TMA (5 mm)-triggered alkaline shift and [Ca2+]i increase were not affected by
omission of Ca2+ from the buffer. We therefore tested NADH release in calcium-free bathing solution. There was no significant difference when comparing NADH formation in physiological (control) and calcium-free (control) bathing solution. Base line NADH formation was 10.7 ± 1.9% (n = 17 coverslips) in calcium-free solution. In the presence of NH4+/NH3 (5 mm) or TMA+/TMA (5 mm), it amounted to 23.2 ± 2.6% (n = 22 coverslips) (Fig. 7B) and 45.0 ± 6.6%
When astrocytes were pretreated with a calcium chelator, BAPTA/AM (10 μm), for 15 min, application of NH4+/NH3
at 5 (n = 96), 10 (n = 59), and 20 mm (n = 68) failed to elicit a [Ca2+]i increase (not shown). To test whether buffering [Ca2+]i had an effect on NADH formation, astrocytes were preincubated with BAPTA/AM (10 μm) for 15 min, and therefore subsequent application of NH4+/NH3 (5 mm) (Fig. 7B) or TMA+/TMA (5 mm) (Fig. 8B) did not
result in a significant increase in NADH formation as compared with control (i.e. in the absence of the weak bases) (9.0 ± 1.1 and 11.9 ± 2.8%, respectively).
Glutamate Transporter Inhibitors Do Not Affect NH4+/NH3 -stimulated Glutamate
Release—
To demonstrate whether NH4+/NH3 (5 mm) is capable of releasing glutamate by reversing glutamatetransporters, nonsubstrate glutamate transporter inhibitors were used. TBOA and DHK, EAAT-1 and EAAT-2 glutamate transporter inhibitors, respectively, did not influence NH4+/NH3 (5 mm)-triggered NADH formation.
NH4+/NH3 (5 mm) in the presence of TBOA and DHK stimulated a 24.3 ± 2.4% (n = 26 coverslips, p < 0.01) increase
in NADH formation (glutamate release) compared with control (preincubation with glutamate transporter inhibitors plus application of physiological buffer (9.6 ± 1.1%, n = 15 coverslips) (Fig. 7B). No significant difference was found between TBOA + DHK-pretreated and nonpretreated (23.2 ± 2.6%, n = 17 coverslips) upon stimulation of NH4+/NH3
(5 mm). This suggests that NH4+/NH3 (5 mm)-stimulated glutamate release is not due to the reversal of glutamate
transporters.
Similar results were obtained with TMA+/TMA (5 mm). With astrocytes pretreated with TBOA and DHK, TMA+/TMA (5 mm) stimulated a significant increase in NADH formation (glutamate release) (45.8 ± 3.2%, n = 19 coverslips, p < 0.01) as compared with controls (13.6 ± 2.8%, n = 14 coverslips). No significant difference was found between TBOA + DHK-pretreated and nonpretreated (40.4 ± 3.8%, n = 18 coverslips) upon stimulation of TMA+/TMA (5 mm) (Fig. 8B).
Approximate Concentrations of Glutamate Released upon Stimulation with TMA+/TMA
and NH4+/NH3 —
Using the standard curves as shown in Fig. 6 for NH4+/NH3 and Fig. 8 for TMA+/TMA, theapproximate glutamate levels in the bathing solution after a 10-min stimulation were calculated. As shown in Fig. 9, a 10-min NH4+/NH3 stimulation resulted in an increase in glutamate between 4 and 8 μm. For TMA+/TMA, we
estimated a similar increase in the bathing solution. With both weak bases, glutamate release was not affected when astrocytes were pretreated with TBOA + DHK. However, glutamate release was inhibited when astrocytes were preincubated with BAPTA/AM. There were no significant differences in the amount of released glutamate between the NH4+/NH3 (5
mm) and TMA+/TMA (5 mm) groups (Fig. 9). Fig. 9.Approximate concentration of glutamate released upon stimulation with 5 mm NH4+/NH3 or
TMA+/TMA. Using the respective standard curves for NH4+/NH3 as displayed in Fig. 5 and TMA+/TMA
as displayed in Fig. 7, approximate concentrations of released glutamate were calculated. Within the control and BAPTA/AM groups, the approximate released glutamate is within the range of 280–490 nm. Within the stimulated groups (NH4+/NH3 (5
mm) and TMA+/TMA (5 mm)), the calculated concentration of released glutamate ranged from 4 to 8 μm. Data are expressed as means ± S.E.
Significant difference between groups was calculated using a one-way analyisis of variance and post hoc Tukey's test. Differences were considered when p was <0.05.
DISCUSSION
Ammonia-triggered Release of Ca2+ from Intracellular ER Stores Is Due to a pH Shift—
Our data indicate that NH4+/NH3 triggers a calcium release from intracellular ER stores, since 1) the response was
similar in calcium-free buffer solution as compared with physiological (control) buffer and 2) the response was blocked after depleting internal calcium stores with thapsigargin, a potent inhibitor of the Ca2+-ATPase of the ER. A similar mechanism has been described for microglial cells (22).
NH4+/NH3 (5 mm) stimulated a transient increase in pHi in both physiological and calcium-free buffer. It is
commonly known that NH4+/NH3 application induces an increase in pHi in many different cell systems. This alkaline
shift is simply due to the rapid permeation of the gaseous NH3 into the cytosol and the subsequent formation of a new NH4+/NH3 equilibrium according to the Henderson-Hasselbach equation rendering the cytosol alkaline (17). We
therefore used another weak base, TMA+/TMA, which at 5 mm also stimulated a similar increase in pHi as NH4+/NH3
(5 mm) in both physiological and calcium-free buffer; however, pHi returned to base line much more slowly. This can be easily explained by the fact that NH4+/NH3 , but not TMA+, can pass through barium-sensitive K+ channels (33). In
other words, the increase of pHi with NH4+/NH3 (5 mm) is to some extent attenuated by an influx of NH4+/NH3 ions
through K+ channels (34). In support of this, when NH4+/NH3 (5 mm) was applied to cultured astrocytes along with
BaCl2 (a potassium channel blocker), a transient increase in pHi was observed; however, the return time to base line was longer, an effect similar to that seen upon TMA+/TMA (5 mm) application. Since TMA+/TMA (5 mm) mimicked the increases in pHi and [Ca2+]i] of NH4+/NH3 (5 mm), it supports the view that the calcium-dependent glutamate
release by NH4+/NH3 (5 mm) is triggered by a cytosolic alkaline shift.
Our Assay Detects Glutamate Release in the Presence of NH4+/NH3 —
Glutamate release canbe measured with techniques involving preloading cells with radiolabeled glutamate and subsequently measuring radiolabeled glutamate release after stimulus or with high performance liquid chromatography. Both techniques have the disadvantage that temporal resolution is lost and glutamate reuptake affects quantitative results. Alternatively, glutamate levels can be determined by an enzymatic assay; GDH deaminates glutamate to form α-ketoglutarate in concert with a conversion of NAD+ to NADH. Here any glutamate released from the astrocytes will be deaminated, and glutamate reuptake will be prevented. The concentration of the naturally fluorescent NADH is therefore proportional to the released glutamate. However, in this reaction, NH4+/NH3 is a by-product, and therefore
when applying NH4+/NH3 , product inhibition occurs concentration-dependently and consequently inhibits NADH
production. To overcome this inhibition, another enzyme, GPT, along with alanine, was added to amplify the NADH production, allowing for increased sensitivity for glutamate. With this amplifying system, glutamate release was measured quantitatively with respect to time and could be compared at a given NH4+/NH3 concentration. We used 5
mm NH4+/NH3 throughout the study, since 5 mm ammonia 1) demonstrates a significant increase in [Ca2+]i, 2) is
the pathophysiological concentration found in HE, and 3) does not display strong inhibition in the detection of glutamate (measured as low as 500 nm) with the amplifying enzymatic assay.
TMA+/TMA (5 mm) did not have any inhibitory effects on the amplifying enzymatic assay and therefore resulted in higher NADH formation as compared with NH4+/NH3 (5 mm). When calculating the glutamate concentrations from
the measured NADH levels using the respective NADH standard curves for NH4+/NH3 and TMA+/TMA, similar
concentrations of glutamate were released upon NH4+/NH3 and TMA+/TMA application (Fig. 8).
can occur, and these mechanisms are independent of an increase in [Ca2+]i. An increase in cytosolic [Ca2+] has also been shown to result in glutamate release, and this release activity was proposed to occur as a vesicular or fusion-mediated release (9–11). Several ligands acting on receptors that trigger an increase in [Ca2+]i in astrocytes initiate the release of glutamate from the cells. These include bradykinin (12), ATP (14, 15), and glutamate (13, 35) and even spontaneous increases in cytosolic [Ca2+] (16).
In our experiments, a 10-min application of NH4+/NH3 (5 mm) triggered an efflux of glutamate in both physiological
and calcium-free medium. However, increasing the intracellular buffering capacity with BAPTA/AM, the NH4+/NH3
(5 mm)-stimulated glutamate release was attenuated, strongly suggesting that ammonia stimulates glutamate release from astrocytes in a calcium-dependent manner.
Cell swelling-induced glutamate release has been demonstrated in cortical astrocytes exposed to a hypo-osmotic medium (36). Since astrocytic swelling is a pathological characteristic observed in acute HE, it was important to test whether glutamate release was due to cell swelling. In our study, using the isosbestic point of fura-2 (where the probe is Ca2+-insensitive and the emitted fluorescence is independent of intracellular calcium concentration), NH4+/NH3 (5 mm) application did not lead to astrocytic swelling (data not shown). Furthermore, with BAPTA/AM
having no effect on cell swelling, if NH4+/NH3 (5 mm)-stimulated glutamate release was a result of cell swelling,
glutamate release would have persisted when astrocytes were pretreated with BAPTA/AM, which was not the case. Therefore, the ammonia-induced glutamate release is not due to cell swelling. In support, Albrecht's group has shown that a 10-min treatment with 5 mm ammonia did not produce cell swelling in cultured rabbit Muller cells (37) or cultured cortical astrocytes (38). This further suggests that ammonia-induced astrocytic swelling may appear to develop with longer treatments of ammonia but not during a 10-min insult.
Astrocytes contain high affinity Na+-dependent glutamate transporters to regulate the concentration of extracellular glutamate. GLT-1 and GLAST, more commonly referred to as EAAT-2 and EAAT-1 respectively, are located in rat forebrain and cerebellum at birth. Szatkowski et al. (39) demonstrated that glutamate transporters reverse when insufficient energy is available to regulate the membrane potential. There is increasing evidence that an energy impairment develops in acute HE (40). We therefore tested the effect of glutamate transport inhibitors on NH4+/NH3
(5 mm)-triggered glutamate release. TBOA, a nonsubstrate EAAT-1 inhibitor, and DHK, an effective nonsubstrate EAAT-2 inhibitor, did not affect the amount of glutamate release following NH4+/NH3 (5 mm) application, suggesting
that ammonia stimulated glutamate release is not due to the reversal of glutamate transporters.
NH4+/NH3 (5 mm) induced an increase in [Ca2+]i (∼65 nm; Fig. 2D), which, according to Parpura and Haydon (41),
is sufficient to trigger glutamate release. In their study, a Δ[Ca2+]i of 56 nm released enough glutamate to result in a slow inward current on neighboring neurons. In addition, further increased [Ca2+]i leads to more glutamate release, suggesting a dose-response relationship (16). Taken together, our data point to a exocytotic glutamate release from astrocytes in response to NH4+/NH3 .
Astrocytes Release a Substantial Amount of Glutamate in Response to NH4+/NH3 or
TMA+/TMA—
We estimated the glutamate levels in the bathing solution after release from astrocytes to between 4 and 8 μm for NH4+/NH3 (5 mm) and TMA+/TMA (5 mm). If we assume that the astrocytes on our coverslip have avolume of 300 × 10–12 m3 (assuming a continuous layer on the coverslip with an average thickness of 5 μm) and a given bathing volume of 300 μl (equal to 300 × 10–9 m3), the intracellular astrocyte concentration prior to release would be 4–8 mm. This is about in the range as previously estimated, namely at 1–10 mm (42). It also implies that in the central nervous system extracellular space, glutamate would increase substantially. Assuming that astrocytes make up 30% of the brain volume and the extracellular space is about 20% (43), the same amount of glutamate released would lead to an extracellular glutamate concentration of 6–12 mm. Even if glutamate transporter activity might attenuate this high level, millimolar glutamate levels are realistic to assume, and at this concentration glutamate can result in hyperexcitability.
Significance of NH4+/NH3 -triggered Glutamate Release for HE in ALF—
Astrocytedysfunction has been assumed to be an important event in the pathologic cascade of HE. Swelling of the astrocytes is a major consequence that leads to brain edema, intracranial pressure, and fatal brain stem herniation. Increased extracellular brain glutamate has been consistently observed in different animal models of ALF where brain edema and increased intracranial pressure prevails. Our data indicate that NH4+/NH3 could trigger the release of glutamate
from astrocytes, possibly leading to an increase in extracellular brain glutamate and consequently resulting in glutamatergic dysfunction and an overstimulation of NMDA receptors on neurons (44). This would result in hyperexcitability, and it is known that seizures are not uncommon in patients with ALF. The astrocytic end feet contact the blood capillaries and are thus the first elements to be exposed to elevated NH4+/NH3 from the blood. The
level of NH4+/NH3 used in our study is in the range observed after ALF (32). For this to occur in vivo, NH4+/NH3
fluctuations at the astrocyte membrane in the millimolar range would have to arise; however, precise temporal NH4+/NH3 transients in vivo data are not available. Ammonia fluctuations and subsequently cytosolic alkaline shifts
are larger at the onset of ALF, suggesting that a deregulation of glutamate release by ammonia from astrocytes may be an early phenomenon and in addition one of the sources leading to this increased extracellular brain
glutamate/glutamatergic dysfunction consistently found in different models of ALF (45).
F
OOTNOTES
This work was supported by Deutsche Forschungsgeneinschaft and the Alexander von Humboldt Foundation. The costs of publication of this article were defrayed in part by the payment of page charges. This article must therefore be hereby marked “advertisement” in accordance with 18 U.S.C. Section 1734 solely to indicate this fact.
R
EFERENCES
1. Felipo, V., and Butterworth, R. F. (2002) Prog. Neurobiol. 67, 259–279
2. Bosman, D. K., Deutz, N. E. P., Maas, M. A. W., van Eijk, H. M. H., Smit, J. J. H., de Hann, J. G., and Chamuleau, R. A. F. M. (1992) J. Neurochem. 59, 591–599
3. de Knegt, R. J., Schalm, S. W., van der Rijt, C. C. D., Fekkes, D., Dalm, E., and Hekking-Weyma, I. (1994) J. Hepatol. 20, 19–26
4. Michalak, A., Rose, C., Butterworth, J., and Butterworth, R. F. (1996) Hepatology 24, 908–914
5. Hilgier, W., Zielinska, M., Borkowska, H. D., Gadamski, R., Walski, M., Oja, S. S., Saransaari, P., and Albrecht, J. (1999) J. Neurosci. Res. 56, 76–84
6. Chan, H., Hazell, A. S., Desjardins, P., and Butterworth, R. F. (2000) Neurochem. Int. 37, 243–248
7. Knecht, K., Michalak, A., Rose, C., Rothstein, J. D., and Butterworth, R. F. (1997) Neurosci. Lett. 229, 201–203 8. Rose, C., Michalak, A., Rambaldi, A., Chatauret, N., Pannunzio, M., and Butterworth, R. F. (2000) Hepatology
31, 872–877
9. Bezzi, P., Gundersen, V., Galbete, J. L., Seifert, G., Steinhauser, C., Pilati, E., and Volterra, A. (2004) Nat. Neurosci. 7, 613–620
10. Zhang, Q., Pangsic, T., Kreft, M., Krzan, M., Li, N., Sul, J.Y., Halassa, M., Van Bockstaele, E., Zorec, R., and Haydon, P.G. (2004) J. Biol. Chem. 279, 12724–12733
11. Kreft, M., Stenovic, M., Rupnick, M., Potokar, M., Pangrsic, T., and Haydon, P.G. (2004) Glia 46, 437–445 12. Parpura, V., Basarsky, T. A., Liu, F., Jeftinija, K., Jeftinija, S., and Haydon, P. G. (1994) Nature 369, 744–749 13. Bezzi, P., Carmignoto, G., Pasti, L., Vesce, S., Rossi, D., Rizzini, B. L., Pozzan, T., and Volterra, A. (1998) Nature
391, 281–285
14. Innocenti, B., Parpura, V., and Haydon, P. G. (2000) J. Neurosci. 20, 1800–1808
17. Marcaggi, P., and Coles, J. A. (2001) Prog. Neurobiol. 64, 157–183 18. Speake, T., and Elliot, A. C. (1998) J. Physiol. (Lond.) 506, 415–430
19. Danthuluri, N. R., Kim, D., and Brock, T. A. (1990) J. Biol. Chem. 265, 19071–19076
20. Shorte, S. L., Collingridge, G. L., Randall, A. D., Chappell, J. B., and Schofield, J. G. (1991) Cell Calcium 12, 301– 312
21. Mironov, S. L., and Lux, H. D. (1993) Neuroreport 4, 1055–1058
22. Minelli, A., Lyons, S., Nolte, C., Verkhratsky, A., and Kettenmann, H. (2000) Eur. J. Physiol. 439, 370–377 23. Lyons, S., and Kettenmann, H. K. (1998) J. Cereb. Blood Flow Metab. 18, 521–530
24. Ayoub, G. S., and Copenhagen, D. R. (1991) J. Neurosci. Methods 37, 7–14 25. Nicholls, D. G., Sihra, T. S., and Sanchez-Prieto, J. (1987) J. Neurochem. 49, 50–57 26. Grynkiewicz, G., Poenie, M., and Tsien, R. Y. (1985) J. Biol. Chem. 260, 3440–3450
27. Usachev, Y., Schmigol, A., Pronchuk, N., Kostyuk, P., and Verkhratsky, A. (1993) Neuroscience 57, 845–859 28. Boyarsky, G., Ransom, B., Schlue, W-R., Davis, M. B. E., and Boron, W. F. (1993) Glia 8, 241–248
29. Anderson, C. M., Bridges, R. J., Chamberlin, A. R., Shimamoto, K., Yasuda-Kamatani, Y., and Swanson, R. A. (2001) J. Neurochem. 79, 1207–1216
30. Salter, M. W., and Hicks, J. L. (1994) J. Neurosci. 14, 1563–1575
31. Rose, C. R., and Ransom, B. R. (1998) in pH and Brain Function (Kaila, K., and Ransom, B. R., eds) pp. 253– 275, Wiley-Liss, New York
32. Swain, M., Butterworth, R. F., and Blei, A. T. (1992) Hepatology 15, 449–453 33. Allert, N., Köller, H., and Siebler, M. (1998) Brain Res. 782, 261–270
34. Kaila, K., and Ransom, B. R. (1998) in pH and Brain Function (Kaila, K., and Ransom, B. R., eds) Wiley-Liss, New York
35. Araque, A., Li, N., Doyle, R. T., and Haydon, P. (2000) J. Neurosci. 20, 666–673
36. Kimelberg, H. K., Goderie, S. K., Higman, S., Pang, S., and Waniewski, R. A. (1990) J. Neurosci. 10, 1583–1591 37. Faff-Michalak. L., Reichenbach, A., Dettner, D., Kellner, K., and Albrecht, J. (1994) Glia 10, 114–120
38. Albrecht, J., Bender, A. S., and Norenberg, M. D. (1994) Brain. Res. 660, 228–232 39. Szatkowski, M., Barbour, B., and Attwell, D. (1990) Nature 348, 443–446
40. Zwingmann, C., Chatauret, N., Leibfritz, D., and Butterworth, R. F. (2003) Hepatology 37, 420–428 41. Parpura, V., and Haydon, P. G. (2000) Proc. Natl. Acad. Sci. U. S. A. 97, 8629–8634
42. Longuemare, M. C., Rose, C. R., Farrell, K., Ransom, B. R., Waxman, S. G., and Swanson, R. A. (1999) Neuroscience 93, 285–292
43. Nicholson, C., and Sykova, E. (1998) Trends Neurosci. 21, 207–215
44. Hermenegildo, C., Monfort, P., and Felipo, V. (2000) Hepatology 31, 709–715 45. Rose, C. (2002) Metab. Brain Dis. 17, 251–261
![Fig. 1. NH 4+ /NH 3 stimulates a transient increase in [Ca2+]i in cultured astrocytes](https://thumb-eu.123doks.com/thumbv2/123doknet/7206332.200980/4.918.214.710.750.915/fig-nh-nh-stimulates-transient-increase-cultured-astrocytes.webp)

![Fig. 5. TMA+/TMA (5 mm) stimulates a transient increase in [Ca2+]i in both physiological (control) and calcium-free buffer](https://thumb-eu.123doks.com/thumbv2/123doknet/7206332.200980/8.918.114.636.138.735/fig-stimulates-transient-increase-physiological-control-calcium-buffer.webp)