COGENERATION IN THE U.S.: AN ECONOMIC AND TECHNICAL ANALYSIS
FREDERICK H. PICKEL November 1978
MIT ENERGY LABORATORY REPORT MIT-EL 78-039
i, or
DISCLAIMER
This report was prepared as an account of work sponsored, in part, by the United States Government. Neither the United States nor the United States Department of Energy, nor any of their employees, makes
any warranty, express or implied, or assumes any legal liability or responsibility for the accuracy, completeness, or usefulness of any in-formation, apparatus, product, or process disclosed, or represents that its use would not infringe privately owned rights. Reference herein to any specific commercial product, process, or service by trade name, mark, manufacturer, or otherwise, does not necessarily constitute or
imply its endorsement, recommendation, or favoring by United States Government or any agency thereof. The views and opinions of authors expressed herein do not necessarily state or reflect those of the United
States Government or any agency thereof.
In
I.
ABSTRACT
Traditionally, only space heating and transportation have con-sumed more fuel than industrial process steam generation. Several re-cent studies have examined electricity and industrial steam supply and have recommended vigorous federal efforts to increase the cogeneration, or joint production, of electricity and process steam. The conceptual approach and analytic methods employed in these studies contain flaws
that make them incomplete. The studies' recommendations are premised upon the existence of distortions in the markets surrounding
cogenera-tion, but they offer only anecdotal evidence of such market failures. They propose increased cogeneration, citing aggregate energy savings for a single year and cumulative capital savings, but the analytic techniques they use in simulating market behavior and evaluating the desirability of various levels of cogeneration lack needed sophistica-tion.
This research addresses several of the methodological objections to the earlier studies. To unite this effort, the report poses two focal questions on cogeneration policy and economics:
· Can the historical decline in cogeneration's importance be explained by changes in fuel prices and technologies alone? · What is the best future role for cogeneration if the choice
is based on economic efficiency?
First, the markets associated with cogeneration are examined from a qualitative perspective, employing the classic basic conditions/market structure/conduct/performance approach of industrial economics to ex-plore the potential for inefficient market performance. Engineering production and cost functions are developed for a simple cogeneration plant design, offering insights into the economies of scale and joint production problems involved in the choice between cogeneration and se-parated production alternatives. Second, a multi-period linear program-ming model, called the Joint Generation Supply Model or JGSM, is form-ulated to simulate competitive market behavior in the aggregate U.S. electricity and process steam supply markets throughout a given time in-terval. JGSM is used to study the historical performance of these
markets for 1960 to 1972 and the future role ot cogeneration for 1975 to 2000, Appendices survey cogeneration technologies and the issues in integrating cogeneration plants into the utility system.
The modeling of the historical question shows the decline can be explained by changes in cost conditions, but these results are very sensitive to the engineering cost assumptions. Analysis of cogenera-tion's future role indicates cogeneration should increase from its 4.5% share of electricity supply in 1975 to 9% in 1985; it should also serve more than half the process steam supply. If cogeneration remains at its 1975 share through 2000, the additional costs imposed are worth about $10 billion in discounted capital and operating expenses. Too much cogeneration can hurt as much as too little: forcing it up to a
20% share by 1985 imposes similar costs. For comparison of these losses to another issue, JGSM calculated that failure to develop low-Btu coal-gasifying combined cycle power technologies results in losses worth $4 billion.
PREFACE
An exposure to the early stages of the first Dow Chemical Co. et al. (1975a) industrial cogeneration study inspired this author to undertake a different approach to the economic analyses in that effort and the ThermoElectron (1976) and Resource Planning Associates (1977)
cogenera-tion policy studies. This report, a minor revision of a thesis completed
in the summer of 1978, is intended to provide better insight into the
complex economics surrounding cogeneration rather than suggest policy guidelines.
Since the research was carried out over an extended period, not all the technological aspects are up to date. The discussions are
based primarily on steam topping cogeneration. This limitation, however, does not restrict its comments on the historical and institutional as-pects of cogeneration. The examination of the future potential for co-generation, primarily Chapter 5, should be treated as a new analytical approach to this problem -- with the qualitative aspects of that discussion
still holding.
This work is a portion of research efforts on utility operation and planning being carried out within the Utility Systems Program at the MIT Energy Laboratory.
ACKNOWLEDGEENTS
This research was carried out in association with the Energy Laboratory and the Ralph M. Parsons Laboratory for Water Resources and Hydrodynamics at the Massachusetts Institute of Technology. The author was supported, in part, by a National Science Foundation
Energy-Related Graduate Traineeship in the area of coal and oil shale utilization and by research funds provided through the institutional agreement between the M.I.T. Energy Laboratory and the U.S. Department
of Energy. The Civil Engineering Systems Laboratory of the Department of Civil Engineering supplied the computer funds.
I am very grateful to Professors David H. Marks and David C, White for their encouragement and direction of the thesis from which this report derives.
This work has also benefited from discussions with Professors M.A. Adelman, H.D. Jacoby, J.P. Longwell, A.S. Manne, F.C. Schweppe,
Dr. Robert Barbera and Mr. William J. Jones.
Mrs. Patricia Dixon patiently guided the production of this
document. Liza Schofield, Mary Rudser, Michelle Jarrabet, Betsy Payton, Betty Koch, Kinney Thiele, Rick Levin and Carol Chilk cheerfully and accurately typed and prepared figures for this report.
TABLE OF CONTENTS ABSTRACT PREFACE ACKNOWLEDGEMENTS TABLE OF CONTENTS LIST OF TABLES LIST OF FIGURES 1 INTRODUCTION
1.1 Cogeneration in U.S. Electricity and Industrial Steam Supply
1.2 A Survey of Studies on Cogeneration Economics and Policy
1.3 The Focus and Structure of the Report Footnotes for Chapter 1
2 ISSUES IN THE MARKET STRUCTURE AND MICROECONOMICS ASSOCIATED WITH COGENERATION
2.1 A Description of the Steam and Electricity Market Participants
2.2 The Basic Conditions, Structure and Conduct in the Process Steam and Electricity Markets
2.2.1 Basic Conditions
2.2.1.1 The Demand Side 2.2.1.2 The Supply Side 2.2.2 Market Structure
2.2.3 Market Conduct 2.3 Conclusions
Footnotes for Chapter 2
3 4 5 6 10 12 15 16 22 29 32 34 37 42 43 43 50 68 78 81 83
Table of Contents (cont'd)
3 A PROCESS ANALYSIS MODEL FOR EXAMINING AGGREGATE ELECTRICITY
AND STEAM SUPPLY: JGSM 87
3.1 Selection of an Analytic Approach for Studying the
Aggregate Economics of Cogeneration 87
3.2 A Comparison of JGSM to Other Energy Models 92 3.3 The Joint Generation Supply Model (JGSM) 95
3.3.1 Overview of the Model 95
3.3.2 Algebraic Formulation 102
3.4 Summary and Conclusions 121
Footnotes for Chapter 3 123
4 JGSM ANALYSIS FOR 1960 TO 1972: CAN THE LEVELS OF
COGENERA-TION BE EXPLAINED BY COST INFLUENCES ALONE? 125 4.1 The Model Formulation for the Historical Analysis 125
4.2 The Results 130
4.2.1 The Base Case 130
4.2.2 The Sensitivity Analysis 136
4.3 Concluding Comments 150
Footnotes for Chapter 4 151
5 JGSM ANALYSIS FOR 1975 TO 2000: WHAT IS THE FUTURE ROLE
FOR COGENERATION? 152
5.1 The Model Formulation for the Prospective Analysis 152
5.2 The Results 160
5.2.1 The Base Case and Its Comparison to the
Historical Trend 160
5.2.2 Sensitivity Studies 168
5.3 Concluding Comments 180
Table of Contents (continued)
6 CONCLUSIONS
6.1 Review of Results
6.2 Directions for Further Research Footnotes for Chapter 6
APPENDICES
A. TECHNOLOGIES FOR POWER AND INDUSTRIAL STEAM GENERATION A.1 Separated Generation Technologies
A.i.1 Power Generation
A.1.l.1 Current Power Generation Technologies A.1.1.2 Advanced Power Generation Technologies A.1.2 Steam Generation
A.2 Joint Generation Technologies
A.2.1 Back-Pressure Joint Generation
A.2.2 Back-Pressure/Condensing Power Joint Generation A.2.3 Advanced Joint Generation Systems
A.3 Summary
Footnotes for Appendix A
B. INCORPORATING COGENERATION PLANTS INTO POWER SYSTEMS OPERATION AND CAPACITY PLANNING
B.l Overview of Problem Areas B.l.1 Plant Protection B.1.2 System Stability B.1.3 System Operation
B.1.4 Capacity Expansion Planning
B.1.5 Corporate and Regulatory Planning
183 184 188 191 192 194 194 198 199 210 219 220 227 237 245 248 252 252 252 253 254 257 260
Table of Contents (continued) APPENDICES
B. (continued)
B.2 A Booth-Baleriaux Simulation of a Cogeneration Plant's 261 Influence on a Power System's Operating Costs
B.2.1 Problem Formulation 261
B.2.2 Results 269
B.3 Conclusions 271
Footnotes for Appendix B 273
C. COST AND ENERGY CONVERSION FACTORS 275
D. DATA SUMMARY FOR THE 1960 TO 1972 ANALYSIS 277 E. DATA SUMMARY FOR THE 1975 TO 2000 ANALYSIS 285
F. JGSM PROGRAM DESCRIPTION 295
BIBLIOGRAPHY
A. General 298
B. Modeling, Industrial Organization, and Micro-Economics 301
C. Technology Related 306
D. Power Systems Operation and Planning 309
E. Cost and Economic Data Sources 311
LIST OF TABLES
Chapters
1.1 Comparison of the Major Cogeneration Studies 23 e
2.1 Summary of the Market Interactions 41
2.2 Estimates of Electric Energy, Steam Energy, and
Steam Pressure Distributions in 1980 45 2.3 Comparison of Regional Energy Consumption Patterns
in 1972
2.4 Energy Consumption Growth Rates 51
2.5 Estimated Concentration in Electric Generating Capacity Within 100 and 200 Miles of Ten Major Load Centers, 1968
3.1 Summary of Constraint Rows 103
3.2 Summary of Activities
3.3 Summary of Subscripts and Superscripts 105 3.4 Summary of Subscript and Superscript Limits and
Abbreviations 106
4.1 Technologies Used in 1960-1972 Analysis 127 5.1 Technologies Used in 1975-2000 Analysis 155 6.1 Summary of the Results for Comparison to Earlier Reports 186
APPENDICES
A.1 Standard Power Generation Technologies, EC, EN, EP and EH 200 A.2 Advanced Combined-Cycle Oil-Fired Power Generation
Technology EO 206
A.3 Coal Gasification Processes for Production of Low-Btu Gas 211 A.4 Advanced Combined-Cycle Coal-Fired Power Generation
Technology EA 212
A.5 Field-Erected Coal-Fired Boilers BF 217
A.6 Low Sulfur Oil-Fired Packaged Boilers BP 218 A.7 Back Pressure By-Product Power Plants JB 226 A.8 Large By-Product Power Plants with Supplemental Condensing
Power JL and JI 231
A.9 Coal-Fired Dual-Purpose Power Plants JC 232
A.10 Dual Purpose Nuclear Plants JN 234
A.11 Advanced Combined-Cycle, Oil-Fired Joint Generation 242 Plants JO
A.12 Advanced Combined Cycle, Coal-Fired Joint Generation
Plants JA 244
LIST OF TABLES (continued)
APPENDICES (continued)
B.1 Cogeneration Plant Types for Operating Cost Simulation 263 B.2 "Scaled Down Scenario D" Synthetic Utility System Used 265
as the Base Case Power System
B.3 Assumed Load Characteristics 266
B.4 Boiler Costs 267
B.5 Fuel Prices 267
B.6 Nuclear System 268
B.7 Reductions in Combined Electricity and Steam Costs 270 Through the Addition of a Cogeneration Plant
D.1 Summary of Technologies Used in Simulation, 1961-1972 278 D.2 Operation and Maintenance Costs for Simulation, 1961-1972 279
D.3 Fuel Prices for 1961-1972 Simulation 280
D.4 Capital Costs for Simulation, 1961-1972 281
D.5 Cash Flows During Construction 282
D.6 Pre-Specified Production, Electricity and Steam Energy 283 Demand, and Historical Electricity Cogeneration for
Simulation, 1961-1972
D.7 Percentage of Initial Capacity Retiring in a Period 284 Because of Physical Obsolesence for 1961-1972 Simulation
Period
E.1 Summary of Technologies Used in 1976-2000 Modeling 286 E.2 Summary of Technologies Used in 1976-2000 Modeling, Part 2 287
E.3 Fuel Prices for Modeling, 1976-2000 288
E.4 Capital Costs for Modeling, 1976-2000 289
E.5 Cash Flows during Construction 290
E.6 Pre-Specified Production, Electricity and Steam Energy 291 Demand, and the Historical Extrapolation of the
Cogeneration Share for the 1976-2000 Modeling
E.7 Percentage of Initial Capacity Retiring in a Period 292 Because of Physical Obsolesence in 1976-2000 Modeling
E.8 Upper Limits on New Capacity Introduced Annually Because 293 of New Technology or Lead Times in the 1976-2000 Modeling
E.9 Limitations on the Maximum Share of Certain Technologies 294 in New Capacity
F.1. Model Non-Constraint Rows not Described in Chapter 3 297
LIST OF FIGURES
Chapter 1
1.1 1968 U.S. Energy Consumption 17
1.2 The Institutional Alternatives for Steam and Power Supply 19 1.3 The Share of Industrial Electricity Generation in Total
U.S. Electricity Generation 20
1.4 The Ratio of Industrial Electricity Generation to the
FRB Index of Total Manufacturing Production 21
Chapter 2
2.1 A Simple Model of Industrial Organization Analysis 36 2.2 The Participant View of Steam and Electricity Markets 38
2.3 The Production Process View of the Steam and Electricity
Markets 40
2.4 The Cumulative Distribution of Total Industrial Steam
Load in 1967 46
2.5 Flow Sheet for the Simplified Back-Pressure Joint Generation Plant Portrayed by the Engineering
Production Function 56
2.6 Steam-Related Capital Costs as a Function of Pressure 59 2.7 Production Possibilities Curves for Fixed Fuel Input
and Varying Levels of Capital Investment 61 2.8 Production Possibilities Curves for Fixed Capital
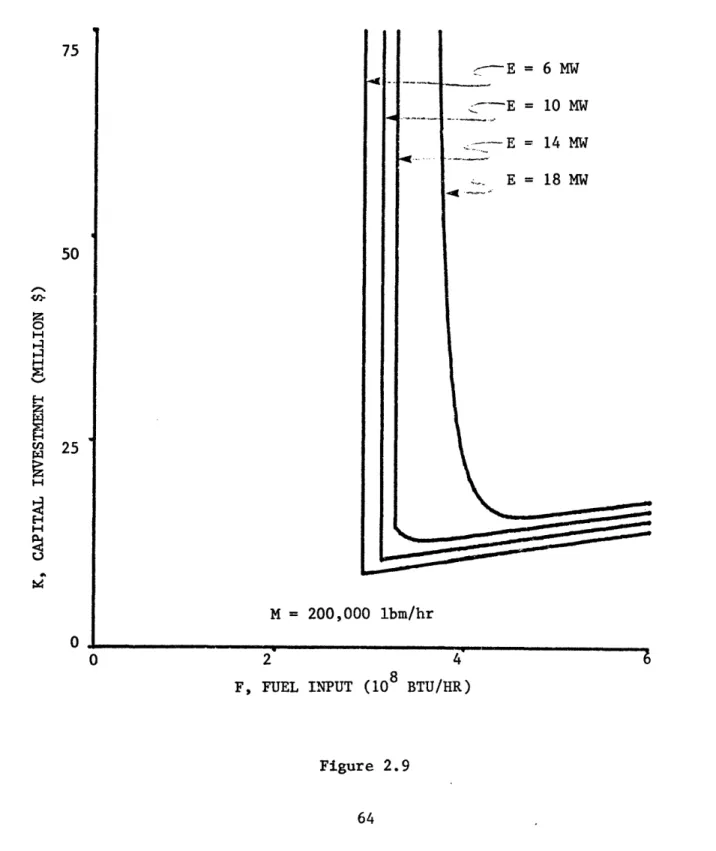
Investment and Varying Levels of Fuel Input 62 2.9 Isoquants for Fixed Designed Steam Output and Varying
Levels of Designed Power Output 64
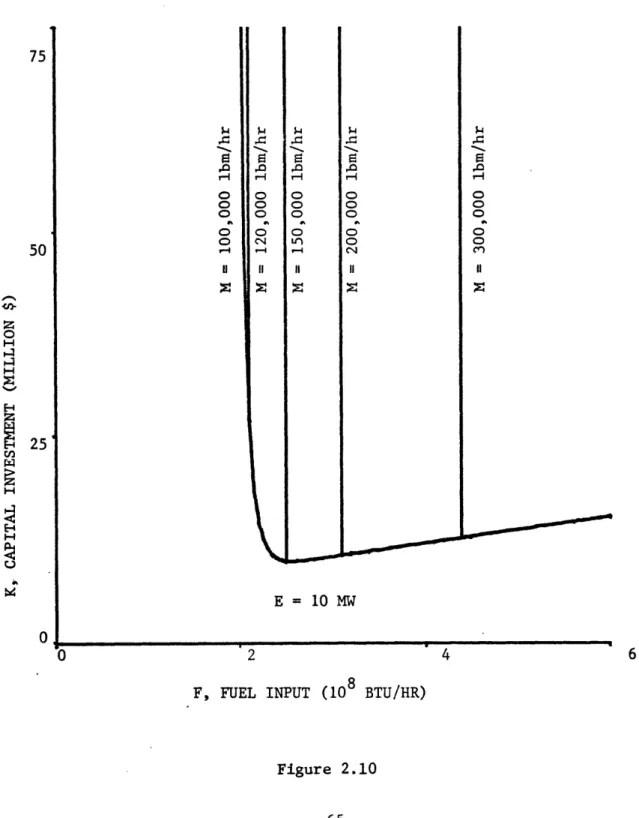
2.10 Isoquants for Fixed Designed Power Output and Varying
Levels of Designed Steam Output 65
2.11 Iso-Cost Curves for a Back-Pressure Cogeneration Plant 67 2.12 Iso-Cost Surface for Process Steam and Electricity
Supplies 76
Chapter 3
3.1 Calculation of Production Costs 117
Chapter 4
4.1 Electricity Generation: Base Case 131
4.2 Process Steam Generation: Base Case 132
4.3 Fuel Consumption for Process Steam and Electricity
Generation: Base Case 133
4.4 The Share of Electricity Cogeneration Predicted by JGSM Compared to the Actual Share of Industrial Electricity
LIST OF FIGURES (Continued)
Chapter 4 (continued)
4.5 Comparison of the JGSM Prediction of Cogeneration's Role in
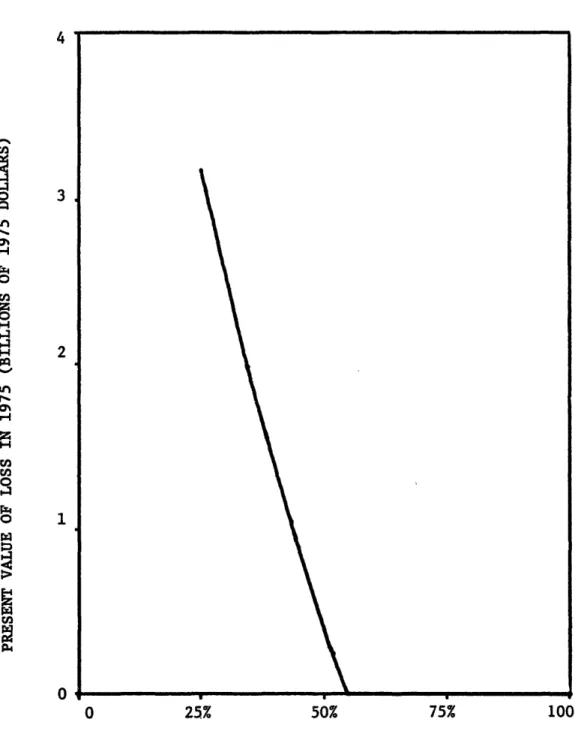
Steam Supply and the Estimate of the Actual Behavior 135 4.6 Welfare Loss Due to Joint Generation Restrictions as a Function
of O&M Cost Assumptions 137
4.7 Electricity Generation: Joint Generation O&M Costs at 25%
of Base Case (Case A) 139
4.8 Process Steam Generation: Joint Generation O&M Costs at 25%
of Base Case (Case A) 140
4.9 Electricity Generation: Joint Generation O&M Costs at 25% of Base Case and Joint Generation Restricted to Historical
Levels (Case B) 141
4.10 Process Steam Generation: Joint Generation O&M Costs at 25% of Base Case and Joint Generation Restricted to Historical
Levels (Case B) 142
4.11 Electricity Generation: Case Comparison of the Joint
Genera-tion Share 143
4.12 Steam Generation: Case Comparison of the Joint Generation
Share 144
4.13 Coal Consumption for Process Steam and Electricity Generation:
Case Comparison 145
4.14 Oil and Gas Consumption for Process Steam and Electricity
Generation: Case Comparison 146
4.15 Capital Investment Entering Service for Process Steam and
Electricity Generation: Case Comparison 147 4.16 Utility-Type Capital Investment Entering Service for Process
Steam and Electricity Generation: Case Comparison 149
Chapter 5
5.1 Electricity Generation: Base Case 161
5.2 Process Steam Generation: Base Case 162
5.3 Fuel Consumption for Process Steam and Electricity
Generation: Base Case 164
5.4 Capital Investment Entering Service for Process Steam and
Electricity Generation: Base Case 165
5.5 The Shadow Prices for Power and Process Steam: Base Case 167 5.6 The Effect of the Discount Rate on Welfare Losses 169 5.7 Joint Electricity Production: Case Comparison 170 5.8 Joint Process Steam Production: Case Comparison 171 5,9 Welfare Losses Due to Restrictions on Joint Electricity
Generation Levels for 1985 and After 173
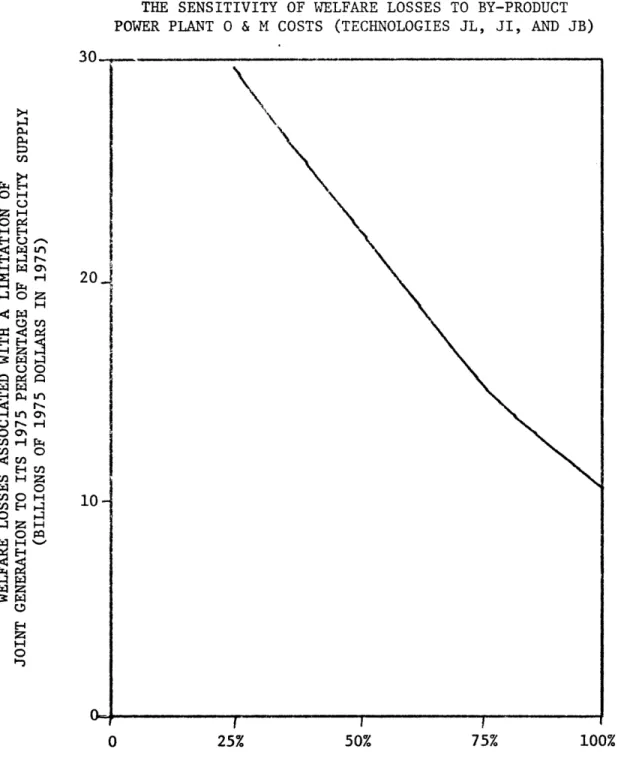
5.10 The Sensitivity of Welfare Losses to By-Product Power Plant
LIST OF FIGURES (Continued)
Chapter 5 (continued)
5.11 The Effect of Reduced O&M Costs for By-Product Power Plants (Technologies JB, JI, and JL) on the optimal level of
Joint Generation 175
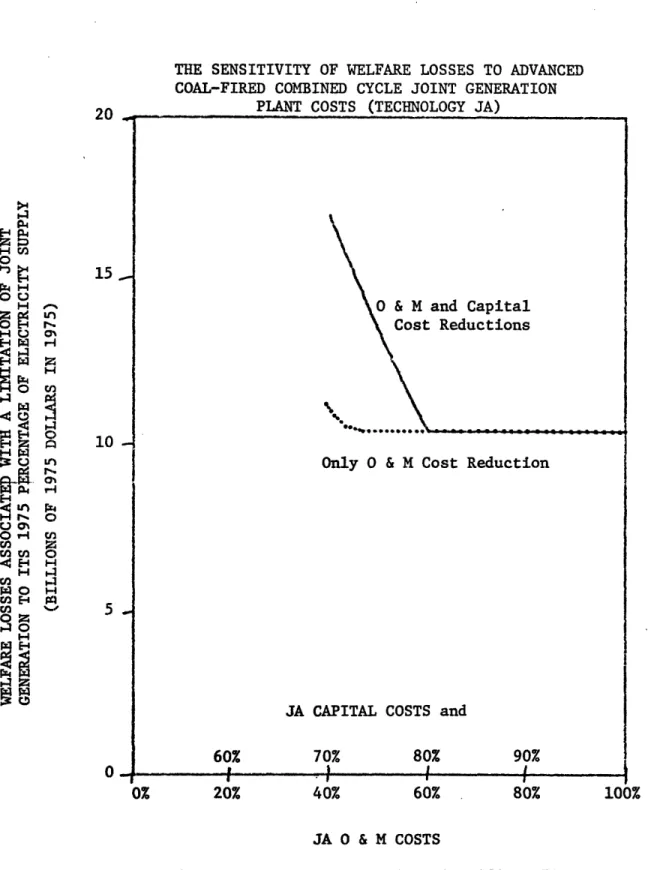
5.12 The Sensitivity of Welfare Losses to Advanced Coal-Fired
Combined Cycle Joint Generation Plant Costs (Technology JA) 177 5.13 The Effect of Reduced Costs for Advanced Coal-Fired Combined
Cycle Joint Generation Plants (Technology JA) on the
Optimal Levels of Joint Generation 178
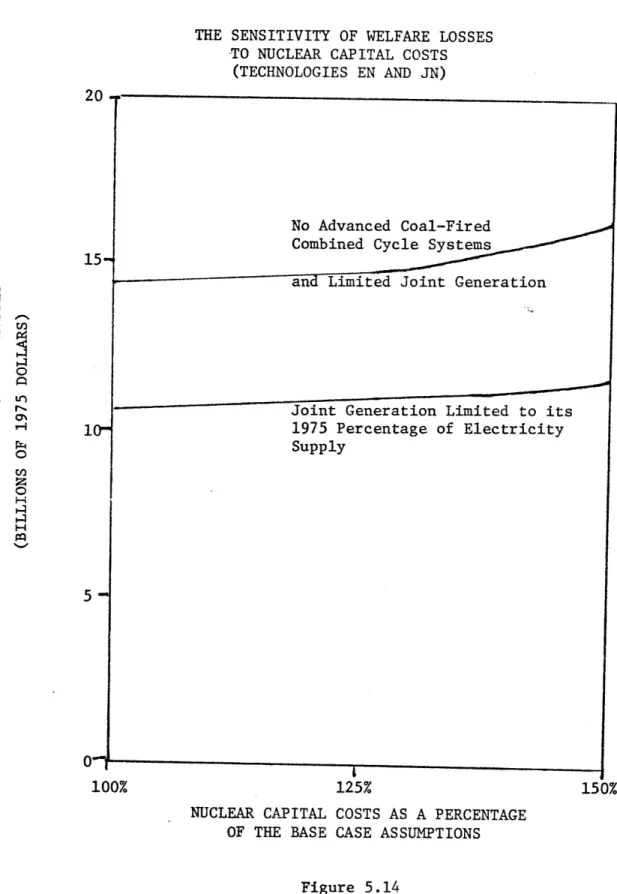
5.14 The Sensitivity of Welfare Losses to Nuclear Capital Costs
(Technologies EN and JN) 179
Chapter 6
None
APPENDICES
A.1 A Simplified Power Plant Flow Sheet 195
A.2 Energy Balances for Steam and Power Generation 196 A.3 A Simplified Power Plant Temperature-Energy Diagram 197
A.4 A Simplified Flow Sheet--Oil Gasifier/Combined-Cycle
Power Plant 205
A.5 A Simplified Flow Sheet--Coal Gasifier/Combined-Cycle
Power Plant 208
A.6 Industrial Boiler Steam Supply Flow Sheet 213 A.7 Industrial Boiler Steam Supply Temperature-Entropy Diagram 215 A.8 Back-Pressure Joint Generation Plant Flow Sheet 221 A.9 Back-Pressure Joint Generation Plant Temperature-Entropy
Diagram 223
A.10 Back-Pressure with Exhaust Condensing Turbine Joint
Generation Plant Flow Sheet 228
A.11 Back-Pressure with Exhaust Condensing Joint Generation
Plant Temperature-Entropy Diagram 230
A.12 A Simplified Flow Sheet--Oil Gasifier/Combined-Cycle
By-Product Power Plant Employing Back-Pressure Generation 241 A.13 A Simplified Flow Sheet--Coal Gasifier/Combined-Cycle
By-Product Power Plant Employing Back-Pressure Generation 243 F.1 Computer Program Flow Chart for JGSM Solution 296
Chapter 1
INTRODUCTION
Early proposals for alleviating the "energy crisis" induced by the 1973 oil embargo concentrated upon projects for providing new sources of energy supplies. The nation treated energy conservation measures as only short-term solutions - mandatory controls on energy consuming
ac-tivities to get the U.S. through the transition to new sources of supply. In the industrial sector, most spokesmen felt that industry was using energy as efficiently as possible. A small group, however, began to present a different story for the nation and, specifically, for the industrial sector: they contended energy conservation through the more effective utilization of fuels could achieve significant energy savings without necessarily forcing reductions in the consumption of final goods. Furthermore, they argued that the savings were technologically and economically feasible before the embargo but institutional barriers often deterred the reassessment of changes or prevented their implementa-tion.2 Given the huge shifts in fuel prices since the embargo, they rea-soned that many more opportunities for more thermodynamically efficient utilization of fuel were now eminently desirable.
Processes for the integrated production of electricity and industrial process steam, or cogeneration, attracted a great deal of attention in the debates on industrial energy conservation. Several major studies and a number of shorter ones estimated the U.S. could obtain a large fraction of its electric generation and process steam needs from cogen-eration plants while saving both fuel and capital. Most of the studies
cited institutional barriers when questioning why the role of cogen-eration declined in both electricity and steam energy supply;5 two
studies, however, asserted that the decline occurred primarily because of equipment and fuel costs changes.6 All the studies sup-ported their statements on institutional barriers with only anecdotal evidence -- none applied any formal analytic methods to the
question.
This report first, focuses on the question of whether or not the historical changes in cogeneration's importance in electricity and industrial process steam supply can be explained by cost influ-ences alone. Second, it uses a model developed for addressing this question to examine the future role for cogeneration. The effort makes several significant improvements in the approach followed by
the earlier studies. This chapter presents a brief introduction to the historical role of cogeneration and then reviews several earlier studies. The chapter concludes with a description of the report's purpose and structure.
1.1 COGENERATION IN U.S. ELECTRICITY AND INDUSTRIAL STEAM SUPPLY Fuels for the generation of industrial process steam constituted nearly 17% of the total U.S. fuel consumption in 1968, as shown by Figure 1.1. Only transportation and combined residential and commer-cial space heating exceed this share in the end uses of fuels. Elec-tricity generation, which is considered an intermediate process before
the end use of energy, received nearly 21% of the total fuels directly consumed. Any change in the fuel consumption patterns and conversion
1968 U.S. ENERGY CONSUMPTION
1968 U.S. ENERGY CONSUMPTION
9.3%
Figure 1.1
Source: Stanford Research Institute (1972) _ -- -__
efficiency that affects both process steam and electricity generation could be expected to have a major impact on total fuel consumption and, therefore, upon the overall national costs for energy supplies.
A number of organizational options exist for supplying electricity and process steam. As illustrated by Figure 1.2A, an industry and a utility can separately produce steam and power. Alternatively, as in Figure 1.2B and 1.2C, industry can produce steam and power in a by-product cogeneration plant, or the utility can cogenerate steam for industry in a dual-purpose power plant. The cogeneration plants can also be jointly owned. For a period survey of the technologies used for cogeneration, see Appendix A.
The concept of cogeneration is certainly not new: in the first half of this century a number of paper mills provided power for the local towns in this manner. The importance of congeneration has declined considerably since that time; as illustrated by Figure 1.3, its share in total electricity supply has dropped from 18% in 1941 to 4.3% in 1975. In contrast to the U.S., about 12% of West Germany's electricity generation comes from industrial cogeneration.7 For the U.S., the absolute level has remained within a narrow band since 1960; if steam demand is the key determinant of cogenerated electricity pro-duction, the faster growth rate of electricity generation relative to manufacturing output may partially explain the steady decline of cogeneration in electricity supply. Figure 1.4 indicates the role of cogeneration in industrial steam supply has clearly declined only since the late 1950's.7a The ratio of industrial generation to manu-facturing output varied erratically before that time. This implies significant changes occurred in the early 1960's.
THE INSTITUTIONAL ALTERNATIVES FOR STEAM AND POWER SUPPLY
INDUSTRY ELECTRIC UTILITY
O
Steam Process Fuel ,l Power )oling ower Steam Process Process C. mnFuel
-L
Power Condensate I Turbiner·-·--
~
.Cooling
[eneoIto-> Tower Steam eam Steam Boiler -4 Fuel Figure 1,2Source: Dow (1975a)
19 A.
C
Proce: B. a ne---0w o O ,-4 .fc) o 4 H
r.
QCa
4 4 -1-4 k Cn * *4 0 a o cV) ej 0 Ci I vH4'1
44 W J ; J fio 3 C ca at C Hn oe Qv
a
Px V .-an v)Percentage Share
20.z
0
H 0 H0
r
C) 0 Hz
E-4 H0
H CC '-4 H C-) 0 HE-J C '-48
Cr. CV-I V-4 0
Ratio
21 ZZ H
jz ; wz
r
40
H P4 H H 0 H EH E-- E Oz
H P O Z U . UC* 4J u 'o
4' I 4 :) .-u O 4J O O CJPc
^r-.
U H1.2 A SURVEY OF STUDIES ON COGENERATION ECONOMICS AND POLICY
This section reviews the three major studies on cogeneration and comments briefly on several other studies that have dealt with some as-pect of cogeneration. It then identifies the major short-comings in the scope of these studies and critically evaluates the analytical techniques.
To assist the reader, Table 1.1 summarizes the key goals, assumptions, analytical methods, and results of the studies. Special attention should be devoted to the assumptions on steam and electricity consumption growth rates and the minimum economic scale for cogeneration plants. The
absolute level of the steam consumption growth rate determines the
importance of new installations as opposed to the conversion of existing industrial sites. With the approach taken by this and previous studies, the growth rate of steam relative to electric 0eergy consumption determines the share of cogenerated electricity in overall electricity generation. The minimum economic cogeneration plant size, an intermediate conclusion within most of the studies, determines the fraction of total steam
con-sumption that could eventually be served by cogeneration.
The Dow (1975a) study, the earliest effort, explored the impacts of both increased industrial electricity generation and process steam
supply by utilities. The analysis covered the technological, environmental, financial, and legal aspects of increased cogeneration. The economic ana-lysis considered the U.S. situation through 1985 as an aggregate, without separation into industry groups or geographic regions. Industrial and utility capital investment behavior was modeled by assuming firms would require a fixed minimum, before-tax rate of return for investments in co-generation facilities. This engineering-economic calculation determined
0 0 : H -N ( 0V V I )0- o) 00_ Hn o H 02 t ZuZLZZ>4 n n
000
U " > 04 H -: 4J ·e p tCO m tO :
4
00
0
0 0 -" Lr) dP d) ) Q OD C Z -40ko U) r- En Hl 02LZ E-OE-.>-U>4 ,i H a)O LO . O ....-4 H)0 4 E 4 0--, 0 *. 4- A_ 0)4 ) 0 oAL~dP h O C C 02r-OLA OC)' 01 W o o I :: C0
0
0
4'-, 0 44J 0 0 4-) K 5 4) C: o 0 rd0O0- l 0 *- 0 a O- N 0 : W4 k V, H O ? 0 0 0 o 0 U 0 O C M 0 4 H 0 N 0 . 2 · o -o O c o 0 2 :s N 4 . - i > - e < H - 4 4 o 4 0 O4' k 4u : v1 4 4O : 4u -H oe o U E 0 0 0 E n Q O - iH N C -E- ( E- Z a Q) , -00v)i 0 04.14 -o 0 iH H 0'.>'I
I -1 44. 4) ta 0 1 X 0i 0 00 a j-10 04-) N N -40)rr C f0o
W 00E kC 14 0 a) 044 C >00
.,1 .= N > O -O.H 0 .41 , 1 ca > O0 C C -4 4-i -A 4- U) 4C) C fn oa, Nd U) N - ) O WO ., .4 43 o-I Wc 0 04>0
0 0 O4-UHo 04) hZ. 0 0 tw0 ,1 44 a) $4 00 N 0 4-4 '0 0 I 4 .I 0 4.1 0 -N Il . 0 o 0 0 c u-1 0, 1-0n 0 tp 0 4J U 0 a) 0 E' c:o .02 Ln H4a
H *N Ca rd4 OH U C L) 0 Ho 0 · 0 o H U rOH N '4 0 k0 W O NO (na) so a 00 0 0 0 -LA 0 0I LA u W 4c C-4oc
0 H 0 V 0 M o OJ 0 4h 0 O O 0 O ~ .~0
00
to O uN 9 0 O :0P t- K 0 0 0 :2~~~r 0 44a a) 4.) U) 4 0 0 0 I 0 0 o > - 4 a) 4-uN I 4 *4 ) 0 c n o o .0 o_0 L A q 0 ) . 0 0 rl C r 0 S4 C U H ~ co H DN o C 0 0 -J 0 0 0 0 4 -NH 0 c-Na 00 c 0 u4o > M C O V. O O C O H 0 4 ) 4 ) 0 H -4 )0 44 N ) W to H s o 4 O) - 7 4 1 ,p , X f- ? ! 'a
.~~~~~~t 23 02 -0 0 U) v) -. 012 C U)E:
to v0 r-G H U ) 1. 6c 0OH H0\
Ur WO 0 m H .I >1 4 -4 r) -a) rd ' 0.18 0 K K a I1 o, o 0 0 C E) ·ro 0'0) OW.0 0 0)40
o M 0 w -0 MC: 4-0VI '44 0 0 U) >H1-U) v) -4 Hi 0 4) 0w1 ' - 'a Ca 0u o, a -H o 4 14 .)4o -4 0 VI . - o4 o 4H - tWl 4-q40:2 OH 'I 0 -,-4 NO 4)0 0 -4t 1s 44 ) -N CO 0a 4 ) '0- .H04 00O~~~~~~~~~~~~~~~~~~ t: 4,4 w &4 0 8 r 8 H H-zCS O 0) V 0 4--.4(V N 0i 0 It 14 N 04 P0 0 O 4)0. at 21 N .9 9 '44U) O to 0)a
4to 4i0 0 w #-41 4 0 -v--the national levels of cogenerated steam and power. The relative capital investments by the industrial plants and by the utilities and the subse-quent steam and power generation form the basis for computation of capi-tal and fuel savings; these, in turn, are used to determine the electri-city rates for various customer classes. No explicit consideration is given to the influence of steam costs on steam consumption. They con-clude that increased industrial and utility cogeneration can result in
capital savings of $1.7 to 3.9 billion/yr and fuel savings of 535,000 to 725,000 bbl/day by 1985 with respect to the costs if historical trends continue. Although the study does not address specific policy alterna-tives, they suggest an examination of utility rate structures and fran-chise, regulations affecting industrial fuel choice and cogeneration plant
investment, tax incentives for cogeneration, and the existing legal disincentives for industrial sales of electricity to utilities.
The Federal Energy Administration commissioned the ThermoElectron (1976) study to examine policy questions associated with increased inplant generation in three industries: chemicals, petroleum refining, and pulp and paper. According to their information, these three industries account
8
for 25% of total U.S. process steam consumption. The study builds upon the Dow results; the analysis was limited to the technological and
economic side of increased inplant electricity generation through 1985 with and without the sales of the excess electricity to the local utility.
The ThermoElectron report, in contrast to the Dow study, disaggregates the analysis of the three industries by regions and size of the industrial facilities. They consider cogeneration from gas turbine plants, diesel engines, and bottoming cycles on rejected process heat, stressing retro-fit of existing facilities rather than replacement. The economic
calculations of the anticipated investment in cogeneration projects,
like the Dow study, are based on the rate of return on investment (r.o.i.). The Dow study selected a single before-tax rate threshold for industry
(20%) and for utilities (12%); ThermoElectron, however, uses a distribu-tion specifying the percentage of industries or utilities that would invest in a type of cogeneration receiving a given after-tax rate of return. This distribution is based on financial sectoral rates of return and their variance; it then subjectively shifts upward the industrial sector's distribution of companies that would be willing to invest at given rate of return because industry considers cogeneration "an ancillary investment requiring higher rates of return since it is not associated with the profitability or expansion of its primary market."9 It con-cludes that a large portion of the electric energy consumed in some regions can be generated by gas turbine or diesel-type cogeneration. The report's consideration of the utility sector, government regulation, environmental impacts and capital availability was in a "story-telling" format rather than any formal analytic discussion. The analysis of federal policy alternatives was limited: only three incentives packages were considered by their economic calculations. It estimated that the maximum economic potential for fuel savings in 1985 from increased cogeneration of process steam and electricity would result in a 415,000 to 2,260,000 bbl/day savings, depending upon the economic incentives,
technologies, and the patterns of ownership.
Resource Planning Associates (1977), henceforth RPA, has recently completed an analysis of federal policy actions toward cogeneration, con-centrating on the potential for cogeneration in six major industries
petroleum refining, pulp and paper, steel, food processing, and textile industries. The study specifically excludes consideration of utility-owned projects but includes cogeneration with process steam and with process heat from ordinary fuels or through waste heat recovery. Their analysis estimates levels of industrial cogeneration with and without government action; it specifies the effectiveness of various federal cogeneration programs according to their incremental fuel savings and governmental cost. The fuel savings are determined from industrial investments in cogeneration plants; the industrial investment behavior is predicted on the basis of the differing after-tax returns on invest-ment from alternative process steam, waste heat recovery, and cogenera-tion projects for each industry. As in the ThermoElectron study, a dis-tribution for the number of firms willing to invest in a cogeneration project at a given rate of return determines the overall level of cogeneration; RPA, however, disaggregates by manufacturing sector in addition to separating industry as a whole from the utility sector. RPA derives these distributions from interviews of executives. Again, "story telling" covered issues such as the threat of increased govern-mental economic regulation, environgovern-mental restrictions, capital
availa-bility, utility rates, and uncertainty over fuel prices and availability. The RPA report includes more industries than ThermoElectron and esti-mates the cogeneration beyond the six considered explicitly but does not disaggregate regionally. It concludes the U.S. can save between 145,000 and 420,000 bbl/day oil equivalent over historical trends by 1985 without any government intervention, "mostly oil used for utility generation." This is expected to occur through market influences alone; governmental programs studied by RPA are estimated to increase these
savings by approximately 40,000 to 150,000 bbl/day oil equivalent in
1985.
Several other studies have examined various aspects of cogenera-tion. Dow (1975b) surveys the technologies and process economics of new industrial heat sources. Von Hippel and Williams (1976) propose cogener-ation as an important component in a U.S. energy strategy designed to avoid the need for a plutonium economy. Miller et al. (1971) study the use of cogeneration plants to provide thermal energy for agricultural, industrial, commercial, and residential heat demands near an urban area. General Electric (1975) and Smiley et al. (1976) report on nuclear energy parks, which are sites where a dozen or more nuclear electricity plants and support facilities are constructed; some of these plants can cogenerate steam for co-located industrial firms. Gyftopoulos et al. (1974) calculate that cogeneration could have
pro-duced up to 53% of the electricity generation in 1968. Hafele and Sassin (1975) suggest cogenerated heat and steam as a additional appli-cation of nuclear power. Wakefield (1975) develops a series of models to determine the influence of a single district-heating cogeneration plant on the local utility and the regional energy markets.
A number of problems in the approach and analytical methods employed by the key cogeneration studies make their efforts incomplete.
* None of the studies evaluates the performance of the markets associated with cogeneration from a formal market basic condi-tions/structure/conduct/performance perspective; their anal-yses of market imperfections are limited to anecdotal evidence.
Since most of the policy proposals presume these markets are severely distorted, this assumption should be given careful
examination.
* In comparing cogeneration to other sources of steam and elec-tricity supply, the measures of economic performance being employed are inadequate for comparisons from a public
perspec-tive:
- Fuel and capital savings are not combined to form a single measure discounted to one point in time.
- All the studies calculate fuel savings in Btu's; few will argue, however, that a Btu of waste wood products is worth as much as a Btu of imported oil.
* The studies only consider effects through 1985, calculating investment behavior within this horizon by their single-period return-on-investment method. Since most central station elec-tricity development is already planned through the 1980's and new steam and electricity generation technologies will become available in the mid-1980's, the problem requires a framework that has a longer time horizon and can allow capacity installed now to be abandoned when new technologies arrive.
* Cogeneration technologies could jointly influence the prices of electricity and process steam, but the studies all assume a price for one of the outputs when calculating the incremental rates of return for new cogeneration plant investments.
* Most of the studies concentrate on cogeneration's role in elec-tricity supplies through examination focusing on the supply costs -- it could be that both steam and electicity demand conditions are also important in determining the level of cogeneration in both electricity and steam supply.
· Little exploration is made of the costs of abandoning utility-owned power plants in favor of drastically increased cogenera-tion; this could also impose special financial problems for the utilities.
* The economies of scale and joint production intertwine in the costs of cogeneration -- no study directly addresses this problem.
* The rates of return needed for the acceptance of a cogeneration project have been subjectively modified in the studies so that
they differ from the market rates of return; this buries a number of assumptions concerning uncertainties about the pro-jects and possible market imperfections.
1.3 THE FOCUS AND STRUCTURE OF THE REPORT
In order to unite the methodological improvements made in this research, the report poses two focal questions on cogeneration policy
and economics:
· Did the importance of cogeneration in electricity and steam supply decline because of market imperfections, or can this decline be explained by changes in fuel prices and technolo-gies alone?
* What is the best future role for cogeneration if the choice is based on economic efficiency?
Although the analysis here will not resolve these issues, centering the discussion on them provides a basis for evaluating the usefulness of the methods and suggests areas for further study.
Chapter 2 examines the markets associated with cogeneration from a qualitative perspective, using an industrial organization approach to
explore formally the potential for imperfect market performance. One special aspect of this analysis is the derivation of a cogeneration engineering cost function that addresses the joint production and
economics of scale issues. Chapter 3 develops a dynamic linear pro-gramming model, called JGSM, for simulating competitive behavior in
the aggregate U.S. process steam and electricity supply markets over several planning periods. Chapter 4 studies the performance of these markets for 1960-1972 using this model; the chapter principally addresses
the first fundamental question noted above. Chapter 5 uses JGSM to study the future role of cogeneration for 1975-2000. Chapter 6 summar-izes the results and, noting the flaws in these efforts, suggests direc-tions for further research. Appendix A describes a selected group of technologies for electricity and steam supply, surveying their capital costs and operating characteristics. Appendix B notes important issues and potential problems in the integration of cogeneration plants with the utility grid. Appendix C lists the cost and energy conversion fac-tors used in this study. Appendices D through F document the JGSM model and the data used for the analyses in Chapters 4 and 5.
This report, in improving upon the earlier studies, concentrates on the first four weaknesses noted in the last section: the lack of a formal analysis of market imperfections and their pre-conditions; the need for a combined measure of fuel and capital impacts throughout the horizon; the inadequacy of the single-period investment
calcula-tions that do not allow for the economic obsolescence of current capacity in future periods; and the deficient treatment of cogeneration's joint product nature.
Footnotes for Chapter
1. See Berg (1974) and Gyftopoulos et al. (1974). The concept of energy conservation through effectively utilizing fuels by matching the quality of an energy source to the quality needed is popularized in Commoner (1976) and Lovins (1976).
2. Berg (1974), for example.
3. In this report the terms cogeneration and joint generation denote the simultaneous production of steam and electricity. Common types of cogeneration plants include total energy plants, by-product power plants, and dual-purpose power plants; the usage depends upon the plant's ownership, its scale, the types of end-use demands served, and the mix of steam and electricity outputs. Total energy plants supply steam heat and electricity to commer-cial and residential buildings. In addition to producing electri-city, by-product power plants serve industrial steam demands while dual-purpose power plants supply steam for district heating and industrial processes. A site where several industrial plants have co-located with a dual-purpose plant is often called an industrial energy center.
4. The major studies are Dow (1975a), ThermoElectron (1976), and Resource Planning Associates (1977).
5. Foremost in the group are ThermoElectron (1976), Resource Planning Associates (1977), and von Hippel and Williams (1976).
6. Dow (1975a) and Dow (1975b).
7. Complete data on the historical levels of cogeneration do not exist. Information on cogeneration by utility-owned plants is available in U.S. Federal Power Commission (1973). Industrial cogeneration must be inferred from data on industrial electricity production; since economies of scale for electricity-only generation plants make it more expensive for an industrial firm to generate its own electricity unless it is geographically isolated, industrial elec-tric energy production is assumed to be essentially all cogenera-tion. The differing reports on West German cogeneration (12% in von Hippel and Williams, 1976, and 29% in Lovins, 1976) illustrate the problem with this assumption: the higher figure was based on industrial electricity generation -- a large portion of this is from industry-owned mine-mouth central station plants (personal communication with P.C. Kalischer, Rheinisch Westfalisches Elek-trizitatwerk AG, September, 1977).
7a. This assumes industrial steam consumption varies in direct propor-tion to manufacturing output and the average producpropor-tion of cogener-ated electric energy per unit of cogenercogener-ated steam has not dimin-ished over time.
8. According to earlier figures by Miller et al. (1971), they account for 79%. The Miller et al. estimates are detailed by Table 2.2
Chapter 2
ISSUES IN THE MARKET STRUCTURE AND MICROECONOMICS ASSOCIATED WITH COGENERATION
The amount of electric energy supplied by cogeneration has increased fourfold since the 1930's. Its estimated share of
total U.S. electricity supply, however, has diminished from 18% in 1941 to 4.3% in 1975. This market behavior stands in contrast to what would be anticipated given cogeneration's low operating costs
relative to typical electricity generation technologies owing to its very high fuel conversion efficiencies. Is this because its capital costs are too high? Have the industrial sites that are economic for cogeneration been exhausted? Do the first or second law thermody-namic efficiency figures give a correct reflection of the operating
costs for this joint product technology? Do artificial barriers restrict the entry of cogenerated electricity into the bulk elec-tricity market?
The decline in cogeneration relative to the total U.S. electricity supply has been attributed principally to two different sets of condi-tions. The view presented by the Dow (1975a) report blames changes in fuel prices and the advent of cheap low-pressure oil- and gas-fired package boilers for the shift away from cogeneration, which historically has required more expensive field-erected boilers. The contrasting view held by the ThermoElectron (1976) study for FEA, cites the negative attitudes of some utilities toward electricity purchases from industries.
Furthermore, the ThermoElectron report states private industry is hesi-tant to engage in cogeneration projects because of uncertainties over the application of state and federal regulations to plants selling to utilities. An additional point, not raised by the ThermoElectron study, is that the declining block rate structure for utility electri-city undervalues the cost of large block sales to industry; this makes cogenerated electricity less economic from the industrial perspective.2 If cogeneration is actually less expensive, then such biases result in artificial market restrictions and, thus, in social welfare losses.
The examination of these potential market restrictions is impor-tant within two areas of governmental policy-making. First, one continuing goal of regulatory and antitrust actions calls for the elimination of market imperfections because of the welfare losses and income transfers in the associated markets. Second, the current public focus on energy policy makes market imperfections particularly important since they may impede adjustments to higher energy prices and frustrate price-induced energy conservation measures, This results in strategically undesirable higher oil imports.
The opinions offered by the Dow, Resource Planning Associates (1977), and ThermoElectron studies have been based on professional en-gineering cost analyses, executive interviews, and legal research. No study has yet presented a formal analysis of the complex markets sur-rounding cogeneration from the perspective of industrial organization economics, This analytic paradigm, as illustrated in Figure 2.1, examines markets by analyzing their basic conditions, the market structure, the conduct of the parties involved, and the relationship
A SIMPLE MODEL OF INDUSTRIAL ORGANIZATION ANALYSIS
BASIC CONDITIONS
SUPPLY DEMAND
Raw materials Price elasticity Technology Rate of growth Product durability Substitutes Value/weight Marketing type Business attitudes Purchase method Unionization Cyclical and seasonal
character
MARKET STRUCTURE Number of sellers and buyers
Product differentiation Barriers to entry Cost Structures Vertical integration Congiomerateness CONDUCT Pricing behavior Product strategy Research and innovation
Advertising Legal tactics
PERFORMANCE
Production and allocative efficiency Progress
Full employment Equity
Figure
2.1
From Scherer (1970)of these factors to measures of market performance.3
This chapter prefaces the quantitative analysis of the steam and elec-tricky market performance in Chapters 3, 4, and 5 with a qualitative
industrial organization analysis. Because of the multiple products being considered simultaneously in this discussion, the analysis ad-heres closely to the classic Basic Conditions/Structure/Conduct/Perfor-mance framework. The first section discusses two perspectives for dis-cussing the markets under consideration. The second section looks at the basic supply and demand conditions, the market structure, and the conduct within the market. It covers, in particular, the unusual cost and production relationships for cogeneration, the economies of scale problems, industry concentration issues, barriers to market entry, and possible regulatory distortions. An engineering production function
is developed for a single, simple cogeneration process--this offers in-sights into the effects of scale economies and joint product problems upon the industrial choice between cogeneration and the separated
pro-duction alternatives, The chapter's conclusion comments on relating basic market conditions to performance in order to measure the "best possible" economic performance for these markets.
2.1 A DESCRIPTION OF THE STEAM AND ELECTRICITY MARKET PARTICIPANTS The interrelationships between industry and the local utility in the industrial steam and electricity markets can be viewed two differ-ent ways. In the first approach, the firms participating in the market are separated into two categories: the local utility, which is a regu-lated monopoly, and the private industries, Figure 2.2 illustrates
U E~ p4 E u4 H H ) H ::I CDE H ___ 0__U h U 4-i r-4 H 4) :: ---- V w r. ¢ O0 U) a) EH U~~~ V) V) O co w 4
P
u
H Eq t; H~~~~Hd
H 0 -. E-4-4 0 Wx; a) H H i- U)C) 1-4 V) U Ha)
i-H( 4 LI U) a1) ;~ 4)J C l H
20
4.4En~-q
4)4 ·-rn tni U"-.4 *r u --W -H I-q 4-jwi
lN Nll~~-- ,11 U/). LO C4 k S4 O Q Iq p O . /I 4)j U) Uv C H\,
a, C a H O * 0 Pq {: "I_ LI 111 I I i i I r I r P , I I I --U [---- II h e--el l PL4 w 1-1 -1.-I
·- · · 19·--L·lll-LIII-· · C-UIIIJthis "market participant" or institutional perspective. A cogeneration plant can be owned by an industrial firm, by the utility, or jointly by both. This approach devotes its attention to the visible
transac-tions between the two classes of firms: industrial sales of excess co-generated electricity to the utility; industrial electricity purchases from the utility; and, if the utility operates a steam-producing plant, process steam purchases by industry from the utility.
In the alternative approach, the "production process" view, the market is described on the basis of the production processes. Others
have called this the "pre-institutional" perspective.4 The schemati-zation shown in Figure 2.3 separates all steam and electricity genera-tion, including cogeneragenera-tion, from the basic industrial processes and from the utility transmission system.5 Overlaying the ownership
pat-terns for the steam and electricity generating facilities recreates the "market participant" perspective: typically, industry owns the steam and cogeneration plants while the utility owns the electricity generating plants. All varieties of the market structure can be built up from the process ownership patterns. The process perspective, hence, has the advantage of being more disaggregated than the market partici-pant view; the influences from the special characteristics of the dif-ferent production relationships can be considered separately.
In summary, the technological aspects of the processes drive much of'the industrial and utility firms' behavior with respect to cogene-ration, necessitating this disaggregation of the institutions into the processes, Table 2.1 summarizes the interrelationships for each of the two perspectives. In both cases, the two products of concern are
Electricity for Non-Industrial Customers IA 0 4.4
:
o n H *H u P w u :Y *H U) H m u ., U u M 44 $-d 0 D E--q co ) 0 H 4: Ur
U 0a, O "I .Q) r_ UI/
U U) Hi 100P 3 U .W .rq $4 -) U w w .W HV r4 .H 4-i, U :D -H .H 44 U LI U H $4 44 44 1-U 4-4 C. U a) v H-4 H H U $4 U) 4 U) cJ o aw ened _H O]Q) U ) U H _ _ _ M F4 P Principle H E-4 I-A H0
HC,)r4r i ¢ E-4 U) w0
z
H 0 v UCH O P4(n w5
:
Pk E-q p. '1 U) w0
C)w v 4 .H O CJ HO U U w J a) w 0 H 44 -J 0 r_ oc 4.jtJ E DOC. -U U) 0-Ci2k : O 4l H W U H 4 4 a) C 4 H O U] X CD CM~ 1 t4 .rl E U) w, I M C) o 0 3z v U4 Cr 'IO H /p 0 4-4 $U 44 cU\
I ---- - _ -_ -;- I --- . U-L-
-
-`--CI1'I
'
-I --. ·- ·I-Y-U--z
0
H E-I 0E-z
H r.1 U-) U Uao
-t U4 n En w W Unrc
42 U 42 3 U. 0U Oa 4U *,f 4J 0 ) a) 4 :3 r-I ~0 U Vq Q < 4i > O -4i u) (n v >% < U 0 4i"J hm 0) 4H m Q U) -4 1-4 42 U H U4J02 a)< 44 "
) :U P0G)m 0) r4 ".4 a i- r-4 F42 42 H I-m- w CD 0 0 En 0a)
o a) 0 0 U) cUo U) . r4 0) U) k C U a ) cJ a U) U) C a 4 a > -H Cl rz O C .41-4P 24 U , 42,a
-' 0 0 P U -4 C) 4 _R H C') (P lar_: Ca a) 9z 10 a) 42i ttO -'4 C) 0 U, co (12 .10 tz a) 00 0 -i 0 a) H1-Co o o [-I Cl. :z W 0 0 WC Q '-. a) "-10 Cd EH IDk
o 0 0 4J a O a)ot U a) 42 0 aJ o '-) o0
O U) a)
r
) o0 En.a O a4 b0 " n cJ 41 0 CU -H4-J oI
14 InC a) u P 0 54 CU 0 10 a)co ci0wr
10 ac -a) CZo o a) G -H P a)P
0¢
a, a a a_3
k a,a
a-1-4 CU 0 4J Ut a)I 04 o o a) 0 0 42 0 0 pisteam and electricity. In the process perspective, three different classes of supply technologies produce these products: plants produc-ing only steam; plants generatproduc-ing only electricity; and cogeneration plants supplying steam and electricity as joint products. The demands for the products generated by the steam and electricity supply tech-nologies come from three sources, A derived demand for steam results from the production of the industry's principle products. Likewise, there is a derived demand for electricity by the basic industrial pro-cesses, Finally, the utility system demands electricity; this results in the electricity distributed to both industrial and non-industrial
customers. In the market participant perspective, the ownership pat-terns bury the demands derived from the separated production processes; the market shows only the industrial electricity purchases by the util-ity and the steam and electricutil-ity purchases by the industry.
2.2 THE BASIC CONDITIONS, STRUCTURE, AND CONDUCT IN THE PROCESS STEAM AND ELECTRICITY MARKETS
This section surveys reasons why the markets described in the previous section might not achieve the performance attainable under purely competitive or even monopoly conditions.6 As the discussion progresses from basic conditions to market conduct, the focus will
al-ternate between the process and the participant descriptions of the market; the different supply, demand, and market abbreviations in Table 2.1 will be used in an attempt to keep the exposition of
rela-tionships in this complex market clear.
2.2.1 BASIC CONDITIONS
The process view provides more insight into most aspects of the basic market conditions. Before delving into the separated derived demand and supply technology sides, however, one problem must be com-mented on from a market participant perspective.
Both the Dow (1975a) and ThermoElectron (1976) studies remark upon industrial and utility manager's attitudes toward adding cogener-ation. Many perceive cogeneration as adding a product that is not in their firm's primary product line--the interviewers report statements such as "[we] are an electric utility and are not in the business of selling steam" or "we're not in the power business." These opinions, however, are not universally held. A question remains as to whether these attitudes are reflections of corporate objectives or they are individually held conclusions based upon perceptions of cogeneration's potential for influencing profits. If these business attitudes are, in fact, conclusions on profitability,they can alter rapidly with changes
in market structure or fuel and capital costs; if they are truly
a sense of corporate purpose, different means will be required to shift them,
2.2.1.1 THE DEMAND SIDE
On the demand side, important attributes of the derived demands are their concentration in a few industries and at specific sites, re-gional differences, the quality characteristics of the desired product, the price elasticity of demand, and the comparative growth rates in consumption.
Consumption by Industry
A small number of industries account for the vast majority of the aggregate SI demand. Furthermore, as shown in Table 2.2, a signi-ficant portion of the industrial electricity purchases (UES) coincides with the largest process steam users. The industrial electricity pur-chase proportions understate the magnitude of the electricity usage in the basic processes (EI) since they may also be generating electricity internally in these industries where cogeneration is especially advan-tageous.
Site Scale of Demand
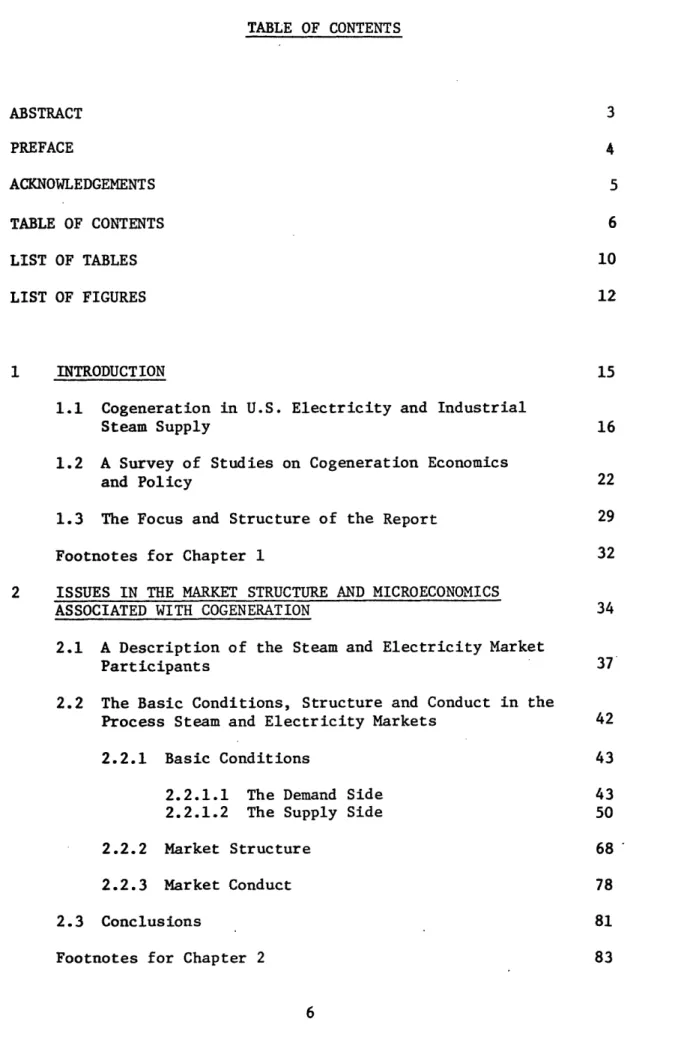
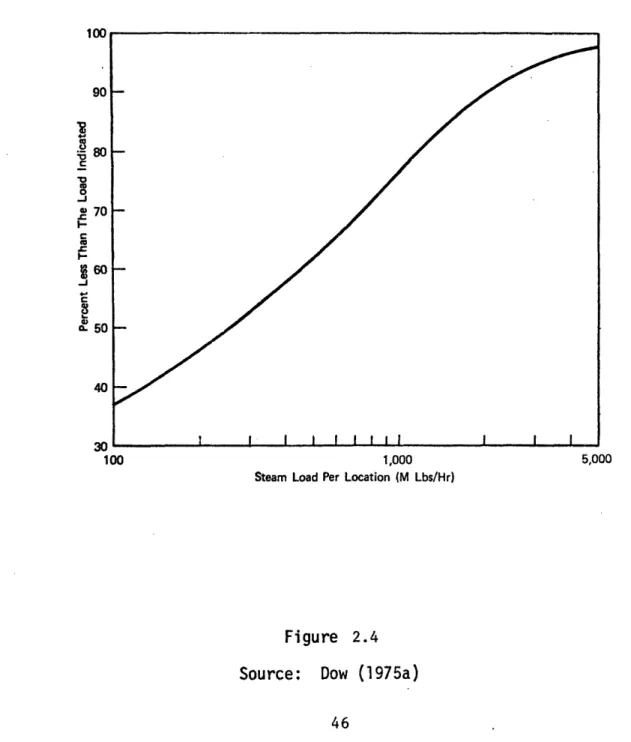
Owing to the scale economies for cogeneration plants and the high transportation costs for steam relative to other forms of energy, the extent of the derived demand for SI at individual sites is very impor-tant, Figure 2.4 illustrates the cumulative percentage of steam energy consumption at sites below a given size. The Dow (1975a) report de-velops this curve from the 1967 Census of Manufacturers water use and establishment size data, so it does not reflect instances where two or more establishments are co-located and could share the same steam gen-erating plant. Changes in the economics of cogeneration, however, can shift this curve: joint siting of several industrial plants in-"energy parks" may result in significant cost savings--with the alteration of siting patterns causing the distribution of the SI demand per location to shift toward larger scale sites.
Regional Differences
The aggregate consumption of SI, EI and EU varies considerably from region to region. Taking industrial non-electric fuel choices as an indication of industrial steam raising and cogeneration, and hence SI, Table 2.3 shows a factor of 20 difference between New England and the West South-Central region in 1972. Taking industrial electricity
un C o O O -H o Co O l (n Cc c 00 - 00 a 00 O O O C) OO O O OC -1 c \0 Cl r4 O O O uC ) o o Cn u C ,- H H ,-H , -,-H O CL C C ) n Om ~ - 0t 0 C) 0 O4 U U U'4 a) 4J 4J a -U O O .5 a) ~ ~4- U ) 0 N 0J N Cl -I 1 pa ) .- 4 -H b0D .5 *- -H a N U)v E U Wa) Ca 0 4-i U PI P O 45 C I 4. i
j
1 4 0 I I 4 rC -4 q~ 4 -4 :I a u n 1) 0 o 4-:n
--4-i 0) a)
b0
n pc0
0
0
0 Lt 00 r-4z
H 0 H H E-H0
rdz
E-4p
U) 03 H E-4 U) E-4 Ea 0r.
O tk 4-4a
-H 04J
UN. ko d m04 O r4 0ao
4.4-4
O)
t)
uO 0 U Ok__ * C H H 0) r-i .M cd EH bt 4-I U) U) I q u L 0 eJ a( U-4 4 U c44i
h
. alTHE CUMULATIVE DISTRIBUTION OF TOTAL INDUSTRIAL STEAM LOAD IN 1967
1,000
Steam Load Per Location (M Lbs/Hr)
Figure 2.4
Source: Dow (1975a)
1WUU 90 . 80 0 5O 4 70 c-C 0 50 40 __ 100 5,000 .A ~.wv
eq4 s u7 CO0 o Cc o N (o c 00 ri Cn o c) a Cr 0o rq
" C)
Ct!
L4 . .I
-4 c CY1I
0
CY
)
. 1- CY) : - a I' r- N. r c %o en r- 0 --I m (N C cz a~ 0' r- C0 r-4 0 co C -4 P = rI rq .4 $4 $4 q 4i1 4 4J 4.--c U U U .1 U U 4 U 0 a ( I I a I I C 14 , U C U - < 4 $4 4 D oo o o ¢ o o 0 -I U 'a Z Z / c e r4 r U ) 0 Ca 0) 0 CU Z I V 3 Vr W P 47 r4 4.1 a P-4 -r4 4..-Hu R :: r-4U 4. cd a) 0orlP
0
0
r-E-l 1-4 4.1 CC Cd 0V w 4 a T a) r. r-i P-Ue) -r 1-a re H
z
H E-4Z
0
z
Z
z
0
0
cc H C. r( V-40
a) u co p a U S4 .1.4 1-4 01) 4-1 4 CJ 0 $ 4 1I 4.1 U0z " P4 00
z
H- . 0) r-I 1-4 EH -.T cr--I CO, 4 0 4- o 4l. 4.cc
4 o Usi a
a U o co O u p p a Ppurchases as an indication of EU, large regional differences are simi-larly evident.
Quality of the Products
Two important quality characteristics influence the demands for industrial process steam (SI). First, as shown in Table 2.2, the vast majority of the total steam energy consumption lies in pressure ranges where it would be economically possible to cogenerate such steam.
Second, since the steam is a necessary input for the basic processes, severe losses are incurred if the supply is interrupted. Thus, the source for the steam must be reliable--this often means cogeneration installations have a back-up, oil-fired package boiler for use during any outages at the main facility, The capacity factors for boiler and cogeneration systems give a crude estimate of the reliability required: for industrial systems, the capacity factors are usually about 85%.9
Similar concerns over reliability exist for the EI and EU demands. Typically, utility electricity acts as the back-up for electricity cogenerated to supply EI but some utility rate structures make this very expensive. The reliability of single units is not as important for the EU demands because of the large number of units connected to the transmission system and the relatively small size of the cogeneration plants.
Demand Fluctuations
All the rates of SI, EI, and EU consumption vary within a fixed time period. The annual capacity factors for a single site's EI and SI consumption in most of the heavy steam consuming industries are very high--so only limited operating flexibility is needed in the supply technologies. The consumption of EU varies diurnally; for economic and stable operations, the utilities prefer centralized operating control
over the instantaneous energy from supply processes. Price Elasticities
After the foregoing discussion of the differences in S, EI, and EU demand implied by the differences n consumption between regions, indus-tries, and so forth, speculation on the price elasticity of aggregate de-mand in these markets does not appear relevant. The relative aggregate price elasticities along with the comparative growth rates in the demand unadjusted for price changes plus knowledge of the size distribution of the steam using industrial sites, however, put bounds on the maximum co-generation possible. Since institutional boundaries obscure the derived demands discussed here, the price elasticities must be loosely inferred from econometric evidence based on observed fuel sales data. No study has attempted an estimation of the price elasticity for SI; the long run industrial demand price elasticity for all energy gives a crude bound on the elasticity of process steam. Pindyck's (1977) survey shows these price elasticity estimates lie in the -.3 to -.9 range. The indus-trial demand elasticity for purchased electricity (UES) has to be used
to estimate the E elasticity; the elasticity for EI would be lower than for UES since a firm could cogenerate, substituting internal generation for purchased electricity, Joskow and Baughman (1976) estimate the long-run aggregate industrial electricity price' elasticity at -1.28 and the survey by Taylor (1975) finds estimates in the -1.25 to -1.94 range. Pindyck (1977), however, finds the total own price elasticity to be much smaller: -0.54 to -0.92. The demand elasticity for electricity genera-tion (EU) can be taken as identical to the total electricity demand elas-ticity if locational patterns and the characteristics of the transmission systems are assumed unchanged: Manne (1976), using process modeling and