Science Arts & Métiers (SAM)
is an open access repository that collects the work of Arts et Métiers Institute of
Technology researchers and makes it freely available over the web where possible.
This is an author-deposited version published in: https://sam.ensam.eu
Handle ID: .http://hdl.handle.net/10985/16818
To cite this version :
Guillaume LUCAS, Florent COLOMBET, Damien PAILLOT, Andras KEMENY - Study of latency gap corrections in a dynamic driving simulator - In: Driving Simulation Conference & Exhibition, France, 2019-09-04 - DSC 2019 EUROPE VR - 2019
Any correspondence concerning this service should be sent to the repository Administrator : [email protected]
Study of latency gap corrections in a dynamic
driving simulator
Guillaume Lucas1,2, Florent Colombet1, Damien Paillot2and Andras Kemeny1,2
(1) Renault Group, Guyancourt, France, e-mail: {guillaume.lucas, florent.colombet, andras.kemeny}@renault.com (2) Arts et M ´etiers ParisTech, LISPEN, Institut Image, Chalon-sur-Sa ˆone, e-mail: {guillaume.lucas, andras.kemeny, damien.paillot}@ensam.eu
Abstract - Simulator sickness is a well-known side effect of driving simulation which may reduce the passenger well-being and performance due to its various symptoms. The present study investigated the possible effect of the latency gap correction on simulator sickness. Indeed, dynamic simulators can have different delays in their motion and visual systems (the latency gap), which may cause motion sickness. For now twenty-four participants have done two automated driving sessions in a driving simulator, with and without the correction. Simulator sickness has been estimated thanks to the Simulator Sickness Questionnaire (SSQ).
Keywords: Driving simulation, Simulator sickness, latency
Introduction
The use of driving simulation may be limited by its well-known side effect the simulator sickness [Kol95]. This phenomenon is a specific form of motion sick-ness, which is quite similar to those that appear in virtual reality or transportation. Motion sickness is related to motion perception and this not only concerns physical motions but also visual motions [Het92]. With varying susceptibility, most people suf-fer from motion sickness in their own way, except people without organs of balance who have been shown to be insensitive to both physical and visual motion [Rea75]. Motion sickness is mostly consid-ered as a comfort issue in transports; however, in the case of driving simulation, it also affects task per-formance [Mon70] and limits the duration of the sim-ulations because of its symptoms which can range widely from pallor to vomiting [Ken93]. Although mo-tion sickness has been extensively studied over the past decades, its causes and the mechanisms in-volved are not fully understood yet and several the-ories exist [Rea78, Ric91, Tre77]. The most promi-nent, the sensory conflict and rearrangement, sug-gests that the sickness occurs when the information delivered by the visual, vestibular and somatosen-sory senses are not congruent with each other and especially with the sensory patterns which are ex-pected based on the internal models built from previ-ous experiences [Rea78].
In this paper we intend to study a cause of discrep-ancies between visual and physical motion render-ing, observing that there is a latency gap in dynamic driving simulators between the visual and the motion. Indeed motion systems have a delay depending on their mechanical power, mass, design, etc. And the visual system also, depending on the graphic cards and the projectors, etc. The difference between the two creates a latency gap which is supposed to be a cause to simulator sickness, because of the
non-coherent sensory stimulation [Het92].
Our hypothesis is, by adding a pure visual delay to compensate the mechanical delay we will increase the motion coherence and then potentially decrease the induced simulator sickness.
Methodology
Measurement of the motion delay
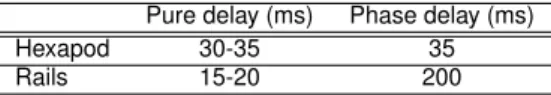
The measurement of the delay of the motion sys-tem, on the Renault Ultimate driving simulator, has already been done in a previous study [Fan11]. The apparent response lag of a computer-controlled ac-tuator system is generally composed of two terms: a pure delay and a phase delay. The pure delay cor-responds to the time taken by the computer system to transfer an input information into a command for the actuator system (computation time, data buffer-ing, numerical filters,etc.). The phase delay corre-sponds to the response time of the motion actuators system, and depends on the technology employed for the motion controllers (frequency and parameters of the control loop) and for the actuators themselves (load, power, and damping). These delays have been measured thanks to the software Spymove specially developed for that and an inertial unit. The results (resumed in table 1) were measured at 0,2 Hz and show a delay of 220 ms. 0.2 Hz is the average fre-quency of use of the simulator, this delay may vary a bit depending on the frequency of use.Table 1: Delay results for the simulator Ultimate
Pure delay (ms) Phase delay (ms)
Hexapod 30-35 35
Measurement of the visual delay
The visual delay of the Renault Ultimate has been measured thanks to a specific tool from AVSimula-tion for measuring the delays of dynamic driving sim-ulators running with SCANeR. It is composed of an oscilloscope connected to the supervisor computer (which controls the simulation with SCANeR) and to a photodiode placed near the lens of the projector. A specific version of the vehicle dynamics model and the visual module has been used to perform this test. The vehicle dynamics model periodically toggles be-tween a vehicle position corresponding to a bright area of the database and a dark area, causing a sud-den change in the projector intensity easily measur-able by the photodiode. Simultaneously the vehicle dynamics model signals the position to the oscillo-scope. The visual module frequency (display rate) were set at 60 Hz and the other modules were set at 500 Hz. The delay measured for the visual system was around 75 ms.Correction of the latency gap
As we saw in the two previous paragraphs the visual and the motion systems have different delays which create `a latency gap of 145 ms. The only way to cor-rect it and thus to creates a more synchronized sen-sory stimulation is to add a 145 ms transport delay on the signals of the visual system. The correction of the latency gap has been made thanks to a Mat-lab model. This module has been added at the end of the simulation computation and adds a transport delay on the visual signals of 145 ms.
Experimental protocol
Simulator setup
The experiment took place at Renault in the Ultimate dynamic simulator with the following main capabili-ties:
- A motion system with 8 degrees of freedom: a 6 DOF platform and two X-Y rails with 5.2 meters of usable strokes
- A full cabin equipped with force feedback systems on the steering wheel and the pedals.
- A cylindrical screen covering 210◦of horizontal
field-of-view (FOV) and attached to the cabin (radius of 1.9 m and centered on the driver)
- Sound rendering is made inside the cabin.
Scenario
The subjects had to perform two driving sessions, one with the latency correction and the other with-out. These conditions have been set in a random or-der, between subjects, to avoid rank effect and habit-uation. All the driving sessions were separated by at least 18 hours to avoid the accumulation effect on the sickness.
The simulation scenario has been developed on SCANeR Studio 1.8. Subjects were placed in a Re-nault Espace car, in autonomous mode, on the N104 highway at 110 km/h. The traffic around the au-tonomous car created some situations forcing the ve-hicle to move around and do some accelerations and
decelerations, like some work on the road, vehicle in-sertion, etc. This scenario lasted a bit more than 10 minutes and the subjects were asked to sit behind the steering wheel, to look around and pay attention to what happens on the road.
Measurement of the motion sickness
For now, twenty-four subjects have passed the exper-imentation with the two conditions. The motion sick-ness has been evaluated with the simulator sicksick-ness questionnaire (SSQ) [Ken93] before and after each session. At the end of each session they had to fill out a questionnaire reporting their feelings about the driving session, how did they see the scene moving, etc. And another one at the end to compare the two driving sessions, which one they prefer, etc.Results and Discussion
For now 24 subjects have completed the experimen-tation, we don’t have yet the results but from the com-ments of the participants, this correction seems to have a good impact. Some even felt an enhancement on some gaze disturbance they encountered without correction during the strong accelerations.
Here we have 145 ms of latency gap, which is quite big for a simulator, but almost imperceptible for a standard driver though it can create motion sickness after long session of driving. With the correction we have a global delay around 220 ms, which is hard for a standard driver to perceive, especially here in au-tonomous driving, the drivers were not active on the car comportment, so the global delay is quite trans-parent for them. Later, we want to do some tests in manual driving, also, to see if this delay isn’t too dis-turbing.
References
Z. Fang, G. Reymond and A. Kemeny,Performance Identifica-tion and CompensaIdentifica-tion of Simulator MoIdentifica-tion Cueing Delays,
Journal of Computing and Information Science in Engineering, vol. 11(4), 2011.
L. J. Hettinger and G. E. Riccio,Visually Induced Motion Sick-ness in Virtual Environments, Presence: Teleoperators and
Vir-tual Environments, vol. 1(3): 306–310, 1992.
R. S. Kennedy, N. E. Lane, K. S. Berbaum and M. G. Lilienthal,
Simulator Sickness Questionnaire: An Enhanced Method for Quantifying Simulator Sickness, The International Journal of
Aviation Psychology, vol. 3(3): 203–220, 1993.
E. Kolasinski, Simulator Sickness in Virtual Environments.,
1995.
K. E. Money,Motion sickness, Physiological Reviews, vol. 50(1):
1–39, 1970.
J. Reason and J. Brand, Motion sickness, vol. vii, Academic
Press, Oxford, England, 1975.
J. T. Reason,Motion sickness adaptation: a neural mismatch model., Journal of the Royal Society of Medicine, vol. 71(11): 819–
829, 1978.
G. E. Riccio and T. A. Stoffregen,An ecological Theory of Mo-tion Sickness and Postural Instability, Ecological Psychology,
vol. 3(3): 195–240, 1991.
F. Saidi, G. Millet and G. Gall ´ee,Transport Delay Characteriza-tion of SCANeR Driving Simulator, Driving SimulaCharacteriza-tion
Confer-ence (DSC) Europe, 2010.
M. Treisman, Motion sickness: an evolutionary hypothesis,