1 Xylogenesis in black spruce subjected to a rain exclusion in the field
1
Evelyn Belien1,*, Sergio Rossi1,2, Hubert Morin1,3, Annie Deslauriers1,4 2
1Département des Sciences Fondamentales, Université du Québec à Chicoutimi, 555 3
boulevard de l’Université, Chicoutimi (QC), G7H2B1, Canada. 4
2Sergio.Rossi@uqac.ca, 3Hubert_Morin@uqac.ca, 4
Annie_Deslauriers@uqac.ca. 5
*Corresponding author: Evelyn.Belien@uqac.ca, Département des Sciences 6
Fondamentales, Université du Québec à Chicoutimi, 555 boulevard de l’Université, 7
Chicoutimi (QC), G7H2B1, Canada. 8
2
Abstract
9
The climate models for Eastern Canada predict increases in temperature and 10
precipitation in the next 50 years, with the higher latitudes expected to experience the 11
greatest rates of warming. Despite the increase in precipitation, more extreme and 12
frequent drought periods will occur in spring and summer. An experiment was conducted 13
on black spruce [Picea mariana (Mill.) BSP] trees excluded from precipitation during June-14
September by the installation of plastic under-canopy roofs in four sites of the boreal 15
forest of Quebec. Xylem growth and physiological traits of treated and control trees were 16
monitored at short-time resolution to study the effects of summer drought on plants 17
growing in their natural environment. The rain exclusion reduced cell area and increased 18
cell wall thickness of xylem, but no change was observed in timings or amount of cell 19
production. In the southern sites, treated trees showed lower stem radius variations than 20
the control. After removal of the under-canopy roofs, trees quickly recuperated their 21
normal water status. The results demonstrated the physical effects of reduction in water 22
availability on xylem and the resistance of black spruce to one summer of drought, most 23
likely due to the ability to collect water from sources other than the superficial soil 24
horizon. 25
Keywords: Picea mariana, Xylogenesis, Drought stress, Boreal forest 26
3
Introduction
28
The climatic models for Eastern Canada predict increases in temperature and 29
precipitation in the next 50 years (Plummer et al. 2006). The increase in precipitation will 30
occur mainly in winter in the form of snowfall, while extreme conditions with drought 31
events should be experienced in summer and spring, when the main growth processes of 32
plants take place (Burke et al. 2006; Zhang et al. 2000). Because of the low temperatures 33
characterizing the boreal forest, water evaporation is generally reduced and soils often 34
remain wet throughout the growing season. As a result, boreal species are adjusted to live 35
with high or close-to-optimal moisture conditions. However, increased evapotranspiration 36
due to climate warming as well as more frequent and longer drought events are expected 37
to produce potentially severe water stresses in these high latitudes ecosystems (Easterling 38
et al. 2000). 39
It is well-known that temperature plays an important role in cambium activity and 40
wood formation in trees of cold climates (Gruber et al. 2010; Rossi et al. 2008). However, 41
the influence of moisture conditions on radial growth has also been demonstrated, with 42
positive effects of precipitations on growth observed in several boreal conifers 43
(Deslauriers et al. 2003b; Duchesne and Houle 2011; Hofgaard et al. 1999). Several 44
metabolic processes, such as photosynthesis and cell differentiation, are a function of the 45
water status of plants (Taiz and Zeiger 2006). In trees, most water is stored in the thin 46
layer of living cells comprised between bark and cambium. Therefore, changes in water 47
status are necessarily reflected in xylem and phloem, and in the resulting radial growth of 48
4 the stem (Steppe et al. 2006). During the early stages of water deficit, water potential 49
decreases up to -1.9 MPa for Japanes cedar, and the reduced hydrostatic pressure 50
precludes the accomplishment of complete cell expansion (Abe et al. 2003). With stress of 51
higher intensity, or persisting longer, water potential falls below -2 MPa for white spruce, 52
and photosynthesis and cell divisions in cambium also begin to decline (Abe et al. 2003). 53
Thus, if occurring with low intensity, summer droughts are expected to induce only slight 54
modifications to wood anatomy, in particular the production of cells with smaller 55
diameters and thicker cell walls (Arend and Fromm 2007; Gruber et al. 2010). 56
Nevertheless, field drought experiments in Finland were able to markedly reduce 57
secondary growth in mature Norway spruce, which produced tree rings with less tracheids 58
(Jyske et al. 2010). 59
As growth and water status are both physically and physiologically related, 60
understanding of the effects of drought events on wood formation require that cambial 61
activity is coupled with the physiological traits of trees. Although several previous 62
investigations have explored the effect of drought on tree growth in natural and 63
controlled environments (Eilmann et al. 2009; Rossi et al. 2009a; Swidrak et al. 2011), the 64
impacts of a prolonged summer drought on both the secondary growth and physiology of 65
trees still remain largely unexamined. Despite the latest knowledge on the cellular, 66
molecular, and developmental processes underlying wood formation, the recent literature 67
still strongly recommends more experimental studies to assess how the secondary 68
meristem copes with extreme drought events (Hartmann 2010; Jentsch et al. 2007). 69
5 The aim of this paper was to study the effect of summer droughts on xylem 70
phenology and anatomy of mature trees growing in their natural environment. 71
Manipulative experiments of rain exclusion were applied on mature black spruce [Picea 72
mariana (Mill.) BSP] trees in four sites at different altitudes and latitudes in the boreal
73
forest of Quebec, Canada. Black spruce is one of the most common boreal tree species 74
(Krause and Morin 2005) and is endemic to Northeastern America. It is a slow growing 75
species that often establishes immediately after forest fires. The root system is shallow, 76
mostly to be found in the upper 20cm of the organic soil. 77
A multidisciplinary approach including high resolution monitoring of xylogenesis, 78
tree physiology and stem radius variation was used to provide as complete information as 79
possible on the water status of the trees and thus quantify the level of stress that was 80
caused by the treatment. The lower water availability will reduce water potentials, which 81
are expected to produce physical and physiological effects in trees, identified by 82
modifications in (i) xylem cell size, (ii) activity of sources (i.e. photosynthesis), and (iii) 83
activity of sinks (cell production), according to increasing levels of stress. 84
6
Material and Methods
85
Study area and experimental design
86
The study was carried out in four permanent plots [Simoncouche (abbreviated as 87
SIM), Bernatchez (BER), Mistassibi (MIS) and Camp Daniel (DAN)] located along a 88
latitudinal and altitudinal gradient, in the boreal forest of the Saguenay-Lac-Saint-Jean 89
region, Quebec, Canada (Table 1). 90
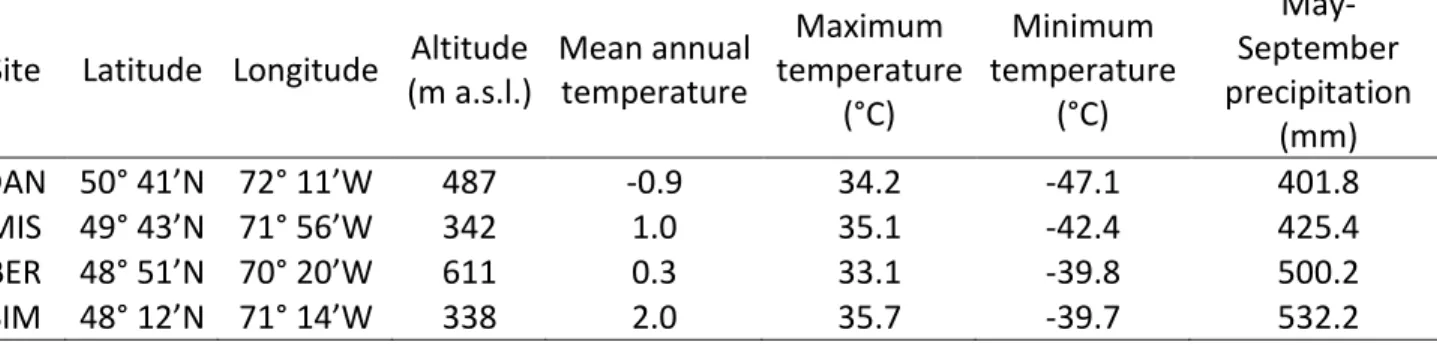
The sites consisted of mature, even-aged black spruce stands characterized by a 91
typical boreal climate, with cold winters and cool summers (Table 1). The mean annual 92
temperature in the years preceding the experiment at the four sites was between -0.9 and 93
12.0 °C. May-September rainfall ranged between 402 and 532mm and increased with 94
latitude. The soils are podzolic with different depths among sites. The organic layer in SIM 95
ranged between 10 and 20 cm, with the maximum rooting depth limited by a shallow 96
bedrock. In the other sites, the organic layer was deeper and attained 20-40 cm 97
In each site, ten dominant or codominant trees with upright stems and similar 98
growth rates were chosen, five control and five treated trees. Trees with polycormic 99
stems, partially dead crowns, reaction wood or evident damage due to parasites were 100
avoided. The selection was based on the proximity among the treated trees to allow the 101
installation of the equipment for rain exclusion on the same cluster of individuals. In 2010, 102
plastic transparent under-canopy roofs were installed during late May-early June to 103
exclude the treated trees from precipitation. The majority of the root system of black 104
7 spruce is localized at a distance of 90-200 cm from the stem collar (Polomski and Kuhn 105
1998). Accordingly, the plastic roofs extended for at least 3 m from the stem of each tree 106
and drained the rain in sinking points of the soil to avoid water flowing back towards the 107
stem collar. The plastic roofs were removed in September to ensure the survival of trees. 108
The five control trees per site were left untreated as a control. 109
The volumetric water content (VWC) of the soil was measured weekly in four 110
points at a distance of 1 m from the stem of each tree and at a depth between 12-20 cm 111
with a time domain reflectometry soil moisture meter (TDR). All VWC measurements were 112
divided by the maximum observed value to standardize results and differences in VWC 113
between the treatments were calculated as the percentage difference between treated 114
and control plots. Rainfall data was recorded every 15 minutes on all sites and stored as 115
hourly sums by means of CR10X dataloggers (Campbell Scientific Corporation). Daily sums 116
of precipitation were later calculated with the time series obtained from the 24 117
measurements per day. 118
Tree physiology
119
The physiology of the selected trees was monitored weekly throughout the 120
growing season in SIM and BER, the two sites experiencing the most extreme growth 121
conditions (Rossi et al. 2011; Turcotte et al. 2011). Short canopy branches were collected 122
at 8-10 m on the tree using a telescopic branch pruner and photosynthetic rate was 123
measured using the LI-6400XT Portable Photosynthesis System (Li-Cor Biosciences, 124
8 Lincoln, Nebraska) with the 6400-22L Lighted Conifer Chamber. Because Li-Cor uses a 125
standard leaf area, the actual leaf area of each sample was adjusted using a regression 126
based on the dry sample weight (Flower-Ellis and Olsson 1993). Mid-day (Ψmd) and pre-127
dawn (Ψpd) water potentials were measured with a pressure chamber (Model 610 128
Pressure Chamber, PMS instruments). For logistical reasons, the pre-dawn water potential 129
was simulated in the morning by wrapping the sampled branches in aluminum foil for one 130
hour before taking measurements (Bucci et al. 2004). 131
Xylem dynamics
132
Cambium phenology was studied from May to October on control and treated 133
trees at weekly time resolution. Microcores were collected from the stem following a 134
spiral trajectory between 90 and 170 cm above ground using Trephor (Rossi et al. 2006a). 135
The wood samples were embedded in paraffin, cut into sections of 7 µm with a rotary 136
microtome, fixed on slides and stained with cresyl violet acetate (0.15% in water). The 137
phenology of xylem was followed under visible and polarized light at 400-500× by 138
counting the number of cells (i) in the cambium, (ii) in radial enlargement, (iii) in cell wall 139
thickening and lignification, and (iv) the number of mature cells along three radial files 140
(Deslauriers et al. 2003a; Rossi et al. 2006b). Rows with cells with large tangential sizes 141
were selected, to ensure that only cells cut at their middle longitudinal part were 142
considered. Cambial cells were characterized by thin cell walls and small radial diameters. 143
During cell enlargement, the primary cell walls were still thin, but the radial diameter was 144
at least twice that of a cambial cell. Observation under polarized light discriminated 145
9 between the phases of enlargement and cell wall thickening. Because of the arrangement 146
of cellulose microfibrills, the developing secondary walls glisten when observed under 147
polarized light, whereas no glistening is observed in enlargement zones, where the cells 148
are still composed of just primary wall (Abe et al. 1997). The progress of cell wall 149
lignification was detected with cresyl violet acetate reacting with the lignin (Rossi et al. 150
2006b). Lignification appeared as a color change from violet to blue. A homogeneous blue 151
cell wall revealed the end of lignification and the tracheid reaching maturity (Gricar et al. 152
2005). The number of cells in each developmental stage was averaged for each tree. 153
One sample per tree, collected in October, at the end of the growing season when 154
wood formation was finished, was stained with safranin to measure cell features. A 155
camera fixed on an optical microscope was used to record numerical images at a 156
magnification of 20x. Lumen area and cell wall thickness were measured in the tree rings 157
produced in 2009, the year before the treatment, and 2010 on three radial files per 158
section using WincellTm (Deslauriers et al. 2003a) and were averaged for each tree and 159
year. The effect of the treatment on cell number and cell characteristics was tested 160
through General Linear Models (GLM) with repeated measurements using treatment and 161
site as model factors. 162
Stem radius variations
163
Ten automatic point dendrometers per site were installed on treated and control 164
trees at a height of 2 m on the stem to monitor radius variations during and after the 165
10 period of rain exclusion. Dendrometers were based on a precision linear variable 166
differential transducer (LVDT) enclosed in an aluminum housing and fixed to the tree with 167
stainless steel rods having a thermal linear expansion coefficient of 17 μm m−1 C−1. With 168
this equipment, the percentage of metal expansion was less than 1% of stem variation. A 169
sensing rod held against the surface of the bark measured the radius variations, which in 170
our monitoring represented the overall variation in size of xylem and phloem together. 171
The sensitivity of dendrometers to temperature and humidity was negligible due to the 172
use of dimensionally stable compounds in their manufacture and the dead bark was 173
partially removed to minimize error due to hygroscopic thickness variations. As the stem 174
changed in size, the core of the LVDT moved and translated the displacement in an 175
electrical signal. Measurements were taken every fifteen minutes and stored in CR-1000 176
dataloggers (Campbell Scientific Corporation) providing precise and high-resolution data 177
of radius variation during the growing season.
11
Results
179
Soil water content and tree physiology
180
In general, the two northern sites had higher VWC, and control plots showed more 181
fluctuations, mainly during the rainy periods (Fig. 1). When measurements started, 182
between DOY 173 and 179, VWC in treated plots was already slightly lower than that of 183
the control. During the period of treatment, VWC was substantially lower in the treated 184
plots, ranging from 46.8% of reduction in DAN, the northern site, to 64.4% in SIM, the 185
southern site. After removal of the under-canopy roofs, the difference in VWC was 186
maintained for one and three weeks in SIM and BER, respectively. During the last 187
measurements on DOY 285, DAN and MIS still showed a reduction of 25-39% in VWC 188
between treated and control plots (Fig. 1). 189
Lower Ψpd and Ψmd were observed in the treated trees during the whole period 190
of rain exclusion in SIM, and from DOY 174 in BER (Fig. 2). During the treatment, the 191
difference in water potential between treated and control trees was larger in SIM than in 192
BER, and was 0.16-0.17 MPa for Ψpd and 0.26-0.33 MPa for Ψmd. In both sites, the 193
difference in water potential decreased rapidly after the removal of the under-canopy 194
roofs. The photosynthetic rate of trees ranged between 1.6 and 6.2 µmol CO2m-2s-1, was 195
highly variable and showed the same fluctuations in treated and control trees throughout 196
the growing season. Higher values were regularly observed from the beginning of August 197
in treated trees in BER. In SIM, the photosynthetic rate in September diverged markedly 198
12 between treatments, but the difference disappeared with the ending of rain exclusion 199
(Fig. 2). 200
Xylem dynamics
201
The radial rows of cells had a clear pattern of variation in the number of tracheids 202
in the different developmental stages during the year, which resulted in a decreasing 203
curve of cambial cells, two delayed bell-shaped curves of radial enlarging and wall 204
thickening and lignifying cells, and a rising curve of mature cells (Fig. 3). All patterns of 205
variation are similar between treatments and among sites. However, the number of cells 206
in control trees in SIM was always markedly higher than that observed in treated trees 207
and in the other sites. Cell enlargement started before the application of the under-208
canopy roofs, except for control trees in BER, where the first enlarging cells were detected 209
one week after the treatment began. During late summer, the number of enlarging cells 210
decreased to zero between DOY 207 and 243. The earliest and latest endings of cell 211
enlargement were observed in DAN and SIM, respectively (Fig. 3). The first cells in wall 212
thickening and lignification were detected between mid-May and the end of May, at the 213
beginning of rain exclusion. Mature cells were observed from DOY 151 in SIM and DOY 214
172 in MIS and DAN. In the northern sites, the ending of xylogenesis occurred between 215
DOY 242 and 270, on average 10 days earlier than in the southern sites, where a higher 216
number of cambium cells were produced (Fig. 3). 217
Xylem characteristics
13 Fig. 4 shows the number of xylem cells and their size in control and treated trees 219
for 2009, the year before the treatment, and 2010, the year of the treatment. Cell 220
production along a radial row varied between 10 and 47, with significant differences 221
observed among sites (F=7.74, p<0.001, Table 3). No significant interaction 222
year×treatment was found (p>0.05), indicating that the number of cells produced by the 223
cambium was not affected by the treatment. This was particularly clear in SIM, where 224
both control and treated trees reduced cell production in 2010, but with the same 225
intensity (Fig. 4). Lumen area ranged from 307 µm2 in DAN to 394 µm2 in BER and cell wall 226
thickness varied from 2.3 µm to 3.9 µm. For both variables, significant differences were 227
observed between 2009 and 2010 (p<0.05 for lumen area and p<0.001 for wall thickness) 228
but variations differed between treatments, as shown by the significant interaction 229
year×treatment (p<0.05 for lumen area and p<0.01 for wall thickness, Table 2). The GLM 230
demonstrated that rain exclusion reduced cell area and increased cell wall thickness of 231
xylem, but did not affect the number of cells produced by the cambium (Fig. 4). 232
Stem radius variations
233
Stem diameter varied according to the diurnal rhythms of water storage depletion 234
and replenishment and during precipitation events (Fig. 5). Greater variations were 235
observed at the beginning of the growing season, between mid-May and the end of June. 236
After that, stem increase was markedly reduced, finally attaining a plateau from the 237
beginning of August. The highest and lowest stem radius variations were observed in BER 238
and DAN, respectively. During and after the treatment, no difference in stem radius 239
14 variation between treated and control trees was observed in DAN, the northern site. In 240
the three other sites, stem radius variations of the control were lower than those of 241
treated trees. In BER and SIM, a difference between the treatments occurred soon after 242
the installation of the experiment, indicating that stem radius of treated trees increased 243
more slowly and to lesser extent than that of the control. The pattern of treated trees was 244
similar to that of the control, as shown by the low variations in the difference between 245
treatments. In MIS, the differences between control and treated trees occurred later, at 246
the beginning of July (DOY 185). The pattern of the treated trees differed from that of the 247
control, this is clear from the higher variations in the difference. After removal of the 248
under-canopy roofs, the difference between both treatments decreased, but treated and 249
control trees only attained similar final values of stem radius variation in BER. 250
15
Discussion
252
This paper presents a manipulative experiment of rain exclusion on mature black 253
spruce growing in four sites of the boreal forest of Quebec, Canada, with the aim of 254
studying the effects of summer drought on xylem phenology and anatomy in trees 255
growing in their natural environment. Drought was expected to cause a decrease in water 256
potential, with modifications of the activity of sources and sinks within the tree. The 257
results showed significant changes in the size of the xylem cells, but no substantial change 258
was observed in photosynthesis and cell production, thus only partly confirming the 259
expectations. 260
The treatment affected the turgor pressure in the trees by reducing the water 261
potential of xylem during cell development. Cell enlargement is physically sensitive to 262
changes in hydrostatic pressure during the early stages of a water deficit (Abe et al. 2003; 263
Steppe et al. 2006). Changes in the size of cells and cell walls are a well-known 264
physiological response to drought, which plants activate to prevent cavitation and to 265
increase the anatomical strength of their tissues (Hacke et al. 2001). Thicker cell walls and 266
smaller cells result in a higher wood density, rendering tree rings less vulnerable to future 267
drought events. These stronger cells may be important to maintain a minimal 268
conductivity. However, these anatomical modifications require larger supplies of cellulose 269
and lignin for cell wall production, and, in the long run, result in lower growth rates and 270
water storage capacities (Durante et al. 2011; Hacke and Sperry 2001). Cells with reduced 271
lumen area evidently imply that a more-than-proportionally smaller area is available for 272
16 water conductance from the roots to the canopy (Anfodillo et al. 2011). Thus, trees with a 273
less efficient network of water transport could be more sensitive to subsequent drought 274
events. Also, as tree rings in conifers remain active for several years, repeated drought 275
events could significantly reduce the overall conductivity of the stem, which could affect 276
water availability for all metabolic processes of the needles. In contrast with our findings, 277
Eilmann et al. (2009) found that as the environment gets drier, trees build more effective 278
water conducting systems, with larger tracheids and thinner cell walls. However, that 279
study was conducted on Scots pine, which is a species adapted to low water availabilities 280
and soil moisture, and no extreme drought conditions were applied. 281
Cell division is a growth process occurring in the cambium, which is strictly related 282
to the source of energy, the process of photosynthesis and its products (Deslauriers et al. 283
2009; Taiz and Zeiger 2006). Bigras (2005) affirmed that different levels of stress have 284
different impacts on tree physiology. Photosynthesis of white spruce was not affected by 285
drought until a severe stress of -2.0 MPa was reached (Bigras 2005). In our experiment, 286
simulated Ψpd hardly fell below -1.5 MPa, and photosynthesis was only slightly inhibited, 287
which demonstrated that the water stress was not sufficient to cause a physiological 288
reaction of the trees. Consequently, cell production also remained unchanged. Moreover, 289
trees are most susceptible to environmental signals in the first period of cell division, 290
during cambium reactivation (Frankenstein et al. 2005). Accordingly, there is evidence 291
that the timings of the water stress are particularly important for producing a marked 292
effect on the secondary meristem. As shown in Fig. 3, cell division and even cell 293
17 enlargement had already started at the end of May, when snowmelt was just completed 294
and the sites were accessible to set up the experiment. We assume that the expected 295
increases in winter precipitation supplying abundant water during snowmelt (Easterling et 296
al. 2000), associated with an earlier cambium reactivation due to the warmer air 297
temperatures (Lupi et al. in press; Rossi et al. 2011), may still provide adequate conditions 298
for secondary growth in spring. Since the number of cambium cells is determining for the 299
total number of cells produced, the start under more favorable conditions at the 300
beginning of the growing season may compensate for the consequences of a severe 301
drought during summer. This is supported by the results, which showed that the applied 302
drought during summer had no influence on the total number of cells produced. 303
In SIM, the number of cambium and mature cells was markedly higher in control. 304
As shown in Fig 4, control trees also produced more cells than treated trees in 2009. This 305
indicated that there was an initial difference in growth between treatments before the 306
experiment, and that the lower cell production in treated trees was not due to drought. 307
Such a conclusion was confirmed by the lack in significant interaction yearxtreatment 308
found by GLM (Table 2). 309
The results clearly showed that the treated trees of southern sites (SIM and BER) 310
were less able to rehydrate at night and during rainfall events. Nevertheless, after 311
removing the plastic roofs from the stem, the treated trees, especially in BER, were able to 312
rehydrate within 23 days and finally showed no difference from the control. The trees in 313
MIS and SIM also showed a rehydration, although not complete. In DAN, there was no 314
18 difference between treated and control trees, which can be explained by the differences 315
in soil characteristics. In the northern sites, soils are deeper, with steady accumulations of 316
organic matter producing thicker organic layers (Rossi et al. 2009b), that need more time 317
to dry out or rehydrate. 318
Despite the lower variations in stem radius, there was evidence that treated trees 319
shrunk and swelled according to the circadian cycle (Downes et al. 1999). As was shown by 320
Giovannelli et al. (2007) in poplar, a higher stem shrinkage may take place during the early 321
stages of drought, when tree water potential begins to decrease. Our results showed that 322
the trees in SIM and BER were still able to rehydrate, because they follow the same 323
pattern as the control, but with lower amplitudes, being still influenced by rainfall and 324
nocturnal rehydration. This indicated that the sources of water were either still accessible 325
or not completely cut off by the under-canopy roofs. However, the treatment appeared 326
more effective and the treated trees were less able to rehydrate in MIS. These results 327
suggested that site characteristics can play an important role in the responses of trees to 328
drought. 329
Although root grafts between trees are known to have the capacity to transport 330
water and nutrients efficiently between individuals (Stone and Stone 1975), the 331
functionality of these structures in black spruce has never been demonstrated. Since the 332
under-canopy roofs were installed at a height of about 2 m, the canopy was still directly 333
exposed to rain. A hypothesis is proposed that this species has the capacity to absorb rain, 334
dew or fog water directly from needles, has already previously been shown in other 335
19 conifers (Boucher et al. 1995; Limm et al. 2009). However, even if foliar absorption could 336
maintain a sufficient water potential and stomatal conductance for accomplishing 337
photosynthesis during the treatment, it seems unlikely that the amount of water absorbed 338
by needles was able to incessantly rehydrate the stems of treated trees. Despite the well-339
known superficial root system of the genus Picea and the evident reduction in soil 340
moisture under the roofs, alternative sources of water drawn by roots in the deeper layers 341
of soil cannot be excluded and should be specifically considered in the next investigations. 342
This study presents a manipulative experiment of rain exclusion lasting from June 343
to September applied on mature black spruce in four sites of the boreal forest of Quebec, 344
Canada. The water stress produced by the treatment modified the anatomical 345
characteristics of wood but did not affect timings and amount of xylem growth. Trees 346
quickly recuperated their normal water status after the removal of the under-canopy 347
roofs. The results demonstrate the resistance of mature trees to one summer of rain 348
exclusion, most likely due to the ability to collect water from sources other than the 349
superficial soil horizon.
20
Acknowledgments
351
This work was funded by the Natural Sciences and Engineering Research Council of Canada 352
and the Consortium Ouranos. The authors thank F. Gionest, C. Soucy, S. Pednault, M. 353
Thibeault-Martel, I. Grenon, D. Laprise, M. Boulianne and J-G. Girard for their technical 354
support and A. Garside for checking the English text. 355
21
References
Abe, H., Funada, R., Ohtani, J., and Fukazawa, K. 1997. Changes in the arrangement of cellulose microfibrils associated with the cessation of cell expansion in tracheids. Trees - Structure and Function 11: 328-332.
Abe, H., Nakai, T., Utsumi, Y., and Kagawa, A. 2003. Temporal water deficit and wood formation in Cryptomeria japonica. Tree Physiology 23: 859-863.
Anfodillo, T., Deslauriers, A., Menardi, R., Tedoldi, L., Petit, G., and Rossi, S. 2011. Widening of xylem conduits in a conifer tree depends on the longer time of cell expansion downwards along the stem. Journal of Experimental Botany doi: 10.1093/jxb/err309.
Arend, M., and Fromm, J. 2007. Seasonal change in the drought response of wood cell development in poplar. Tree Physiology 27: 985-992.
Bigras, F. 2005. Photosynthetic response of white spruce families to drought stress. New Forests 29: 135-148.
Boucher, J.F., Munson, A.D., and Bernier, P.Y. 1995. Foliar absorption of dew influences shoot water potential and root growth in Pinus strobus seedlings. Tree Physiology 15: 819-823.
Bucci, S.J., Scholz, F.G., Goldstein, G., Meinzer, F.C., Hinojosa, J.A., Hoffmann, W.A., and Franco, A.C. 2004. Processes preventing nocturnal equilibration between leaf and soil water potential in tropical savanna woody species. Tree Physiology 24: 1119-1127.
Burke, E.J., Brown, S.J., and Christidis, N. 2006. Modeling the recent evolution of global drought and projections for the twenty-first century with the hadley centre climate model. Journal of Hydrometeorology 7: 1113-1125.
22 Deslauriers, A., Giovannelli, A., Rossi, S., Castro, G., Fragnelli, G., and Traversi, L. 2009. Intra-annual cambial activity and carbon availability in stem of poplar. Tree Physiology 29: 1223-1235.
Deslauriers, A., Morin, H., and Begin, Y. 2003a. Cellular phenology of annual ring formation of Abies balsamea in the Quebec boreal forest (Canada). Canadian Journal of Forest Research 33: 190-200.
Deslauriers, A., Morin, H., Urbinati, C., and Carrer, M. 2003b. Daily weather response of balsam fir (Abies balsamea (L.) Mill.) stem radius increment from dendrometer analysis in the boreal forests of Quebec (Canada). Trees - Structure and Function 17: 477-484.
Downes, G., Beadle, C., and Worledge, D. 1999. Daily stem growth patterns in irrigated Eucalyptus globulus and E. nitens in relation to climate. Trees - Structure and Function 14: 102-111.
Duchesne, L., and Houle, D. 2011. Modelling day-to-day stem diameter variation and annual growth of balsam fir (Abies balsamea (L.) Mill.) from daily climate. Forest Ecology and Management 262: 863-872.
Durante, M., Maseda, P.H., and Fernandez, R.J. 2011. Xylem efficiency vs. safety: Acclimation to drought of seedling root anatomy for six Patagonian shrub species. Journal of Arid Environments 75: 397-402.
Easterling, D.R., Meehl, G.A., Parmesan, C., Changnon, S.A., Karl, T.R., and Mearns, L.O. 2000. Climate extremes: Observations, modeling, and impacts. Science 289: 2068-2074.
Eilmann, B., Zweifel, R., Buchmann, N., Fonti, P., and Rigling, A. 2009. Drought-induced adaptation of the xylem in Scots pine and pubescent oak. Tree Physiology 29: 1011-1020.
23 Flower-Ellis, J.G.K., and Olsson, L. 1993. Estimation of volume, total and projected area of Scots pine needles from their regression on length. Studia Forestalia Suecica 190: 1-19.
Frankenstein, C., Eckstein, D., and Schmitt, U. 2005. The onset of cambium activity - a matter of agreement? Dendrochronologia 23: 57-62.
Giovannelli, A., Deslauriers, A., Fragnelli, G., Scaletti, L., Castro, G., Rossi, S., and Crivellaro, A. 2007. Evaluation of drought response of two poplar clones (Populus x canadensis monch 'i-214' and P. deltoides marsh. 'dvina') Through high resolution analysis of stem growth. Journal of Experimental Botany 58: 2673-2683.
Gricar, J., Cufar, K., Oven, P., and Schmitt, U. 2005. Differentiation of terminal latewood tracheids in silver fir during autumn. Annals of Botany 95: 959-965.
Gruber, A., Strobl, S., Veit, B., and Oberhuber, W. 2010. Impact of drought on the temporal dynamics of wood formation in Pinus sylvestris. Tree Physiology 30: 490-501.
Hacke, U.G., and Sperry, J.S. 2001. Functional and ecological xylem anatomy. Perspectives in Plant Ecology, Evolution and Systematics 4: 97-115.
Hacke, U.G., Sperry, J.S., Pockman, W.T., Davis, S.D., and McCulloch, K.A. 2001. Trends in wood density and structure are linked to prevention of xylem implosion by negative pressure. Oecologia 126: 457-461.
Hartmann, H. 2010. Will a 385 million year-struggle for light become a struggle for water and for carbon? - How trees may cope with more frequent climate change-type drought events. Global Change Biology 17: 642-655.
Hofgaard, A., Tardif, J., and Bergeron, Y. 1999. Dendroclimatic response of Picea mariana and Pinus banksiana along a latitudinal gradient in the eastern Canadian boreal forest. Canadian Journal of Forest Research-Revue Canadienne De Recherche Forestiere 29: 1333-1346.
24 Jentsch, A., Kreyling, J., and Beierkuhnlein, C. 2007. A new generation of climate-change experiments: events, not trends. Front. Ecol. Environ. 5: 365-374.
Jyske, T., Holtta, T., Makinen, H., Nojd, P., Lumme, I., and Spiecker, H. 2010. The effect of artificially induced drought on radial increment and wood properties of Norway spruce. Tree Physiology 30: 103-115.
Krause, C., and Morin, H. 2005. Adventive-root development in mature black spruce and balsam fir in the boreal forests of Quebec,Canada. Canadian Journal of Forest Research-Revue Canadienne De Recherche Forestiere 35: 2642-2654.
Limm, E.B., Simonin, K.A., Bothman, A.G., and Dawson, T.E. 2009. Foliar water uptake: a common water acquisition strategy for plants of the redwood forest. Oecologia 161: 449-459.
Lupi, C., Morin, H., Deslauriers, A., and Rossi, S. in press. Xylogenesis in black spruce: does soil temperature matter? Tree Physiology.
Plummer, D.A., Caya, D., Frigon, A., Cote, H., Giguere, M., Paquin, D., Biner, S., Harvey, R., and De Elia, R. 2006. Climate and climate change over North America as simulated by the Canadian RCM. Journal of Climate 19: 3112-3132.
Polomski, J., and Kuhn, A.J. 1998. Wurzelsysteme. Birmensdorf: Eidgenössische Forschungsanstalt für Wald, Schnee und Landschaft.
Rossi, S., Anfodillo, T., and Menardi, R. 2006a. Trephor: A new tool for sampling microcores from tree stems. Iawa Journal 27: 89-97.
Rossi, S., Deslauriers, A., and Anfodillo, T. 2006b. Assessment of cambial activity and xylogenesis by microsampling tree species: an example at the alpine timberline. IAWA Journal 27: 383-394.
25 Rossi, S., Deslauriers, A., Gricar, J., Seo, J.W., Rathgeber, C.B.K., Anfodillo, T., Morin, H., Levanic, T., Oven, P., and Jalkanen, R. 2008. Critical temperatures for xylogenesis in conifers of cold climates. Global Ecology and Biogeography 17: 696-707.
Rossi, S., Morin, H., Deslauriers, A., and Plourde, P.-Y. 2011. Predicting xylem phenology in black spruce under climate warming. Global Change Biology 17: 614-625.
Rossi, S., Simard, S., Rathgeber, C.B.K., Deslauriers, A., and De Zan, C. 2009a. Effects of a 20-day-long dry period on cambial and apical meristem growth in Abies balsamea seedlings. Trees-Structure and Function 23: 85-93.
Rossi, S., Tremblay, M.J., Morin, H., and Levasseur, V. 2009b. Stand structure and dynamics of Picea mariana on the northern border of the natural closed boreal forest in Quebec, Canada. Canadian Journal of Forest Research-Revue Canadienne De Recherche Forestiere 39: 2307-2318.
Steppe, K., De Pauw, D.J.W., Lemeur, R., and Vanrolleghem, P.A. 2006. A mathematical model linking tree sap flow dynamics to daily stem diameter fluctuations and radial stem growth. Tree Physiology 26: 257-273.
Stone, J.E., and Stone, E.L. 1975. Communal root system of red pine - Water conduction through root grafts. Forest Science 21: 255-261.
Swidrak, I., Gruber, A., Kofler, W., and Oberhuber, W. 2011. Effects of environmental conditions on onset of xylem growth in Pinus sylvestris under drought. Tree Physiology 31: 483-493.
Taiz, L., and Zeiger, E. 2006. Plant Physiology. 4 ed. Sinauer Associates, Sunderland, MA. Turcotte, A., Rossi, S., Deslauriers, A., Krause, C., and Morin, H. 2011. Dynamics of depletion and replenishment of water storage in stem and roots of black spruce measured by dendrometers. Frontiers in Plant Science 2: 1-8.
26 Zhang, Q.B., Hebda, R.J., Zhang, Q.J., and Alfaro, R.I. 2000. Modeling tree-ring growth responses to climatic variables using artificial neural networks. Forest Science 46: 229-239.
27
Tables
Table 1: Location and climatic characteristics of the four study sites, listed in decreasing latitude. Altitude is reported in m above sea level (a.s.l.).
Site Latitude Longitude Altitude (m a.s.l.) Mean annual temperature Maximum temperature (°C) Minimum temperature (°C) May-September precipitation (mm) DAN 50° 41’N 72° 11’W 487 -0.9 34.2 -47.1 401.8 MIS 49° 43’N 71° 56’W 342 1.0 35.1 -42.4 425.4 BER 48° 51’N 70° 20’W 611 0.3 33.1 -39.8 500.2 SIM 48° 12’N 71° 14’W 338 2.0 35.7 -39.7 532.2
28
Table 2: F-Value resulting from GLM with repeated measurements using treatment and site as model factors, for cell number, cell area and cell wall thickness. One and two asterisks indicate differences at p<0.05 and p<0.01, respectively.
Cell number Lumen area Cell wall thickness
Year 3.03 6.38* 7.87** Treatment 0.60 1.64 4.32* Site 7.74** 1.74 1.82 YearxTreatment 0.18 4.95* 8.39** YearxSite 12.85** 0.89 1.68 YearxTreatmentxSite 0.84 0.34 0.73
29
Figure captions
Figure 1: Volumetric water content of the soil (VWC) in the treated (white dots) and control (black dots) plots during (grey background) and after the rain exclusion treatment. Vertical bars represent the standard deviation.
Figure 2: Ψmd, Ψpd and photosynthetic rate of treated (white dots) and control (black dots) trees during (grey background) and after the rain exclusion treatment. Vertical bars represent the standard deviation.
Figure 3: Radial number of cells, enlarging, wall thickening and mature cells in developing xylem of treated (white dots) and control trees (black dots) before, during (grey background) and after the rain exclusion treatment. Vertical bars represent the standard deviation.
Figure 4: Number of cells, cell area and cell wall thickness in the treated (white dots) and control (black dots) trees in 2009 (the year before treatment) and 2010 (the year of treatment, grey background). Vertical bars represent the standard deviation.
Figure 5: Mean daily stem radius variations (mm) in control (black line) and treated trees (grey line) before, during and after the rain exclusion treatment (grey window). The thicker black line shows the difference between treated and control trees.
30 DAN 0 20 40 60 80 MIS VW C ( %) 0 20 40 60 80 0 10 20 30 40 50 -300 30 60 BER 0 20 40 60 80 160 180 200 220 240 260 280 -300 30 60
Day of the year
Prec ipitat ion (mm ) 0 10 20 30 40 50 R educ tion (%) -300 30 60 0 10 20 30 40 50 -300 30 60 SIM 0 20 40 60 80 Control Treated 0 10 20 30 40 50 R educ tion (%) R educ tion (%) R educ tion (%) VW C ( %) VW C ( %) VW C ( %) Figure 1
31
Day of the year
160 180 200 220 240 260 280 Treated Control Phot os y nt het ic r at e (µm ol CO 2 m -2 s -1 ) 160 180 200 220 240 260 280 1 2 3 4 5 6 7
BER
SIM
md (M Pa) -2.0 -1.5 -1.0 -0.5 0.0 pd ( M Pa) -2.0 -1.5 -1.0 -0.5 0.0 Figure 232 Figure 3 C el l w al l thi ck nes s (µm) 2009 2010 2009 2010 2009 2010 2009 2010 20 40 60 2009 2010 2009 2010 2009 2010 2009 2010 2 3 4 300 400 500 2009 2010 2009 2010 2009 2010 2009 2010 MIS N um ber of c el ls Control Treated Lum en ar ea (µm 2 ) DAN SIM 2009 2010 2009 2010 2009 2010 2009 2010 BER Year Figure 4 C am bi um BER Enl ar g ing Control Treated DAN W al l thi c k eni ng M at ur e 0 2 4 6 8 10 12 14 16 0 2 4 6 8 10 150 200 250 300 0 10 20 30 40 50 60 150 200 250 300 MIS
Day of the year
150 200 250 300 150 200 250 300 SIM 0 2 4 6 8 10 12 14
33
M
IS
Day of the year -0.2 0.0 0.2 0.4 0.6 0.8 BER -0.2 0.0 0.2 0.4 0.6 0.8 Control Treated St em r adius v ar iation (m m ) SI M 140 160 180 200 220 240 260 280 -0.2 0.0 0.2 0.4 0.6 0.8 D AN -0.2 0.0 0.2 0.4 0.6 0.8 Figure 5