Adaptation to simulator sickness in older drivers
following multiple sessions in a driving simulator
Mid- and low-range driving simulators raise grow-ing interest among safety agencies worldwide. They are well suited for large-scale deployment
and allow presentation of a wide range of driv-ing contexts in a safe environment1. In several countries, general driving training and assessment protocols already integrate the simulator environ-ment in their method2,3 and it has been argued that in certain circumstances, they provide more sensitive measures of driving efficiency than road tests4-8. Because training and retraining of older drivers is a topic of growing interest, it appears important to document more effectively how old-er drivold-ers respond to simulators before simulator solutions can be implemented at a greater scale. Currently, there are suggestions that, when ex-posed to a simulator environment, there is a large proportion of individuals experiencing a set of undesirable physiological reactions (head-aches, nausea, paleness, etc.) known as simula-tor sickness9. There are suggestions that older
drivers are more sensitive than younger individu-als leading to higher attrition rate in older driv-ers10,11. Furthermore, simulator sickness symp-toms could have adverse consequences on train-ing as it could alter the traintrain-ing by distracttrain-ing the learner from the primary task or even encourage the learner to adopt/learn incorrect behaviors to avoid symptoms12,13. For instance, a participant may choose to reduce normal head movements when driving in a simulator because head move-ments accentuate sickness symptoms14.
One hypothesis to explain motion and simula-tor sickness is that it arises from a sensory con-flict15. The absence of expected sensory signals or the presence of contradictory sensory signals originating from different modalities would lead to sickness symptoms. For instance, while de-celerating a vehicle, visual, vestibular and kines-thetic information specific to a deceleration are expected. In the particular case of braking into a fixed-based simulator, visual information informs
Isabelle Mackrous PhD
aMartin Lavallière PhD
aNormand Teasdale PhD
aaDépartement de kinésiologie, Faculté de médecine, Université Laval, Québec, Canada; E: [email protected]
I. Mackrous, M. Lavallière, N. Teasdale, Adaptation to simulator sickness in older drivers following multiple sessions in a driving simulator. Gerontechnology 2014;12(2):101-111;
doi:10.4017/gt.2013.12.2.004.00 There is a large proportion of individuals experiencing
simula-tor sickness symptoms (headaches, nausea, paleness, etc.). Previous studies have reported that driving in a simulator, compared to on-road driving, can alter braking responses while stopping at intersections. Here we evaluated whether altered braking responses observed in fixed-base simulators could be linked to the presence of sickness symptoms in older drivers. Older individuals participated in a 5-session training study that included a pre-test, three training sessions and a post-test. We evaluated adaptation to simulator sickness through repeated exposure (5 simulator sessions). Furthermore, we assessed whether head postural instability accounted for the presence of sickness symptoms. Sickness symptoms were measured with the Simulator Sickness Questionnaire (SSQ) and a Visual Analog Scale (VAS). After the first session, half of the participants reported mild symptoms (MS, VAS score>5), and another half reported light symptoms (LS, VAS score<5). We compared sickness symptoms, braking responses and postural stability between the two groups for the first (pre-test) and last (post-test) driving sessions. During the pre-test, participants of the MS group braked earlier, showed longer time of deceleration, a greater number of pedal activations and showed increased irregularities in their deceleration profile. Partici-pants from the MS group adapted in that, sickness symptoms reduced through exposure. During the post-test, we observed a larger decrease in variability for the MS than the LS group, but we did not find any difference regarding the braking responses per se or the head postural stability. We interpreted these results as evidence that adaptation is accom-panied with a reduction of variability. Finally, we propose that a more gradual exposure to simulated environment might be required before evaluating the driving performance of individuals prone to simulator sickness.
the driver that he is decelerating while the ves-tibular system does not perceive any deceleration or motion. This discrepancy between visual and vestibular signals (and certainly kinesthetic sig-nals as well) could contribute to create the type of conflict underlying simulator sickness. The role of visuo-vestibular conflict in provoking simulator sickness was also supported by studies demon-strating that patients with bilateral labyrinthine defects resist to simulator sickness15-17. According to this theory, symptoms may persist until a new coupling between actions and the expected sen-sory consequences is established. For instance, Reason and Brand15 suggested this could explain why navy sailors adapted to a destroyer get sea-sick again, and must readapt again, to the differ-ent motions of an aircraft carrier or ocean liner. In another theory proposed by Riccio and Stof-fregen18, the postural instability theory of motion sickness, suggests that nausea-inducing situa-tions are characterized by novel demands on the postural control for which the participant does not possess effective strategies, which leads to in-stability. For example, individuals might get sea-sick because maintaining upright stance when standing on a wobbly ship necessitates different control strategies when compare to standing on stationary surfaces. Stoffregen et al.19,20 noted that postural instability can also predict visually induced motion sickness. When exposed to a visual stimulus (e.g., a small sinusoidal motion of walls in a room), participants that expressed motion sickness exhibited an increased postural motion prior the onset of sickness symptoms. Postural instability may serve as reliable predic-tors of motion and simulator sickness and sug-gests that the symptoms may persist until new patterns of motor actions are established. Compared to on-road driving, driving in a fixed-base simulator alters some driving behaviors21-23. Of particular interest to the present paper, there are studies reporting difficulties in controlling the deceleration of the vehicle in a fixed-base simulator22,24-28. This was evidenced by the ob-servation that drivers generally start braking ear-lier in a fixed-based simulator than in real-world driving. Moreover, the speed-time profiles in the simulator were characterized by clear cor-rections in the slope of the speed curves which resulted from participants pressing the brake, releasing the brake and letting the ‘car’ going at constant speed and pressing the brake again before coming to a full stop. For instance, Boer et al.25 showed that participants exhibited con-stant deceleration rates when making braking-to-stop maneuvers in a real vehicle whereas they showed multi modal braking profiles in a driving simulator. This also was exemplified in Siegler et
al.28, who showed that drivers exhibited higher jerk (second derivative of the deceleration pro-file representing changes in deceleration) at the onset of the deceleration and higher maximal deceleration rate when driving in a fixed-based rather than in a motion-based simulator. Fur-thermore, at the end of the deceleration, drivers ended farther from the target when driving in the fixed-based simulator. Although these effects ap-parently were observed regardless of simulator sickness symptoms, it remains to be determined whether altered driving behavior observed in fixed-base simulators could be linked to the pres-ence of sickness symptoms in older drivers. Recently, we had older drivers who participated in a 5-session learning study in a fixed base simu-lator29. After every session, participants complet-ed the Simulator Sickness Questionnaire (SSQ)30 and a Visual Analog Scale (VAS) to evaluate if they felt any simulator sickness symptom. Over-all, 16 participants completed the entire protocol (5 simulator sessions over a 2-week period). For these participants, we noted a dichotomy in the severity of the symptoms after the first simulation session with half of the participants reporting hardly any symptoms and the other half report-ing mild symptoms.
The first goal of the present paper was to con-duct a complementary analysis to determine if participants who were more sensitive to the simulator sickness exhibited different postural (documented from head movements) and brak-ing responses than those showbrak-ing less sensitivity. Second, we wanted to determine whether adap-tation (reduced symptoms and action responses changes) would take place for the participants who reported more pronounced simulator sick-ness symptoms. To this end, participants were assigned to one of two groups according to the severity of their symptoms after the first simula-tor session. The present study examined if the magnitude of postural (head movements) and the irregularities of braking responses could be linked with the presence of more severe symp-toms observed for the first session and if this was the case to determine the effect of repeated ex-posure on the sickness symptoms, the head pos-tural responses and the braking responses.
M
ethodParticipants
Twenty two participants (age range 65-84 years old) participated on a voluntary basis in a learn-ing study. All participants were active and healthy drivers. Upon their arrival in the laboratory, each participant was briefed on the requirements of the experiment and all read and signed an in-formed consent declaration conin-formed to the
In-stitutional Review Board. Clinical tests (MMSE)31, Snellen visual acuity, Melbourne Edge test, an-kle proprioception acuity32, lower limb touch thresholds measured with a Semmes-Weinstein pressure aesthesiomether33 served to screen for impairments that might affect driving and cogni-tion. All drivers scored 27 or higher on the MMSE and had normal or corrected-to-normal vision. They also completed the Motion History
Ques-tionnaire (MHQ)34 and none reported previous history of motion sickness. Answers to the MHQ before the first session revealed that only one participant reported previous exposure to a driv-ing simulator (one session, two years previous to the actual study). Before and after each experi-mental run, subjects completed a 10cm visual analog scale (VAS) about their nausea symptoms (0=no symptom, 10=mild nausea) and the simu-lator sickness questionnaire (SSQ: 16 symptoms rated on a 4-point scale: 0=absent, 1=slight, 2=moderate, 3=severe). Participants who, after the first experimental run, felt no or light symp-toms of simulator sickness (VAS score<5) were included in a light symptoms group (LS) and par-ticipants who felt more pronounced symptoms of simulator sickness (VAS score>5) were included in a mild symptoms group (MS). No medication to prevent motion sickness was taken by partici-pants prior to the simulator sessions, and none of the participants reported long lasting simulator sickness symptoms after the initial session. Out of those 22, two participants elected to stop their participation after the first practice period with the simulator. One participant completed the first session only and data for three others partici-pants were not complete because of overheating problems in the laboratory. Data for the remain-ing sixteen individuals are reported herein.
Simulator
The simulator consisted of a fixed-based open-cab powered by STISIM Drive 2.0 (System Tech-nology Inc., Hawthorne, California, USA).
Imag-es were projected on a flat wall (1.45 m highx2.0 m wide) located 2.2 m from the steering wheel using a liquid crystal display projector (Hitachi CP-X275). The projector displayed a 40° hori-zontal by 30° vertical field-of-view. The center of the screen was located at the eye-level through the midline of the subject. Refresh rate varied be-tween 25-30Hz depending upon the density of the visual information displayed. During testing, ventilation was provided by a ceiling vent posi-tioned just above the driver and, for the current study the average temperature within the room was 19.5˚C (SD=0.6).
Head movements (medio-lateral and antero-pos-terior displacements) were recorded using a mag-netic tracker [Flock of Birds, Ascension Technol-ogy Corporation, Burlington, Vermont, USA] fixed on a head band at a frequency of 60Hz.
Procedures
Participants were exposed to five simulator ses-sions presented on separate days within a 14-day period (a pre-test, a post-test and three training sessions). On average, the time interval between each simulator session was 2.4 days (SD=1.7). Before the first session, participants were made aware the simulator could make them feel un-comfortable (nausea, dizziness, general dis-comfort, and headache). They were instructed specifically to inform the experimenter if this happened and were told to stop the simulation session before they felt discomfort or illness that could lead to emetic responses. As mentioned above, two participants elected to withdraw from the study. Before each session, participants were first asked if they were in their usual state of fitness (that is, not suffering from a cold or flu, hangover, etc.). Then, they completed the SSQ and the 10cm VAS about their nausea symptoms. Then, they were exposed to a 6km practice run (with less graphical information than the experi-mental scenario) serving the purpose of familiar-izing subjects with the simulator. They filled a VAS score immediately after this practice before a 5min rest was provided. The ex-perimental run fol-lowed. For the first (pre-test) and last sessions (post-test), a continuous 26km scenario of urban and rural roads with minor grade changes was pre-sented. To comply Table 1. General driving experience and performance on screening test for drivers in the light
symptom group (LS) and the mild symptom group (MS); Data were submitted to a one-way ANOVA to compare the two groups; Confidence limit set at 0.05
Parameters LS Mean±SD MS p Demographics Age 70.9±5.6 71.1±4.2 0.458 Gender (Female/Male) 2/6 2/6 Years of experience 46.8±4.3 50.9±7.3 0.190 km/week 250±107 225±116 0.826 Performance
Mini Mental State Examination 28.25±0.71 28.25±0.89 0.566 Snellen visual acuity High contrast 1.03±0.29 1.05±0.33 0.724 Melbourne Edge 21.0±1.6 21.0±1.3 0.614 Motor-Free Visual Perception Standard score 114.8 ±23.7 105.9±20.9 0.747 Time, s 3.6±1.4 4.0±1.7 0.618
with the 40º field of view limitation of our simu-lator, there was no right or left-turn maneuver at intersections. Moderate curves only were pre-sented (smallest radius of 120m). The scenario in-cluded a normal driving environment (two-way and four-way roads, intersections with stop sign or crossing light) and specific recorded instruc-tions to overtake slower moving vehicles. Lane width and markings were according to govern-mental rules and speed limits and advisory signs appeared throughout the scenario. Subjects were asked to comply with local traffic laws throughout the course of the experiment. The scenario did not require any emergency brak-ing response unless a drivbrak-ing error was made by the driver. Five intersections, for which drivers had to immobilize the vehicle, were included within the scenario (intersection 1 to 5). There was no car preceding the participant’s vehicle at these intersections. The breaking responses at these intersections were used to test our hypoth-eses. Session 2 to 4 were training sessions with specific feedback on the driving performance. These training sessions varied in length from subject to subject but were shorter than the pre-test and the post-pre-test sessions (on average, 16km vs. 26km, respectively). After each experimental run, subjects completed again the VAS and the SSQ. Hence, VAS scores were taken before the practice run, after the practice run and after the experimental run; VAS scores taken after the ex-perimental run served to evaluate simulator sick-ness symptoms. SSQ scores were taken before the practice run and after the experimental run. Data analysis: Postural and braking responses Head postural responses and braking responses for five intersections that required participants to bring the vehicle to a complete stop were ana-lyzed. The head postural stability was calculated during a period of 40 seconds preceding each intersection. The range of motion was calculated as the area comprise within an ellipse that re-grouped 95% of the head planar displacement (medio-lateral and antero-posterior head dis-placement; x and y, respectively). Displacement variability was calculated and was defined as the standard deviation of the resultant head planar displacement (RHD).
RHD= √(x2 + y2) [1]
To document the braking responses, four vari-ables were measured. When approaching an in-tersection, participants have to estimate the time they will arrive at the stop line in order to decide when to apply the brake. The time to reach the intersection evaluates this behavior, and it is cal-culated as the time between the moment partici-pants first touched the brake pedal and the
arriv-al at the stop line if participants had maintained a constant speed. Time of deceleration is the time from the first contact with the brake pedal to im-mobilization of the vehicle. Smoothness of the deceleration can be characterized by the num-ber of changes in the jerk-time profiles (second derivative of the velocity) and by the number of gas and brake pedals activation, with a smaller number of pedals activation generally indicating a smoother deceleration profile. Specifically, for each intersection, we computed the number of peaks with values exceeding 3km/h3 in the jerk time-profile and the number of time that the gas and brake pedals were activated when deceler-ating. Finally, the absolute difference between the position of the vehicle (when the velocity first reached 0 km/h) and the position of the stop line was calculated (absolute spatial error). With-in-participant variability (SD) also was computed on those variables.
Statistical analyses
For each group, VAS and SSQ scores were initial-ly submitted to separate statistical anainitial-lyses be-cause participants were assigned to the LS or MS group based on their VAS score at the end of the first session (LS group, VAS<5; MS group, VAS>5). For each group, SSQ scores were submitted to a Session(five sessions)xPeriod (baseline, end of the session) analysis of variance (ANOVA) with repeated measures on both factors. Similarly, data for the VAS were submitted to a Session(five sessions)xPeriod (baseline, post-familiarization, end of the session) ANOVA with repeated meas-ures on both factors. Because session 2 to 4 were training sessions, driving data for session 1 (pre-test) and 5 (post-test) only were analyzed. This was made necessary because driving was regularly interrupted to provide feedback about the driving performance during the training ses-sions. Postural variables (head movements) were submitted to ANOVAs contrasting Group(LS and MS)xSession (pre-test and post-test)xIntersection (intersection 1 to 5) with repeated measures on the last factor. For the braking responses, when data were normally distributed, they were sub-mitted to ANOVAs contrasting Group (LS and MS)xSession (ptest and post-test) with re-peated measures on the last factor. Alternatively, when the data did not show normal distribution (e.g., number of time the gas and the brake ped-als were activated), non-parametric statistic were performed (i.e., Mann-Withney U test and Wil-coxon Match-Pairs Signed rank, W test). SPSS version 13.0 was used to run statistical analyses.
R
esultsAdaptation to simulator sickness
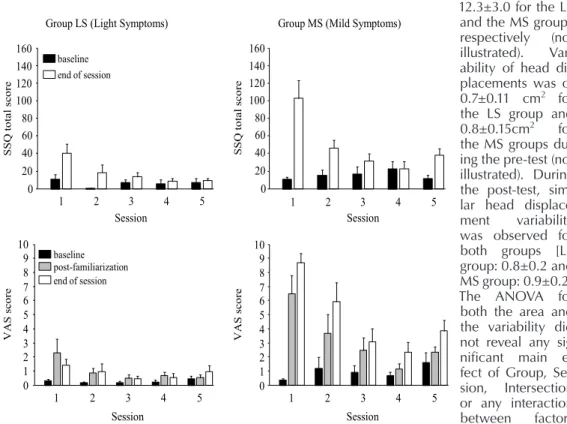
Overall, it shows that scores for the SSQ and the VAS were higher for the MS than for the
LS group (Figure 1). First, for the LS group, the ANOVA for the SSQ score showed main effects of Session:(F(4,24)=9.70, p<0.001), Period:(F(1,6)=6.91, p<0.05) and a significant interaction:(F(4,24)=4.89, p<0.01). For the VAS, none of the effects were significant (p>0.05). Overall, this confirms that the LS group experi-enced light symptoms across all sessions. Never-theless, for the first two sessions, the SSQ scores were higher at the end of the sessions than at the beginning. Also, the score at the end of the session decreased gradually from pre-test to post-test (on average, 40.5, 18.2, 13.5, 8.4, and 9.3 for the pre-test, Training session 2 to 4 and post-test, respectively). For the MS group, the ANOVA for the SSQ scores showed significant main effects of Session:(F(4,24)=7.88, p<0.001), Period:(F(1,6)=16.44, p<0.01) and a significant interaction of Session by Period:(F(4,24)=9.63, p<0.001). For the VAS, a main effect of Session:(F(4,8)=6.31, p<0.05) and a significant interaction of Session by Period:(F(8,16)=4.89, p<0.01) also were observed. Scores at baseline were not different across all sessions (p>0.05). Through repeated exposure to the simulator, the
MS group showed a gradual decrease of their symptoms at the end of the session, (on average for the SSQ score, 100.7, 48.1, 31.5, 16.0, and 37.4 for the pre-test, Training session 2 to 4 and
post-test, respectively). The significant increase of the SSQ score between Session 4 and post-test (p<0.05) is likely associated to the longer du-ration of the simulator exposure for the post-test (on average, participants drove a little more than 26km for session 5 vs. 16km only for session 4). A Group by Period comparison of the SSQ score for the post-test only showed the scores before exposure were not different between groups (on average, 7.5 and 9.3 for the LS and MS groups, respectively; p>0.05). On the other hand, at the end of the session, the MS group showed a higher SSQ score than the LS group (38.3 vs. 11.7, respectively; p<0.01). A similar analysis for the VAS showed that the scores were higher for the MS than the LS group for all three measure-ments (baseline, after familiarization, and end of session) and that both groups showed a small in-crease between the baseline and the end of the session scores (for both groups, an increase of 1.1 in the VAS from the baseline to the end of the session; p<0.05).
Head postural stability
During the pre-test, the mean area comprise within an ellipse regrouping 95% of the head dis-placements was of 6.8±1.6cm2 and 12.7±4.9cm2 for the LS and the MS groups, respectively. Dur-ing the post-test, mean area was of 12.5±4.9 and 12.3±3.0 for the LS and the MS groups, respectively (not illustrated). Vari-ability of head dis-placements was of 0.7±0.11 cm2 for the LS group and 0.8±0.15cm2 for the MS groups dur-ing the pre-test (not illustrated). During the post-test, simi-lar head displace-ment variability was observed for both groups [LS group: 0.8±0.2 and MS group: 0.9±0.2]. The ANOVA for
both the area and the variability did not reveal any sig-nificant main ef-fect of Group, Ses-sion, Intersection or any interaction between factors (p>0.05). 0 20 40 60 80 100 120 140 160
light
0 20 40 60 80 100 120 140 160mild
0 1 2 3 4 5 6 7 8 9 10light
0 1 2 3 4 5 6 7 8 9 10mild
0 20 40 60 80 100 120 140 160 0 20 40 60 80 100 120 140 160 0 1 2 3 4 5 6 7 8 9 10 0 1 2 3 4 5 6 7 8 9 10 1 2 3 4 5 1 2 3 4 5 1 2 3 4 5 1 2 3 4 5 Session Session Session Session V A S sc ore V A S sco re SS Q to tal sc ore SS Q to tal sc oreGroup LS (Light Symptoms) Group MS (Mild Symptoms)
baseline end of session
baseline end of session post-familiarization
Figure 1. SSQ (Simulator Sickness Questionnaire) and VAS (Visual Analog Scale) scores for both groups, LS (Light symptoms group) and MS (Mild symptoms group) and for all 5 sessions; Error bars represent the between-subject standard error
Braking at intersections
Time to reach the intersection
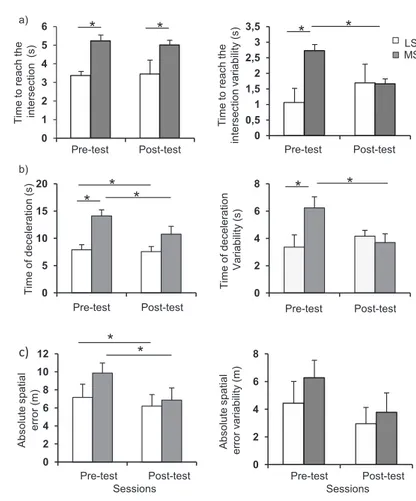
The mean time to reach the intersection was sig-nificantly longer for the MS than the LS group, re-gardless of the session (Figure 2a, left panel). On average, the participants in the MS group started braking 2 seconds earlier than the participants in the LS group. The ANOVA yielded a main effect of Group (F(1,14)=5.6, p=0.01). The main effect of Session and the interaction of Group by Ses-sion were not significant (p>0.05).
The MS group also exhibited larger variability than the LS group during the pre-test whereas no significant difference was observed between groups during the post-test (Figure 2a, right pan-el). This is supported by a significant interaction of GroupxSession: F(1,14)=1.4, p<0.05). Neither the main effects of Group or Session showed a significant difference (p>0.05).
Time of deceleration
Participants in the MS group had longer time of deceleration than those from the LS group for both the pre-test and the post-test (Figure 2b, left panel). Note that the time of deceleration de-creased between pre-test and post-test for both the MS and the LS groups. These observations are supported by main effects of Group:F(1,14)=1.4, p<0.05 and Session:F(1,14)=6.3, p<0.05. The in-teraction of GroupxSession did not reach signifi-cant level (p>0.05).
The MS group also showed greater time of de-celeration variability than the LS group dur-ing the pre-test. (Figure 1b, right panel). This difference vanished during the post-test. The ANOVA showed a significant interaction of GroupxSession:F(1,14)=5.0, p<0.05). The main effects of Group and Session were not significant (p>0.05).
Spatial error
A significant reduction of the absolute spatial er-ror between the pre-test (8.5m) and the post-test (6.5m) was noted (Figure 2c). This is supported by a significant main effect of Session:F(1,14)=6.9, p=0.02. Greater errors were observed at the pre-test for the MS group, but this effect did not reach a significance level as both the main effect of Group and the interaction were not significant (p>0.05). The ANOVA for the vari-ability on the spatial error showed no significant ef-fect (p>0.05 for all efef-fects). Number of peaks in the jerk-time curves
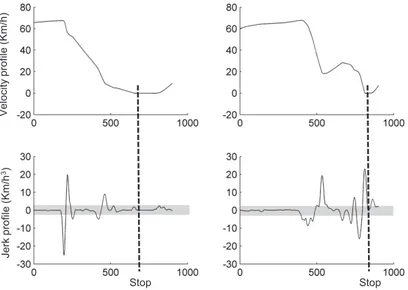
When approaching an intersection, a smoother decrease of the speed implies a smaller number of peaks in the jerk-time curves. To quantify the smoothness of the brak-ing dynamics, the mean number of peaks in the jerk-time curves and the variability in the number of peaks were analyzed (Figure 3). 0 1 2 3 4 5 6 Ti m e to re ac h th e in te rs ec tio n (s ) Pre-test Post-test 0 0,5 1 1,5 2 2,5 3 3,5 Pre-test Post-test Ti m e t o re ac h t he in te rs ec tio n v ari ab ility (s ) LS MS a)
*
*
*
*
0 5 10 15 20 0 2 4 6 8 Ti m e of dec el er at ion ( s) Pre-test Post-test Ti m e of dec el er at ion Va ria bi lity (s ) Pre-test Post-test b)*
*
*
*
*
0 2 4 6 8 10 12 0 2 4 6 8 Abs ol ut e s pat ial erro r (m ) Pre-test Post-testSessions Pre-test Sessions Post-test
Abs ol ut e s pat ial erro r v ari ab ility (m ) c)
*
*
Figure 2. Means (right column) and variability (left column) for (a) time to reach the intersection (upper line), (b) time of deceleration (middle line), and (c) ab-solute spatial error for both groups and for both pre-test and post-test sessions (lower line); Error bars represent the between-subject standard error; LS=Light symptoms group; MS=Mild symptoms group
Participants in the MS group showed a greater number of peaks than the LS group both for the pre-test and the post-test sessions (Fig-ure 4a). The ANOVA yielded a main effect of Group:F(1,14)=6.0, p<0.05). The main effect of Session and the interaction of GroupxSession were not significant, p>0.05.
As to the variability in the number of peaks, the MS group showed a greater variability at the pre-test than at the post-pre-test whereas the LS group showed a similar variability for both sessions (Fig-ure 4b). The ANOVA showed a significant main effect of Session:F(1,14)=5.4, p<0.05, as well as an interaction of GroupxSession:F(1,14)=9.3,
p<0.05. The main effect of Group was not significant (p>0.05).
Gas and brake during decel-eration
Repeated and alternated ac-tivation of the gas and brake pedals increases the irregu-larities in the deceleration profile. To evaluate if the number of gas and brake pedals activation differed between the MS and the LS group during the pre-test, a rank test was performed on the total number of activa-tions of the gas and brake pedals. A Mann-Whitney test indicated that the me-dian value for the MS group (5.3) was greater than that for the LS group (4.0) and the two groups differed signifi-cantly (Mann-Withney U=56, p<0.05). A Wilcoxon W test for paired sample showed the MS group did not reduce the total number of pedal activations through repeated exposure (pre-test vs. post-test; W(8)=(19), p>0.05, one-tailed test).
d
iscussionDifferences between MS and LS
In the present paper we evaluated whether older participants reporting more pronounced simula-tor sickness symptoms exhibited differences in their postural stability and braking responses than participants with light or no symptoms. Pre-viously, Stoffregen et al.20 have demonstrated that postural instability, measured as head and torso displacements when standing, preceded the appearance of motion sick-ness symptoms and increased with prolonged exposure to nauseogenic stimuli35. In the present paper, compared with the LS group, mean head range of motion and variability of the participants who expressed mild simulator symptoms showed only a weak trend toward in-creased instability. Large be-tween-subject variability ex-plained the lack of significance between groups and sessions. It is noteworthy that torso move-ments were restrained (if not eliminated) by the back support of the car seat, possibly enhanc-ing head postural stability while
Stop Stop Ve lo ci ty p ro fil e (Km /h ) Je rk p ro fil e (Km /h 3)
Figure 3. (a) Velocity profile as a function of time, and (b) its corresponding jerk time profile; The left column presents a smooth approach to the intersec-tion whereas the right column depicts a jerkier approach to the intersecintersec-tion; Shadow represents the ±3km/h3 criteria used to calculate the number of peaks in the jerk time profile; Five peaks can be observed for the individual from the LS group and 10 peaks are observed for the individual from the MS group
0 2 4 6 8 10 12 14 1 2 0 1 2 3 4 5 6 N um ber of peak s
Pre-test Post-test Pre-test Post-test
N um ber of peak s var iabi lit y a) b) LS MS Sessions Sessions
*
*
*
*
Figure 4. (a) Means number of peaks in the jerk-time curves, and (b) vari-ability in the number of peaks in the jerk-time curves for both groups, LS (Light symptoms group) and MS (Mild symptoms group), and for both pre-test and post-test sessions; Error bars represent the between-subject standard error
driving. As well, the driving conditions were programmed to attenuate as much as possible nauseogenic conditions (for instance, by avoid-ing sharp curves and hilly terrain). Furthermore, it is likely that the nauseogenic situations were self-generated by the drivers rather than resulting from the driving condition per se (for instance, through repeated activation/deactivation of the gas and brake pedals when braking at intersec-tions). On the contrary, in Stoffregen et al. task, participants were either standing or sitting on a stool without back support and the visual stim-uli aimed at increasing the nauseogenic condi-tions. This may explain the lack of difference in head movements between the two groups in the present study. We also ran an additional analysis (not presented in the Results section) to examine if the head movements for the entire simulation would show greater displacements for the MS group. This analysis also yielded an absence of difference between the MS and the LS group. Perhaps, asking participants to get out of the simulator and stand on a force platform at regular intervals during the simulation could al-low highlighting postural instability for individu-als reporting greater sickness symptoms. This would certainly deserve some thoughts if such a procedure could permit to identify individuals susceptible to report symptoms as the duration of the exposure to the simulation increases. At this point, however, our analyses of head dis-placements do not support the suggestion that individuals expressing greater symptoms also exhibit greater postural instability (as measured from head displacements).
Significant differences between groups emerged for the braking responses. We observed that during the pre-test, participants within the MS group started braking earlier, had longer time of deceleration and were more variable than the LS group. Because the time to reach the intersec-tion is a measure of temporal predicintersec-tion based on the visual information available, this suggests that participants who felt more pronounced symptoms had more difficulties to process the visual information presented during the simula-tion to estimate the time to reach the stop line. It has been proposed that one factor influencing temporal estimation in visually simulated envi-ronments is the perception of distance36,37. Poor-er accuracy at the stop line was noted for the MS group, but the difference with the LS group did not reach significance. The greater number of adjustments observed during the braking re-sponses from the MS group (i.e., more peaks in the jerk-time profile and more activation of the gas and brake pedals during the deceleration) also suggests difficulties in estimating the dis-tance and the time of arrival at the stop line.
Recent motor control models propose that visual information can be used continuously to amend the arm trajectory with minimal jerk and time cost. Based on prediction mechanisms, the ad-justments are smoothly imbedded in the trajec-tory allowing overcoming the neural delay in processing visual information. However, when predictions are less accurate, the close-loop con-trol must be relied on and is weighted strongly38. Inherent to the close-loop control, is that the feedback from the response (i.e., visual flow from the braking in the current study) is processed fol-lowing long sensory delay. When the desired state is not reach (e.g., proper deceleration rate needed to stop precisely at the intersection), a novel response is implemented. Any additional adjustment to reach a desire state requires ad-ditional pedal activations and increases the jerk. This suggest the MS group might have had more difficulties making accurate predictions, suggest-ing that participants in the MS group relied more heavily on close-loop control than participants in the LS group. The participants in the MS group also exhibited more variability in estimating the time to reach the intersection – interpreted as poor predictive efficiency - which also supports this interpretation. In accordance, larger inci-dence of simulator sickness found in older par-ticipants might be related with decline in motor prediction ability that is observed with aging39.
Adaptation processes
Through repeated exposure to the simulator (5 sessions), the VAS and the SSQ total score de-creased gradually from pre-test to post-test for the MS group, but remained slightly higher than scores observed for the LS group for the post-test. The decrease in VAS and SSQ scores can be interpreted as evidence of an adaptation (i.e., alleviating the simulator sickness symptoms). Unexpectedly, however, we found little support suggesting this adaptation was associated to any change in postural stability and braking smooth-ness. For the four variables analyzed (time to reach the intersection, time of deceleration, spa-tial error and number of peaks in the jerk-time curves and number of gas and brake pedals activation), the MS group did not show larger improvement than the LS group (none of the interactions of GroupxSession were significant). Strikingly, however, a larger decrease in variabil-ity was observed for the MS group for 3 out of 4 variables (time to reach the intersection, time of deceleration, and number of peaks in the jerk-time curves). Because the variability was calcu-lated on five intersections, the larger variability observed for the MS group might result from outlier data. However, none of the participants showed outlier data (that is, a value above 1.2 standard deviation from the mean), regardless of
the variable. Rather, it seems that the larger vari-ability for the MS group originated from partici-pants producing more variable responses across intersections. In the same vein, reduction of vari-ability with exposure likely resulted from partici-pants producing more consistent responses on the different variables.
If we assume that a sensory conflict is at the basis of the simulator sickness observed when driving in a fixed-based simulator, adaptation to simulator sickness might not exclusively involve the acquisition of new braking responses or new driving behaviors. When the central nerv-ous system faces conflicting sensory informa-tion, sensory adaptation sometimes consists of selectively suppressing reafference (i.e., sensory feedback)40-42. For instance, the deactivation of the parieto-insular vestibular cortex (i.e., cortical area responsible for vestibular perception) was observed in presence of visuo-vestibular conflict (i.e., circular vection41). Conversely, a significant deactivation of the visual cortex was found dur-ing vestibular stimulation43. Known as the recip-rocal inhibitory visual-vestibular interaction, this mechanism might protect visual perception of self-motion from potential vestibular mismatch-es caused by a simulated environment. As well, this mechanism could allow the perception of self-motion to shift from one sensory modality to the other. Although visual information is not perfectly suited for deceleration control, inhibi-tory visual-vestibular interaction might permit to weight more importantly the visual information when driving in a simulator and, thus, alleviat-ing the mismatch between expected and actual sensory information. This transitory state might allow attenuating the symptoms.
Prevention of simulator sickness
In order to reduce simulator sickness symptoms, the simulation sessions were design according to previous recommendations44, such as, the simu-lator room was maintained at a relatively cold temperature (19.5ºC) and the presentation of the visual information was refreshed at a rate be-tween 25 to 30 Hz. In addition, before each ses-sion, participants were asked if they were in their usual state of fitness (that is, not suffering from a cold or flu, hangover, etc.). Although several strat-egies were used to reduced simulator sickness incidence, the long exposure to simulated envi-ronment used to evaluate multiple driving behav-iors increases the chance of severe discomfort45. Therefore, new protocols should be developed to reduce simulator sickness symptoms and to identify participants who will be more prone to be simulator sick. In the present study, we were not able to discriminate between the LS and MS group by looking at the head movement
charac-teristics when subjects were seated and driving in the simulator but observed that participants who felt more severe symptom exhibited a different pattern of deceleration. Future protocols should implement a short familiarization session that includes braking behavior, in order to identify participants who are more prone to feel simula-tor sickness symptoms when experiencing longer exposure. Because our results clearly show that repeated exposures reduce simulator sickness symptoms, as has been reported earlier45. A step-by-step training should be implemented for those participants who are more susceptible to feel pro-nounced discomfort to longer experimental runs. This will allow some adaptation and a decrease of the symptoms before longer experimental runs are presented. Such procedures, although they require several visits from the participants, might offer a new opportunity to prevent/reduce with-drawal of participants in driving simulator experi-ments, which is known as one of the major fac-tors limiting the widespread use of simulator. To some extent, this adaptation process could be to driving simulator what is known as getting one’s sea legs when boating46,47.
A popular view that is generally accepted is that the virtual environment should coincide with the reality to reduce motion, simulator or cyber sick-ness44. Recently, however, it has been proposed that inducing incongruence between the virtual and the real world environment yield less severe visually induced sickness symptoms48. For in-stance, sickness symptoms were less pronounced when the external field of view (visual angle be-tween the observer and the screen) did not coin-cide with the internal field of view (graphic field of view of the real scene)48,49. Furthermore, in Bos et al. experiments48,49, a more natural per-ception of walking speed of 5 km/h was reach when the simulated walking speed was set at 13.6 km/h. This suggests that introducing a gain between the speed at which the visual informa-tion is presented in the simulainforma-tion and the reality might contribute to reduce sickness symptoms when driving in a simulator. For instance, when pressing the brake pedal, the visual deceleration could occur faster than in the real world. Howev-er, it is not known whether inducing a difference between the virtual environment and the reality during practice in a simulator would impairs the transfer of driving behavior to on-road driving. Obviously, more research is needed to explore different strategies to reduce simulator sickness and their impact on the on-road driving transfer.
c
onclusionIn the present paper we found evidences that participants who were more sensitive to simu-lator sickness showed distinct behaviors while
braking at intersections. Through exposures, symptoms associated with simulator sickness were reduced and this was accompanied with a reduction of variability in braking related vari-ables. However, we found limited evidence of
braking response adaptation and changes in postural stability. More gradual exposure to simulated environment might be required before evaluating the driving performance of individu-als prone to simulator sickness.
Acknowledgement
Special thanks to all drivers who participated in the project. This project (COBVIS-D) received support from AUTO21 and the Société de l’Assurance Auto-mobile du Québec (SAAQ). ML was supported by a graduate fellowship from the Fonds de recherche du Québec - Santé (FRQS).
References
1. Fisher DL, Rizzo M, Caird JK, Lee JD. Handbook of Driving Simulation for Engineering, Medicine, and Psychology. 1st editon. Boca Raton: CRC Press; 2011; 751 pp
2. Anibas J. A study of virtual simulation in a truck driver training program. Menomonie: University of Wisconsin-Stout; 2008
3. Zomeren AH van, Brouwer WH, Rothengatter JA, Snoek JW. Fitness to drive a car after recovery from severe head injury. Archives of Physical Medicine and Rehabilitation 1988;69(2):90-96 4. Logsdon RG, Teri L, Larson EB. Driving
and Alzheimer’s disease. Journal of Gen-eral Internal Medicine 1992;7(6):583-588; doi:10.1007%2FBF02599195
5. Rizzo A, Jounghyun Kim G. A SWOT analy-sis of the field of virtual reality rehabilitation and therapy. Presence 2005;14(2):119-146; doi:10.1162%2F1054746053967094
6. Rizzo M, McGehee DV, Dawson JD, Anderson SN. Simulated car crashes at intersections in driv-ers with Alzheimer disease. Alzheimer Disease and Associated Disorders 2001;15(1):10-20; doi:10. 1097%2F00002093-200101000-00002
7. Schultheis MT, Rebimbas J, Mourant R, Mil-lis SR. Examining the usability of a virtual reality driving simulator. Assistive Technology 2007;19(1):1-8; quiz 9-10; doi:10.1080% 2F10400435.2007.10131860
8. Singh H, Barbour BM, Cox DJ. Driving rehabilita-tion as delivered by driving simularehabilita-tion. Chapter 32 in: Fisher DL, Rizzo M, Caird JK, Lee JD, editors. Handbook of Driving Simulation for Engineer-ing, Medicine, and Psychology. Boca Raton: CRC Press; 2011; pp 1-12
9. Johnson DM. Introduction to and review of simulator sickness research. U.S. Army Research Institute for the Behavioral and Social Sciences Report No.: 1832; 2005 (April)
10. Cassavaugh ND, Domeyer JE, Bakcs RW. Lessons learned regarding simulator sickness in older adult drivers. LNCS 2011;6767:263-269; doi:10.1007% 2F978-3-642-21666-4_29
11. Caird JK, Edwards CJ, Creaser JI, Horrey WJ. Older driver failures of attention at intersections: using change blindness methods to assess turn decision accuracy. Human Factors 2005;47(2):235-249; doi:10.1518%2F0018720054679542
12. Kennedy RS, Fowlkes JE. Simulator sickness is polygenic and polysymptomatic: implications for research. International Journal of Aviation Psychol-ogy 1992;2(1):23-28; doi:10.1207%2Fs15327108ij ap0201_2
13. Stoner HA, Fisher DL, Mollenhauer MJ. Simulator and scenario factors influencing simulator sick-ness. Chapter 14 in: Fisher DL, Rizzo M, Caird JK, Lee JD, editors. Handbook of Driving Simulation for Engineering, Medicine, and Psychology. Boca Raton: CRC Press; 2011; pp 1-24
14. Lackner JR, Graybiel A. Elicitation of motion sickness by head movements in the micro-gravity phase of parabolic flight maneuvers. Aviation, Space, and Environmental Medicine 1984;55(6):513-520
15. Reason JT, Brand JJ. Motion sickness. London; Academic Press; 1975; 310 pp
16. Kennedy RS, Graybiel A, McDonough RC, Beck-with FD. Symptomatology under storm condi-tions in the North Atlantic in control subjects and in persons with bilateral labyrinthine defects. NSAM-928. Research Report, United States Naval School of Aviation Medicine. 1965 (May) pp 1-10; doi:10.3109%2F00016486809126317
17. Cheung BS, Howard IP, Money KE. Visually-induced sickness in normal and bilaterally labyrinthine-defective subjects. Aviation Space and Environmental Medicine 1991;62(6):527-531 18. Riccio GE, Stoffregen TA. Gravitoinertial force
versus the direction of balance in the perception and control of orientation. Psychological Review 1990;97(1):135-137; doi:10.1037%2F%2F0033-295X.97.1.135
19. Smart LJ, Stoffregen TA, Bardy BG. Visually induced motion sickness predicted by postural instability. Human Factors 2002;44(3):451-465; doi:10.1518%2F0018720024497745
20. Stoffregen TA, Smart LJ. Postural instability pre-cedes motion sickness. Brain Research Bulletin 1998;47(5):437-448
21. Blaauw GJ. Driving experience and task demands in simulator and instrumented car: a validation study. Soesterberg: Institute for Perception TNO; 1980
22. Kaptein NA, Theeuwes J, Horst R van der. Driving simulator validity: some considerations. Trans-portation Research Record 1996;1550:30-36; doi:10.3141%2F1550-05
23. Reed MP, Green PA. Comparison of driv-ing performance on-road and in a low-cost simulator using a concurrent telephone dial-ling task. Ergonomics 1999;42(8):1015-1037; doi:10.1080%2F001401399185117
24. Boer ER, Kuge N, Yamamura T, editors. Affording realistic stopping behavior: A cardinal challenge for driving simulators. 1st Human-Centered
Trans-portation Simulation Conference; Iowa City, IA; 2001
25. Boer ER, Yamamura T, Kuge N, Girshick A, edi-tors. Experiencing the same road twice: A driver centered comparison between simulation and re-ality. Driving Simulation Conference; Paris, 2000 26. Malaterre G, Frechaux J. Simulation de la conduite
automobile : méthodologie d’évaluation des performances et de la validité d’un simulateur. INRETS 1999
27. Pinto M, Cavallo V, Ohlmann T, Espié S, Rogé J, editors. The perception of longitudinal accelera-tions: What factors influence braking manoeuvers in driving simulators. Driving Simulation Confer-ence; Paris, 2004
28. Siegler I, Reymond G, Kemeny A, Berthoz A, edi-tors. Sensorimotor integration in a driving simula-tor: contributions of motion cueing in elementary driving tasks. Driving Simulation Conference; Sophia Antipolis; 2001
29. Lavallière M, Simoneau M, Laurendeau D, Teasdale N. Active training and driving-specific feedback improve older drivers’ visual search prior to lane changes. BMC Geriatrics 2012;12(5); doi:10.1186/1471-2318-12-5
30. Kennedy RS, Lane NE, Berbaum KS, Lilienthal MG. Simulator Sickness Questionnaire: an en-hanced method for quantifying simulator sickness. The International Journal of Aviation Psychology 1993;3(3):203-220; doi:10.1207%2Fs15327108ij ap0303_3
31. Folstein MF, Folstein SE, McHugh PR. Mini-mental state. A practical method for grading the cognitive state of patients for the clinician. Journal of Psychi-atric Research 1975;12(3):189-198
32. Goble DJ. Proprioceptive acuity assessment via joint position matching: from basic science to gen-eral practice. Physical Therapy 2010;90(8):1176-1184; doi:10.2522%2Fptj.20090399
33. Dellon ES, Mourey R, Dellon AL. Human pres-sure perception values for constant and moving one- and two-point discrimination. Plastic and Reconstructive Surgery 1992;90(1):112-127; doi:10. 1097%2F00006534-199207000-00017
34. Kennedy RS, Fowlkes JE, Berbaum KS, Lilienthal MG. Use of a motion sickness history ques-tionnaire for prediction of simulator sickness. Aviation Space and Environmental Medicine 1992;63(7):588-593
35. Bonnet CT, Faugloire E, Riley MA, Bardy BG, Stoffregen TA. Motion sickness preceded by unstable displacements of the center of pressure. Human Movement Science 2006;25(6):800-820; doi:10.1016%2Fj.humov.2006.03.001
36. Kemeny A, Panerai F. Evaluating perception in driving simulation experiments. Trends in Cogni-tive Sciences 2003;7(1):31-37; doi:10.1016%2 FS1364-6613%2802%2900011-6
37. Panerai F, Droulez J, Kelada J-M, Kemeny A, Balli-gand E, Favre B, editors. Speed and safety distance
control in truck driving: comparison of simulation and real-world environment. Driving Simulation Conference; Sophia Antipolis; 2001
38. Wolpert DM, Ghahramani Z, Jordan MI. An internal model for sensorimotor integra-tion. Science 1995;269(5232):1880-1882; doi:10.1126%2Fscience.7569931
39. Skoura X, Personnier P, Vinter A, Pozzo T, Papaxanthis C. Decline in motor prediction in elderly subjects: right versus left arm differences in mentally simulated motor actions. Cortex 2008;44(9):1271-1278; doi:10.1016%2Fj.cor-tex.2007.07.008
40. Bernier PM, Burle B, Vidal F, Hasbroucq T, Blouin J. Direct evidence for cortical suppression of somatosensory afferents during visuomotor ad-aptation. Cerebral Cortex 2009;;19(9):2106-2113; doi:10.1093%2Fcercor%2Fbhn233
41. Brandt T, Bartenstein P, Janek A, Dieterich M. Reciprocal inhibitory visual-vestibular interaction. Visual motion stimulation deactivates the parieto-insular vestibular cortex. Brain 1998;121(9):1749-1758; doi:10.1093%2Fbrain%2F121.9.1749 42. Probst T, Straube A, Bles W. Differential effects
of ambivalent visual-vestibular-somatosensory stimulation on the perception of self-motion. Behavioural Brain Research 1985;16(1):71-79; doi:10.1016/0166-4328(85)90083-X
43. Wenzel R, Bartenstein P, Dieterich M, Danek A, Weindl A, Minoshima S, Ziegler S, Schwaiger M, Brandt T. Deactivation of human visual cortex during involuntary ocular oscillations: A PET activation study. Brain 1996;119(1):101-110; doi:10.1093%2Fbrain%2F119.1.101
44. Pinto M, Cavallo V, Ohlmann T. The develop-ment of driving simulators: Toward a multisensory solution. Le Travail Humain 2008;71(1):62-95; doi:10.3917%2Fth.711.0062
45. Kennedy RS, Stanney KM, Dunlap WP. Duration and exposure to virtual environ-ments: sickness curves during and across sessions. Presence 2000;9(5):463-472; doi:10.1162%2F105474600566952
46. Stoffregen TA, Chen FC, Varlet M, Alcantara C, Bardy BG. Getting your sea legs. PLoS One 2013;8(6):e66949; doi:10.1371%2Fjournal. pone.0066949
47. Turner M, Griffin MJ. Motion sickness inci-dence during a round-the-world yacht race. Aviation Space and Environmental Medicine 1995;66(9):849-856
48. Emmerik ML van, Vries SC de, Bos JE. Internal and external fields of view affect cybersickness. Displays 2011;32(4):169-174; doi:10.1016%2Fj. displa.2010.11.003
49. Bos JE, Vries SC de, Emmerik ML van, Groen EL. The effect of internal and external fields of view on visually induced motion sickness. Applied Ergonomics 2010;41(4):516-521; doi:10.1016%2Fj. apergo.2009.11.007