HAL Id: hal-03001696
https://hal.archives-ouvertes.fr/hal-03001696
Submitted on 12 Nov 2020HAL is a multi-disciplinary open access archive for the deposit and dissemination of sci-entific research documents, whether they are pub-lished or not. The documents may come from teaching and research institutions in France or abroad, or from public or private research centers.
L’archive ouverte pluridisciplinaire HAL, est destinée au dépôt et à la diffusion de documents scientifiques de niveau recherche, publiés ou non, émanant des établissements d’enseignement et de recherche français ou étrangers, des laboratoires publics ou privés.
Combined Nuclear Magnetic Resonance Spectroscopy
and Mass Spectrometry Approaches for Metabolomics
Marine Letertre, Gaud Dervilly, Patrick Giraudeau
To cite this version:
Marine Letertre, Gaud Dervilly, Patrick Giraudeau. Combined Nuclear Magnetic Resonance Spec-troscopy and Mass Spectrometry Approaches for Metabolomics. Analytical Chemistry, American Chemical Society, In press, �10.1021/acs.analchem.0c04371�. �hal-03001696�
1
Combined Nuclear Magnetic Resonance Spectroscopy and Mass
1
Spectrometry Approaches for Metabolomics
2
Marine P .M. Letertrea, Gaud Dervillyb, Patrick Giraudeaua,*
3
a Université de Nantes, CNRS, CEISAM UMR 6230, F-44000 Nantes, France 4
b LABERCA, Oniris, INRAE, 44307 Nantes, France 5
* Email: patrick.giraudeau@univ-nantes.fr . 6
Fundamental and Applied Reviews in Analytical Chemistry 2021. 7
8 9
2 Metabolomics is based on cutting-edge analytical methods that provide a “snapshot” of all the 10
detectable metabolites, small molecules generally weighing under 1200 Da, present in complex 11
biological samples. It presents a wide scope of applications and has allowed considerable progress to 12
be made in health and disease research,1,2 pharmaceutical sciences,3–5 personalized medicine,6–10
13
microbiome research,11,12 but also in food and nutrition,13–16 agriculture,17,18 marine environmental
14
research19,20 or exposome research.21–23 Metabolomics can be undertaken through two different
15
approaches. Untargeted methods aim at capturing a broad view of all the metabolites present in a 16
biological sample, without any a priori, up to the limit of the accessible metabolites which depends on 17
the detection limit of the applied analytical method, the physicochemical properties of the analytes, 18
as well as the sample handling or preparation applied. An untargeted assay often aims to identify one 19
or several new biomarkers of a particular phenotype, which can be for instance markers of interest of 20
a specific disease, or markers of effect following an exposition to a physical or a chemical stress or a 21
therapeutic treatment, and to elucidate their structures. It can also help to build a model capable to 22
predict a specific condition, such as in foodomics. Once untargeted analyses have been performed and 23
that effect biomarkers have been discovered, or if there are known exposure biomarkers of interest 24
(e.g., xenobiotic such a specific drug or a chemical contaminant and their metabolites), a targeted 25
approach will make it possible to perform a quantitative analysis of those compounds. In the case of 26
biomarker discovery, quantitative insights through targeted analysis are often needed to validate that 27
a metabolite is indeed a real biomarker. Halfway between untargeted and targeted approaches stands 28
a slightly different strategy, where compounds from the same class of metabolites or a particular 29
biochemical pathway (e.g., bile acids or amino acid metabolism) need to be broadly captured and if 30
possible in a quantitative way but when the rest of the metabolome is not relevant to the research 31
problem. 32
Currently, the two main analytical techniques used to apply those approaches are nuclear 33
magnetic resonance (NMR) spectroscopy, based most of the time on the detection of 1H or 13C nuclei,
34
and mass spectrometry (MS), often coupled with separation techniques such as liquid or gas 35
chromatography (LC or GC), capillary electrophoresis (CE), or ion mobility (IM). NMR spectroscopy is a 36
noninvasive technique, as the sample can be recovered and used in a following experiment (providing 37
that the sample preparation needed for NMR analysis such as D2O addition, does not interfere with
38
the following experiment). In contrast, MS analysis, due to the nature of the technique, is destructive 39
but, as only relatively small volumes are required (as low as few microliters of an often very diluted 40
sample), this does not necessarily cause problems. NMR spectroscopy also presents the advantage of 41
providing accurate quantitative results, making possible the quantitation of multiple analytes with a 42
single internal or external reference.24 Furthermore, 1H NMR spectroscopy has the strong advantage
3 of being a robust and reproducible technique, both through time and between laboratories.25
44
However, the main drawback of NMR spectroscopy is its relative lack of sensitivity, together with 45
ubiquitous signal overlap in the 1H NMR spectrum of biological samples, which limits the identification
46
of metabolites and the discovery of significant biomolecular changes and biomarkers. Recent progress 47
has been made to overcome such limitations. The overlap issue has been solved by including the 48
acquisition of 2D NMR data sets in metabolomics workflows to reduce signal overlap while providing 49
crucial information to elucidate the structure of metabolites.26,27 While 2D NMR suffers from long
50
acquisition times, numerous methodological developments made it possible to reduce acquisition 51
times to a few minutes for biological samples, and the quantitative issues associated with 2D NMR 52
have also been addressed through pulse sequence developments or calibration strategies.28–30 More
53
recently, proof-of-concept developments have been addressing the sensitivity issues of NMR 54
metabolomics, notably through hyperpolarization strategies such as dissolution dynamic nuclear 55
polarization (d-DNP)31–33 or para-hydrogen induced polarization (PHIP).34,35 These techniques offer an
56
unprecedented boost in NMR sensitivity by several orders of magnitude; however, they are very recent 57
and not yet implemented in routine for metabolomics. 58
MS-based techniques are the most widely implemented strategies for metabolomics purposes 59
(Figure 1), especially UPLC-MS with electrospray ionization (ESI), thanks to the greater sensitivity that 60
this technique offers. This fact has been reinforced in recent years thanks to the development of high-61
resolution (HR)-MS techniques and the possibility to determine the accurate mass of a compound. 62
However, these techniques are somewhat less robust than NMR ones, and although targeted assays 63
are generally comparable between laboratories,36,37 untargeted methods require careful quality
64
control (QC, biological pool sample) procedures to assess robustness and repeatability over time.38–41
65
Also, the important sensitivity that MS and especially HRMS techniques offer comes with its drawback, 66
such as ion suppression. However, using multiple ionization modes (positive and negative) for ESI and 67
several chromatographic systems (reversedpPhase [RP] and hydrophilic interaction chromatography 68
[HILIC]), as well as any other strategy enabling signals deconvolution such as IM,42 are clear advantages
69
to increase metabolite coverage. 70
Metabolomics greatly benefits from the tremendous progress made in both MS and NMR in the 71
past couple of decades, in terms of sensitivity, resolution, and rapidity, but also from advances in 72
statistical analysis and bioinformatics methods. However, most of these recent advances are costly, 73
time-consuming, and require advanced technical skills, which makes them not easily accessible. 74
Furthermore, none of the analytical methods existing today allow a full capture of the metabolome. 75
This is due to multiple factors, such as sensitivity limitations, loss of metabolites during sample 76
collection, handling, preparation, and analysis (e.g., nonretention/nonelution, ionization efficiency, 77
4 signal overlapping…). In consequence, the use of both routine NMR spectroscopy and MS-based 78
techniques through an integrated platform is a sensible and powerful option to maximize metabolome 79
coverage, facilitate metabolite identification and biomarkers discovery, and build more robust models 80
through the use of multiple data set integrations.43,44
81
The combined use of NMR and MS has been long exploited for the structural characterization of 82
new metabolites of interest, especially in the natural products field.45 Analysis of 1D and 2D NMR
83
spectra to extract chemical shift and coupling information, as well as direct infusion MS to obtain an 84
exact m/z ratio and fragmentation patterns, help to identify and structurally define new metabolites 85
following several steps of purification. In metabolomics, many published studies relied on only one of 86
the two techniques, mainly for opportunistic reasons, i.e., researchers focusing on metabolomics 87
studies were using the closest available technique in their laboratory or institute. Figure 1 shows that 88
the proportion of MS versus NMR in metabolomics has been increasing over time, mainly for cost and 89
sensitivity reasons. However, Figure 1 also sheds light on a still modest but substantial increase of the 90
number of studies that make use of both techniques, suggesting that the combination of MS and NMR 91
for metabolomics could be highly valuable. This review focuses on the description of such powerful 92
combination, which can be done through various ways. NMR and MS can be combined at the hardware 93
level through physical association of the two techniques. However, in most cases, it relies on 94
integrating the respective data sets in a common chemometric software and multivariate statistical 95
analysis pipeline. Such integration can be performed at different levels, through cross-comparison, 96
correlation, or multiblock integration. In the review herein, we describe the principles of such 97
combination, highlighting how it has provided a considerable paradigm shift in metabolomics in the 98
past few years. The benefits of gathering these techniques in postmetabolomics workflow through 99
more targeted approaches to improve metabolite identification, quantitative assays, and fluxomic 100
analysis are also exposed, before discussing the perspectives of integrating several metabolomics and 101
omics methods in general. Individual methodological advances made in NMR or MS metabolomics are 102
excluded from the scope of this review, but they have been thoroughly reviewed recently46,47 and will
103
certainly benefit to combined MS and NMR approaches. 104
5 105
Figure 1. (a) Results obtained by searching through pubmed.ncbi.nlm.nih.gov in [Title/Abstract], the following
106
terms: “(nuclear magnetic resonance OR NMR) AND (metabolomics OR metabonomics OR metabolic profiling)”,
107
shown in orange; “(mass spectrometry OR MS) AND (metabolomics OR metabonomics OR metabolic profiling)”,
108
shown in blue; “(nuclear magnetic resonance OR NMR) AND (mass spectrometry OR MS) AND (metabolomics OR
109
metabonomics OR metabolic profiling)”, shown in gray. Research was done on September 18, 2020. (b)
110
Schematic representation of the advantages and the drawbacks of NMR and MS-based analytical methods and
111
the benefits of combining them.
112
NMR and MS Hardware Combination
113As stated above, the combination of several NMR (e.g., 1D/2D, 1H/13C) or MS platforms (e.g.,
114
LC/GC, ESI+/-, RP/HILIC) increases the metabolic coverage, and the combined use of both NMR and MS 115
platforms can also help toward that same objective. Such a combination was initially applied in the 116
natural products research field, in order to help with structural elucidation, through an off-line 117
platform based on the comparison of NMR chemical shifts and coupling constants as well as HRMS to 118
obtain exact m/z and fragmentation patterns. This hyphenation led to the development of online 119
platforms including both NMR and MS hardware, often preceded by an LC system. This type of system 120
found applications in drug metabolism research or drug discovery from natural products, especially to 121
help with dereplication, consisting of identifying known natural compounds from active fractions to 122
avoid spending time on compounds which had already previously been discovered.48 The hyphenated
123
use of LC-MS-NMR was achieved thanks to postcolumn splitters, which send 10% of the outgoing flow 124
from the LC column to the MS system and the remaining 90% to the NMR system.44 A commercial
125
NMR-MS interface was also developed, composed of a splitter controlled by the operator and a double 126
dilutor.44 The latter allows, on the one hand, the prevention of an extensive use of deuterated solvent
127
as the sample is mixed in D2O just before entering the NMR system rather than before entering the LC
128
system and, on the other hand, to dilute the sample in the appropriate solvent for ionization and MS 129
detection.44
6 Three different ways exist to set up such a combined platform, namely, through a continuous-flow 131
mode, a stop-flow mode or a storage mode (Figure 2).49 By using the dynamic continuous-flow mode,
132
the sample already mixed with deuterated solvent is sent to the LC system before flowing separately 133
and continuously in the MS and the NMR systems. One of the first examples of this continuous-flow 134
mode was made by Shockcor and co-workers in 1996 to analyze a urine sample from an individual 135
administrated with paracetamol, in order to identify with more confidence paracetamol metabolites 136
and urinary endogenous compounds.50 Phenylacetylglutamine, not previously detected by 1H NMR
137
spectroscopy alone due to spectral overlapping but usually detected by HPLC-MS and confirmed by 138
the use of a standard, was well identified thanks to the good resolution obtained by this HPLC-NMR-139
MS system.50 The NMR data set made it possible to clearly define which paracetamol-glucuronide
140
isomer was observed, and this would not have been possible by the unique use of MS or HPLC-141
MS/MS alone without comparison to an internal standard. However, this technique is limited by the 142
time-evolving LC gradient composition which induces a bias in the NMR measurement. Indeed, this 143
leads to an evolution of the position of the solvent peaks which makes it difficult to maintain an 144
efficient solvent signal suppression over time.49 Most importantly, the short residence time of nuclear
145
spins in the NMR detection cell strongly limits signal averaging, which in turns impacts the resulting 146
NMR signal-to-noise ratio (SNR). This issue can be addressed by using a static analysis such as the stop-147
flow mode, during which a valve pauses the LC flow when a peak is detected or selected and that the 148
corresponding analyte has reached the NMR detection cell. This approach provides enough time for 149
the NMR measurement to be performed with a satisfactory SNR. However, stop-flow broadens the LC 150
peaks thus limiting the chromatographic resolution. As a consequence, a storage mode has often been 151
preferred, either performed through an online or off-line setup. For this mode, the different fractions 152
coming out from the LC system can be collected and stored in a loop while the NMR analysis is running. 153
The sample collection can also be done in a cartridge, most of the time a solid-phase extraction (SPE) 154
cartridge, which receives 95% of the LC eluent (the other 5% being sent toward the MS system) and 155
which efficiently retains and concentrates analytes before NMR characterization, preventing an 156
extended use of deuterated solvent.51
7 158
Figure 2. Schematic setups of the different LC–NMR working modes with parallel mass spectrometer (MS)
159
detection: (a) online/continuous-flow mode, (b) stop-flow mod,e and (c) loop/cartridge storage mode. Figure
160
reproduced from ref. 49 under Creative Commons Attribution 4.0 International License 161
(http://creativecommons.org/licenses/by/4.0/).
162
LC-MS-SPE-NMR has been elegantly applied to help with the structural elucidation of urinary 163
phenolic compounds in humans following tea consumption, once classical off-line LC-Orbitrap Fourier 164
transform MS (LC-FTMS) and 1D 1H NMR analysis were performed separately to select features of
165
interest for further characterization.52 This approach efficiently provides comprehensive structural
166
confirmation of the fragmentation patterns of the selected feature, while simultaneously providing 167
quantitative data based on the 1H NMR spectroscopy part of the system. This hyphenated system has
168
found successful applications in natural product research, especially when it comes to structural 169
elucidation or to differentiate isomeric or isobaric compounds.49 However, several drawbacks still limit
170
its widespread use, such as the bulky and expensive equipment, associated with a limited sensitivity. 171
The latter drawback has pushed toward the development of integrated microprobe technologies and 172
capillary separation.49,53 Lin and co-workers reported an LC-MS-NMR platform with microscale
173
instruments, namely, a nanoSplitter LC-MS and a microdroplet NMR, for increased sensitivity.54 The
174
use of a highly sensitive instrument such as a nanoelectrospray MS, requested only 2% of the LC 175
column eluent, driving away the rest to a UV-guided collection for concentration prior to be stored 176
waiting for an off-line NMR analysis. This setup limited the use of deuterated solvent as it was added 177
just before the NMR analysis, which can thus be done retrospectively once the LC-MS analysis have 178
been performed. However, it reintroduced an additional step of sample handling prior to NMR 179
8 analysis. And although the sensitivity was further optimized in this application by using a microcoil 180
NMR probe,54 the robustness of such equipment is questionable,53 which is a major bottleneck to
181
create high-quality databases aiming to accelerate structural characterization of low concentration 182
analytes in complex matrices.55
183
Beyond its ability to help with structural elucidation in natural product research and the efforts 184
made to minimize sample handling and preparation while increasing its sensitivity, the hyphenated LC-185
MS-NMR system did not receive the success expected by some in the past decade. The known 186
limitations of such a platform, namely, the incompatibility of the solvents for MS and NMR or the 187
extended use of expensive deuterated solvent, the low flow rate for efficient ionization and MS 188
detection, and the long acquisition time requested for a sufficient NMR sensitivity,56 were not
189
overcome. As such, it seems unlikely that such a system will be further encouraged by the 190
metabolomics community, especially when promising computed-based combination solutions are 191
being developed. 192
NMR and MS Data Set Combination for Metabolomics Analysis
193Cross-Comparison of NMR and MS Data Sets to Increase Metabolic Coverage 194
Although good convergence was found between different techniques in interlaboratory studies,57
195
individual analytical techniques do not necessarily cover the same types of metabolites. The parallel 196
use of NMR and MS methods can highly improve the quality of metabolomics studies in a variety of 197
ways. The most obvious case where the combination of the two techniques can be beneficial is the 198
increase of metabolic coverage.58 This was illustrated, for instance, in a study aiming to investigate the
199
biomolecular processes behind the mycotoxins production of cereals infected by the plant pathogen 200
Fusaium graminearum.59 In this work, NMR spectroscopy and LC-QTOF-MS (based on a reversed-phase
201
stationary phase) analyses were performed to measure polar and semipolar compounds, respectively. 202
In total, 15 amino acids or derivatives, 3 sugars and polyols, 4 tricarboxylic acid (TCA) organic acid 203
derivatives and 4 nucleosides and nucleotides were identified or putatively annotated by NMR or 2D 204
NMR, while 55 sesquiterpenes and 10 polyketides were highlighted by MS or MS/MS.59 None of the
205
metabolites identified or annotated by one technique were claimed to be identified by the other. More 206
studies with key numbers highlight the advantage of combining NMR and MS method to increase the 207
metabolic coverage. Goulitquer et al. combined one 1H NMR, one GC-MS, and seven LC-MS data sets
208
to explore the changes induced in the metabolome and the lipidome of human gastric cancer cells 209
following treatment with anticancer drugs.60 The LC-MS data sets were acquired on three different
210
instruments (UHPLC-LTQ-Orbitrap, UHPLC-Exactive, UPLC-HRMSe Q-TOF) and provided analyses in 211
both positive and negative modes. Out of the 111 metabolites and lipids annotated, only 9 were 212
9 common to the LC-MS and the GC-MS data sets, 4 between the LC-MS and the NMR, 2 between the 213
GC-MS and the NMR, and 6 were concordant between the three platforms. A recent study successfully 214
attempted to capture the broadest picture of the human serum metabolome.61 To do so, five analytical
215
platforms were used, namely, 1H NMR, GC-MS, LC-ESI-MS/MS, TLC/GC-FID-MS and DI-MS. Over 3500
216
distinct metabolites were identified, and from those, only 29 were commonly identified by NMR and 217
GC-MS, 13 by NMR and DI-MS, 14 between GC-MS and DFI-MS, 8 between the three analytical 218
methods just cited, and 53 between DFI-MS and TLC/GC-FID-MS.61 It should be noted that the
219
spectacular effort made through this study was complemented with an extensive literature research, 220
called “bibliomic”, which found 665 other serum metabolites already reported in the literature but not 221
detected by the five analytical platforms applied. Quantitative data were also reported for a portion 222
of the over 4000 metabolites, showing acceptable agreement between the concentrations obtained 223
from the different analytical methods but still with some exceptions.61 In a similar way, the combined
224
use of NMR, FIA-MS/MS, GC-MS, and LC-HRMS was applied to explore the skeletal muscle 225
metabolome,62 in order to assess their performance as well as different sample extraction protocols.
226
Here again, only 2 metabolites were commonly detected by the four analytical methods, 2 metabolites 227
common to LC-HRMS, GC-MS, and NMR, 3 common ones between FIA-MS, GC-MS, and NMR, and 4 228
common ones between LC-HRMS, FIA-MS, and NMR (Figure 3).62 The GC-MS covered 7 unique
229
metabolites, against 13 ones for the NMR, 26 for the FIA-MS and 58 for the LC-HRMS. Although these 230
numbers suggest that GC-MS was the less efficient tool to study such samples,62 some of the 7
231
metabolites detected by GC-MS could be of crucial importance to understand key metabolic pathway 232
alterations or biomarker discovery. 233
10
Figure 3. Venn diagram representing specificity and overlap of metabolites reliably detected by each analytical
235
method. Red, blue, green, and black circles represent metabolites analyzed respectively, by NMR, FIA-MS,
GC-236
MS, and LC-HRMS. Crossed zone represents overlaps between methods. Figure reprinted from J. Pharm. 237
Biomed. Anal., Vol. 148, Bruno, C.; Patin, F.; Bocca, C.; Nadal-Desbarats, L.; Bonnier, F.; Reynier, P.; 238
Emond, P.; Vourc’h, P.; Joseph-Delafont, K.; Corcia, P.; Andres, C. R.; Blasco, H. The Combination of 239
Four Analytical Methods to Explore Skeletal Muscle Metabolomics: Better Coverage of Metabolic 240
Pathways or a Marketing Argument?, p 273-279 (ref62). Copyright 2018, with permission from Elsevier. 241
Several examples have shown how increasing the metabolic coverage with a second metabolomics 242
approach can help gaining a deeper understanding of a biological process. For instance, Allwood et al. 243
used this strategy to understand fragrance and maturity development in five melon cultivars,63 mainly
244
depending on volatile organic compounds (VOCs). As it is often the case to measure VOCs, GC-MS was 245
used, with thermal desorption. Optimization of the sampling method based on the use of a 246
polydimethylsiloxane membrane allowed the detection of 58 VOCs.63 Principal component analysis
247
(PCA), heatmap, and relative changes highlighted clear differences between five melon cultivars, which 248
were further supplemented with quantitative measures of amino-acids, known precursors of certain 249
VOCs, by 1H NMR spectroscopy. Reverse correlations between amino acids concentrations and VOCs
250
levels were observed, clearly showing that consumption of amino acids to produce VOCs directly 251
influence melon fragrance and maturity. 252
Still, contradictory results are sometimes encountered when both techniques are applied to the 253
same matrix. For instance, different concentrations can be measured in the NMR and the MS data set, 254
or a compound can be detected by one technique and not by the other, which is actually the reason 255
why using both in combination increases the metabolic coverage. A typical example of this problematic 256
has been reported by Atherton et al. in 2006,64 where metabolic profiling of several tissues from
257
control or peroxisome proliferator-activated receptor-alpha (PPAR-alpha) null mice were explored by 258
using 1H NMR spectroscopy, high-resolution magic angle spinning (HR-MAS) 1H NMR spectroscopy,
GC-259
MS, and LC-MS. In this study, significant changes were observed in the cardiac metabolic profile of the 260
control vs muted mice by 1H NMR, HR-MAS 1H NMR, and GC-MS, but the order of magnitude of these
261
changes were different from one method to the other. Indeed, as 1H NMR spectroscopy has limited
262
sensitivity, only the most concentrated compounds appeared significantly different in the PCA model, 263
while the number of metabolites significantly impacting the GC-MS partial least-square discriminant 264
analysis (PLS-DA) model were 5 times more numerous.64 This was explained by the fact that
265
metabolites with hydroxyl and amine functional groups were easily detected by GC-MS, even though 266
they might not be the most concentrated metabolites. This constitutes a perfect representation of how 267
difficult it is to catch, within a complex biological sample, metabolites present in a broad variety of 268
concentration, polarity, and mass range.64 On a side note, in order to increase the number of
269
metabolites detected by both NMR and MS techniques, an elegant approach is to use a smart isotope 270
11 tag, such as 15N-cholamine, which present the advantage of being a sensitive isotope for NMR and of
271
having a permanent charge for MS efficient detection.65 Chemical derivatization with this smart tag
272
allows the simultaneous detection of carboxylic acid derivatives without ambiguity. However, this 273
approach is restricted to metabolites containing a carboxyl group and thus covers a limited part of the 274
metabolome. 275
Correlation of NMR and MS Data Sets 276
Rather than taking into consideration the different variables within a sample, correlation analysis 277
is based on taking into consideration the intensities of the same variable across different samples.66
278
The first correlation tools that appeared in metabolomics focused on the 2D correlation of vibrational 279
spectroscopic data, such as IR or Raman.67 Numerous statistical tools for spectroscopic correlation
280
arose from it but mainly for the interpretation of NMR data sets.68 One of the most common tools is
281
based on statistical total correlation spectroscopy (STOCSY), which correlates signals showing similar 282
variations across samples within 1D 1H NMR spectra, in order to better extract individual metabolite
283
spectral patterns and facilitate the identification of biomarkers.69 It was further adapted to several
284
other statistical tools,68 such as Het-STOCSY, to correlate heteronuclear NMR signals, STOCSY-editing,
285
which aimed to correlate only the endogenous compounds without taking into consideration the 286
exogenous ones, or also statistical heterospectroscopy (SHY), which aimed to correlate signals from 1H
287
NMR with LC-MS ones. Through this tool, the intrinsic covariance of the NMR chemical shifts and the 288
m/z signal intensities of the same features is analyzed to help biomarker discovery and achieve a
289
deeper understanding of the biological alterations due to a specific drug treatment or disease. The 290
efficiency of the SHY method was illustrated through a proof-of-concept study measuring the effect of 291
hydrazine treatment in rat urine samples.70 Prior to the correlation, the data sets need to be formatted.
292
As such, a cubic spline was used to smooth the NMR spectra, and MS spectra were binned to produce 293
2D histograms which were further summed by a specific retention time window to create pseudo 294
direct infusion spectra and prevent the loss of the LC-MS signals eluting closely to the chromatographic 295
dead volume.70 Subsequent normalization was required to take into consideration the different
296
dilution factors of the urinary metabolites. Correlation coefficients were calculated by using a Pearson 297
correlation and visualized according to a specified cutoff.70 This powerful tool was then applied to
298
human urine samples within an epidemiological study where the studied population was not 299
controlled or selected.71 Even so, the use of therapeutic treatment was easily detected in the samples,
300
and the additional use of MSE(the combined used of low and high collision energy to simultaneously
301
detect the precursor and the fragments m/z) data allowed the annotation of unreported drug 302
metabolites (Figure 4). Together with the detection of more common endogenous metabolites, it 303
12 showed that SHY is a useful statistical tool to explore the xenometabolome and its effect on metabolic 304
phenotypes.71
305
306
Figure 4. SHY plots: (a) Correlation (cutoff 0.7) of a hippurate NMR signal (doublet at 3.97 ppm) with the hippurate
307
parent ion (m/z 180, neutral molecule shown as inset a) and a fragment due to cleavage of glycine in-source (m/z
308
105). Also shown are correlations due to creatine (singlet at 3.93 ppm, m/z 132, neutral molecule shown as inset
309
b) and acetaminophen-related signals (doublet at 3.89 ppm, multiplet at 3.62 ppm, m/z 152). The inset NMR
310
spectra are the mean spectrum and the spectrum for the sample with the highest concentration of
311
acetaminophen. The inset MS spectrum is the mean. (b) Correlation (cutoff 0.7) between aromatic NMR signals
312
for acetaminophen and ibuprofen metabolites and various nominal m/z values. Those for acetaminophen can be
313
immediately identified as belonging to the unmodified drug (m/z 152), its cysteinyl conjugate (m/z 271), and its
314
acetylcysteinyl conjugate (m/z 313, neutral molecule shown as inset). Those for ibuprofen require investigation
315
of the MSE spectra. The inset NMR spectra are for those samples having the highest respective NMR intensities,
316
and the inset mass spectrum is the sum of the corresponding mass spectra. Some trace of previous
317
acetaminophen usage is present in the NMR spectrum illustrating ibuprofen. (c) Correlation (cutoff 0.8) between
318
some aliphatic NMR signals for ibuprofen metabolites and m/z values in a higher range than given in Figure 1b.
319
The inset spectrum is for the sample having the highest ibuprofen intensity. Correlations due to the first 13C
320
isotope can be distinguished for the strong signal at m/z 421. (d) Correlation (cutoff 0.8) of disopyramide-related
321
NMR signals with m/z values for disopyramide (m/z 340) and its known metabolite N-dealkyldisopyramide (m/z
322
298). The first 13C isotope correlations are visible. The inset NMR spectra are for a disopyramide standard (top)
323
and for the urine sample giving the highest relevant signal intensities (bottom). The inset mass spectrum is for
324
the same urine sample. It is clear that the urine NMR signals do not match the NMR signals for the disopyramide
13
standard (although in UPLC-MS an exact match to the standard was obtained). The NMR signals must therefore
326
be due to an unidentified disopyramide metabolite, a covarying endogenous metabolite, or an additional
327
(unknown) drug that was being taken by the single subject who was taking disopyramide. Figure reproduced
328
from Crockford, D. J.; Maher, A. D.; Ahmadi, K. R.; Barrett, A.; Plumb, R. S.; Wilson, I. D.; Nicholson, J. K. 329
Anal. Chem. 2008, 80 (18), 6835–6844 (ref 71). Copyright 2008 American Chemical Society. 330
SHY also found applications in other fields than toxicology, as illustrated by Marti et al., who used 331
this statistical tool to assess the authenticity and geographical metabolic differences of cold-pressed 332
lemon oil.72 In this study, the NMR/MS correlation complemented by the use of geranial and neral
333
isomer standards, helped to determine the presence of both isomers but showed that the geranial one 334
was present in the samples at a higher concentration.72 SHY was also used in the natural product field
335
to identify bioactive compounds while avoiding a time-consuming isolation process.73 To do so,
336
microfractionation of samples prior to LC-MS (positive and negative ionization mode) and NMR 337
analyses were performed, as well as bioactivity assays. The selection of active NMR compounds, often 338
made difficult by the important overlap with inactive compounds was facilitated by the correlation 339
with LC-MS signals, making SHY a powerful tool for the deconvolution of natural products.73
340
Correlation analyses between NMR and MS data sets can also be used to confirm the annotations of 341
the discriminative features previously identified by PCA applied to one of the methods, as it was done 342
to study biological processes underlying the urine samples of patients with inborn errors of 343
metabolism.74 In this particular example, unsupervised PCA analysis was first performed on a NMR
344
data set and the features that significantly impacted the distribution of the samples were annotated. 345
Second, NMR spectra and MS spectra, from a DESI-MS data set, were bucketed into the same number 346
of bins (594) to obtain a square matrix that was subjected to a Pearson correlation.74 With this
347
approach, a common list of discriminant features can be annotated with more confidence when a MS 348
feature is positively correlated to an NMR annotation. Furthermore, it can also help to gain a better 349
understanding of the biochemical reactions lying behind a specific condition, as a negative correlation 350
can be explained by the consumption of the precursor compound and the production of another 351
compound.74 However, since the metabolic coverage of two analytical methods is different, it makes
352
sense to assume that a list of common features between the NMR and the DESI-MS data sets will 353
capture only a restricted portion of the urinary metabolome and that important biomarkers could be 354
missed. Still, statistical analysis based on correlation coefficients can be easily implemented while 355
allowing a straightforward interpretation of the results. 356
Although SHY seems to be the most widely correlation tool used in metabolomics to correlate 357
NMR and MS data sets, another statistical correlation tool based on networks was also reported. In a 358
first example, correlation networks were used to visualize the relationships between melon fruit 359
analytes that were identified and for some quantified by various analytical techniques (namely 1H NMR
14 spectroscopy and GC-MS analyses of polar compounds, HPLC analysis of lipophilic isoprenoids, 361
untargeted LC-MS analysis of semipolar compounds, untargeted GC-MS analysis of volatile compounds 362
and elemental profiling for mineral elements).75 This extensive metabolic profiling allowed the
363
identification or annotation of about 1932 features and 15 mineral elements. Within these features, 364
only a small proportion were detected by several analytical methods, which proves the essential need 365
of using several complementary analytical techniques to increase metabolic coverage. Following 366
feature selection based on a two-way ANOVA, Spearman correlation coefficients were calculated and 367
a cutoff (> 0.90) was applied, which set the number of features or mineral elements in the correlation 368
network at 715.75 A network cartography was then created based on the Fruchterman-Reingold
369
algorithm, where analytes were represented by the nodes and the Spearman correlation coefficients 370
by the distance of the link between the nodes. This correlation network analysis made it possible to 371
identify clusters of metabolites which were coregulated, to establish global changes in metabolic 372
composition, and to highlight the association between primary and secondary metabolites with 373
minerals or volatile compounds.75 This approach was not developed to help with structural elucidation
374
but rather to obtain a broader picture of the biological process and better understand metabolic 375
interactions. It also applies to other kind of biological interactions; indeed, correlation networks were 376
used to explore gene-metabolite association in tomato fruit, for instance.76
377
Multiblock Fusion 378
The use of multiblock data integration, or data fusion, has been increasing in omics sciences for a 379
couple of decades and this approach can be applied at different levels.66 Low-level data fusion consists
380
of combining the preprocessed individual blocks at the data level without performing any variable 381
selection prior to modeling the resulting block and in interpreting the global outcome. Although this is 382
a straightforward way to approach data integration, careful consideration must be taken regarding 383
scaling and normalizing the individual data sets. Indeed, because of the sensitivity and robustness 384
differences existing between analytical methods (e.g., NMR or HRMS), the analytical response for a 385
single compound will vary from one data set to another. Data set manipulation to overcome this 386
obstacle can give too much weight to similar variables (e.g., isotopes and fragments from the same 387
metabolite or metabolites from the same pathway), as it is the case when the individual data sets are 388
autoscaled. Scaling can thus also be performed by considering sub-blocks of similar variables, which 389
weight the influence of sub-blocks according to their size. Either way, low-level data fusion has been 390
described as an approach which provides only limited useful information in metabolomics.66
391
Furthermore, because the totality of each individual data set is being integrated as is, the size of the 392
resulting data matrices before modeling is considerable. As such, mid-level data fusion considers only 393
the most discriminant features highlighted by block-wise statistical analyses of the individual blocks, 394
15 which can be complemented by applying an additional technique to further reduce the dimensionality 395
of the integrated matrix.66 Also, assessing separately each data set through mid-level data fusion
396
highlighted metabolites detected by several methods, which could be over-represented in the global 397
model and which may introduce bias in biomarker discovery. Finally, data fusion can also be applied 398
through a high-level approach, where individual blocks are preprocessed and modeled separately, as 399
for a mid-level approach, but where the global output (e.g., the predictive algorithms) of each of the 400
individual model is integrated, rather than their discriminant features.66 It is important to mention that
401
statistical model validation is crucial in metabolomics in order to properly assess the performance of 402
the model without overfitting it,77,78 but although several validation tools exist, no common agreement
403
has been found regarding which one is the most suitable.79–81 The predictive power of the combined
404
output obtained following a high-level approach is highly expected to be equal or higher than the 405
predictive power of the best performing individual model, and thus the error rate is also expected to 406
be reduced.82 However, the predictive performance of the global output will increase more
407
importantly if the classifiers used present similar discriminative performance, which is often the case 408
in metabolomics.82 In such cases, integration of the individual output through correlation networks, as
409
presented in the Correlation of NMR and MS Data Sets section, might be a solution to jointly interpret 410
individual results while preserving the predictive performance of the individual analysis.66 In a way,
411
correlation networks can be considered as a high-level data fusion approach but from which the 412
biological interpretation can often be complicated by an extensive visualization output. 413
Following the selection of the data integration approach, several modeling techniques are 414
available and can be applied for individual data set analysis (for mid- or high-level approaches, before 415
data fusion of the selected features or the individual global outputs, respectively) or by global analysis 416
(for low- or mid-level approaches once data fusion has been made).66 The resulting models naturally
417
highlight possible association between variables from different data sets to improve biological 418
interpretation but also serve to assess the contribution of each individual data set to the global model. 419
Sequential multiblock analysis, as unsupervised single block multivariate statistical analysis, aims to 420
describe the general trend of the matrix and is based on the calculation of one single component at a 421
time followed by a deflation procedure to calculate the next one. Several sequential multiblock 422
methods exist, from the simplest which are SUM-PCA or consensus PCA (CPCA) to more complex such 423
as hierarchical PCA (HPCA), generalized PCA (GPCA), multivariate component models or multiple factor 424
analysis.66,83 Similarly, several modeling tools exist to apply predictive supervised analysis, such as PLS
425
regression or discriminant analysis, orthogonal-PLS (O-PLS or O2-PLS), hierarchical PLS (HPLS) or 426
multiblock PLS (MBPLS).66,84 Those statistical methods allow the combination of data sets from
427
different analytical methods, whatever the size of the different blocks. In metabolomics, however, 428
16 even though the numbers of variables can change from one NMR to one MS block for instance, it is 429
preferred to have the same number of objects (or samples) for all blocks. The following paragraphs 430
illustrate how such data fusion and data modeling approaches have maximized the potential of 431
combining NMR and MS data in metabolomics. 432
In a first example, HPCA was applied to the study of three melon cultivars by 1H NMR spectroscopy
433
and by GC-MS, but not only to fuse both data sets.85 Indeed, in this example, classical PCA on 1H NMR
434
managed to discriminate the samples coming from different spatial positions in the melon fruit, but it 435
failed when the PCA was based on the GC-MS data set. As such, the authors assigned each of the three 436
melon cultivars as an individual block and applied HPCA on them, which successfully highlighted 437
metabolic differences linked to the spatial positions of the samples.85 Furthermore, a HPCA model was
438
also built on the combination of both analytical techniques and showed the robustness of this 439
statistical tool as the compounds detected by both NMR and GC-MS were located at similar positions 440
of the loading plots.85 In another plant study exploring tomato fruits and leaves,86 the integration of 1H
441
NMR, LC-MS, and GC-MS data was directly done through a low-data level fusion approach, regardless 442
of their individual performance but further association was made with correlation networks to 443
facilitate the interpretation of the biological pathway regulations. 444
In a second example, 1H NMR spectroscopy and two HRMS instruments (TOF and Orbitrap) were
445
used to analyze honey samples from different botanical origins.87 PCA and PLS-DA were applied on
446
each of the individual data sets, before PCA modeling based on mid-level data fusion was performed 447
from two different angles. The first one was based on the fusion of the PCA scores of each of the data 448
sets, to prevent any loss of information, and the second one was based on the fusion of selected 449
variables from the individual PLS-DA models, to remove any irrelevant information. Both data fusion 450
approaches performed better than the individual models in term of discriminative power and sample 451
misclassification.87 The mid-level data fusion between NMR and HRMS-Orbitrap with variable
452
selections had the best discrimination of all the models reported, without misclassification, while the 453
mid-level data fusion between NMR and HRMS-Orbitrap without variable selections led to 454
misclassification. The fusion of NMR with HRMS-TOF data with our without variable selection did not 455
misclassify the samples but underperformed the discrimination of the samples with variable selection 456
compared to the fusion of the NMR and HRMS-Orbitrap data sets.87
457
Another study focused on the metabolic profiles of plasma samples from patients with stable 458
carotid atherosclerosis versus healthy subjects using GC-MS and 1H NMR spectroscopy.88 The individual
459
PCA models showed good separation of the samples but only along the third principal component, 460
which proved the presence of discriminative variables irrelevant to the pathology characterization. As 461
17 in single block multivariate analyses, PLS, or orthogonal signal correction (OSC), also called OPLS, 462
provided a better sample separation since the sample classification is included in the model. 463
Supervised analyses were thus performed, and the PLS-DA and OPLS-DA models of both individual data 464
sets did present a higher discriminative power compared to PCA models. Low-level data fusion was 465
then performed, and the supervised analysis of the resulting data set performed as well as the 466
individual supervised models.88 Here, the application of the combined NMR and MS supervised analysis
467
could thus be questioned, but a Pearson correlation between the metabolites scores obtained from 468
the predictive component of the combined OPLS-DA model allowed a broader understanding of the 469
metabolic pathway alteration than if only one technique would have been used for statistical analyses. 470
Even if supervised methods often enable a better separation than unsupervised analyses, they can 471
sometimes fail, and combining several analytical technologies might enhance the discriminative 472
performance of a model and help to highlight specific biomarkers. For instance, Gu et al. used 1H NMR
473
spectroscopy and direct analysis in real time (DART)-MS to discriminate serum samples from patients 474
with breast cancer from healthy controls.89 No distinct separation between the samples were observed
475
in the PCA models of each of the analytical data sets, although a slight grouping along the first principal 476
component was observed for the 1H NMR PCA model. Furthermore, both PLS-DA and OSC-PLS-DA
477
models based on each of the individual data sets did misclassify an important number of samples, 478
which was clearly beyond the acceptance rate when it comes to health applications.89 As such, PLS-DA
479
and OSC-PLS-DA models were rebuilt by setting the Y dummy matrix, the classification variable to the 480
first principal component of the 1H NMR PCA model, which performed slightly better than the
DART-481
MS PCA model, and the X matrix to the DART-MS data set, which was more sensitive. These models 482
both performed better than the individual supervised models, with a major preference for the OSC-483
PLS-DA which resulted in a lowest misclassification score due to the removal of confounding factors 484
following the orthogonal signal correction.89 Another study, which aimed to differentiate the
485
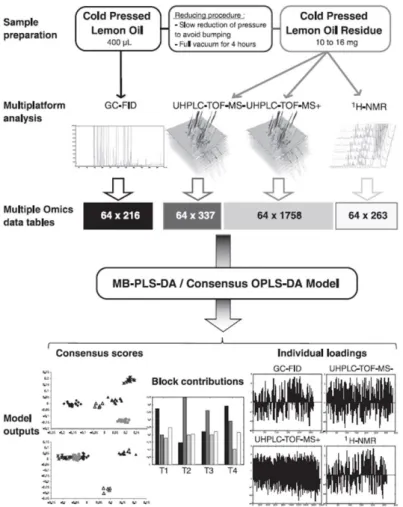
extraction protocols of cold-pressed lemon oil, supervised modeling analyses, namely, MB-PLS-DA and 486
consensus (C)-OPLS-DA, elegantly showed the benefits of using orthogonal projection to improve the 487
separation between samples.90 In this illustration, a low-data level fusion of untargeted data sets
488
obtained by 1H NMR, GC-FID and LC-MS in positive and negative ionization modes was used (Figure
489
5).90 The supervised analyses then showed a much better separation, and thus interpretability when
490
it came to the C-OPLS-DA compared to the MB-PLS-DA, although their predictive performance was 491
similar. It is important to note that even if the data matrix resulting from the fusion of these four data 492
sets was extensive, high-level data fusion successfully discriminated the same samples according to 493
their geographical origins in another study,91 but not according to their extraction processes.
494
Therefore, low-level data fusion can be a useful alternative when other modelling tools failed, at the 495
18 condition to take particular care for the scaling of the different datasets. As illustrated in another study 496
applying low-level data fusion, both of the 1H NMR and direct infusion (DI)-ESI-MS data sets were
497
scaled first to unit variance and second by the square root of the block variable count, in order to 498
ensure fairness in the consideration of each block.92 Other key elements were to note in this report, as
499
a thorough optimization of the sample preparation in order to prevent important sample handling. 500
This allowed the analysis of one single sample by both 1H NMR and DI-ESI-MS, and optimization of the
501
DI-ESI-MS protocol was undertaken to limit the matrix effect.92 Also, the backscaled 1H NMR and
DI-502
ESI-MS loading plots obtained from the MB-PLSDA, which outperformed the single block PLS, were 503
complemented by additional MS accurate mass and MS/MS experiments to compare with the NMR 504
signals and facilitate metabolite identification.92 Overall, this study provides a complete illustration of
505
how to combine NMR and MS data sets from sample preparation, data set acquisition, multivariate 506
analyses and metabolite identification. 507
508
Figure 5. Methodology used to integrate metabolomic data from multiple analytical platforms for a 509
comprehensive characterization of lemon essential oils. Figure reproduced from Integrating 510
Metabolomic Data from Multiple Analytical Platforms for a Comprehensive Characterization of Lemon 511
Essential Oils, Mehl, F.; Marti, G.; Merle, P.; Delort, E.; Baroux, L.; Sommer, H.; Wolfender, J.-L.; Rudaz, 512
S.; Boccard, J. Flavor Fragr., Vol. 30, Issue 2 (ref 90). Copyright 2015 Wiley.
513 514
19 Multiblock data fusion is thus starting to be anchored in the metabolomics landscape, and some 515
attempts are made to refine and bring some originality into those methods and to increase their 516
application scope. For instance, C-PLS-DA and C-O-PLS-DA have been applied to integrate MS with two 517
NMR data sets, one 1H data set and one 2D J-resolved (J-res) NMR.93 Also, data fusion can be based on
518
multiple kernel learning (MKL). This approach was applied to explore plasma metabolic alterations in 519
three different chronic diseases for example, namely, acute coronary syndrome, breast and colon 520
cancers.94 Serum samples were analyzed by NMR and LC-MS, and the resulting data sets were fused
521
with the metadata of the patients, which aimed to represent their lifestyle. The MKL fusion model 522
increased the performance of the individual models when it came to the acute coronary syndrome, 523
but slightly underperformed compared to the individual NMR model for the breast cancer condition, 524
and none of the individual or fusion model performed well regarding the colon cancer conditions.94
525
This could be due to the increase presence of confounding variables in the matrix, which complicated 526
the selection of discriminative variables. Several methods were actually developed to optimize variable 527
selection. Deng and co-workers proposed one based on backward variable elimination from PLS-DA 528
models and combined with Monte Carlo cross validation (MCCV-BVE-PLSDA).95 This method could be
529
considered as half way between low-level and mid-level data-fusion, as all the variables were 530
considered during the first iteration and since only the most predictive variables were kept during the 531
last iteration. A similar approach had been already proposed, called a Sparse multiblock PLS regression 532
(Sparse MBPLSR), implemented with a cross model validation in order to ensure the reliable and stable 533
variable selection for biomarker discovery.96 In a more recent report, the variable selection before
534
obtaining the final PLS-DA model was made in three steps. First, a curation step was applied to remove 535
all the redundant variables. Second, PCA and PLS-DA were performed and the resulting variables were 536
further filtered by performing different kind of statistical analyses, namely one-way ANOVA Sparse 537
PLS, or least absolute shrinkage and selection operator (LASSO). Third, PLS-DA was performed on each 538
of the resulting new subset of selected variables.97 All the PLS-DA following variable selection
539
performed better than the PLS-DA before variable selection and the models which had the best 540
performance were the one based on the variables selected by the Sparse PLS and the LASSO 541
techniques.97 Further matrix reduction can be performed but it depends on operator willingness to
542
discard information without affecting biomarker discovery or biological pathway understanding. In any 543
case, although a 2014 review mentioned that the multiblock fusion of NMR and MS techniques 544
followed by supervised analyses was not common in metabolomics studies,66 we hope to have shown
545
that since it has gained great interest as it maximizes the complementarity between both analytical 546
techniques. Although multiblock analyses do not always end up giving better results than single block 547
analysis and that it is important to keep a critical eye on the usefulness of this hyphenation, it has 548
already found various application fields. 549
20
Postmetabolomics Analysis: Reaching the Aim and Going Beyond
550
Identification 551
While increasing the metabolic coverage is of the utmost importance in metabolomics, it might be 552
even more crucial to identify the metabolites covered. Indeed, metabolite identification is clearly seen 553
as a major bottleneck in the field of metabolomics, especially in MS-based techniques. Thanks to the 554
robustness of 1H NMR spectroscopic analysis, NMR databases are easier to produce and more
555
trustworthy than MS databases. Generally, signals are compared and matched to experimental or 556
theoretical spectra registered in in-house or online databases. If a compound of interest cannot be 557
identified, it is an unknown compound annotated at a level 4 of confidence, the lowest according to 558
the criteria used by the Metabolomics Standards Initiative (MSI).98,99 If the chemical class of the
559
compound can be determined, the annotation level is 3. If a compound can be determined by 560
comparison to a database, it is a level 2 of annotation. Finally, if the compound matches with at least 561
two orthogonal parameters (e.g., the m/z and the retention time) compared to an authentic standard 562
which has been spiked into a sample, then the level of confidence is 1 and the term “identification” 563
can be used (although care still needs to be taken in the case of isomeric compounds, but 564
stereochemistry should soon be taken into consideration through a new and revised reporting 565
standards which are being discussed in the community with the Metabolite Identification Task group 566
of the Metabolomics Society leading on this initiative [Personal communication, Prof. Warwick Dunn, 567
cochair Metabolite Identification task group]), in contrast to the term “annotation” for levels 2, 3, and 568
4.99 Also sometimes, subconfidence groups in the level 2 annotation emerge, 2b being given if the
569
annotation to a specific metabolite is based on one orthogonal parameter (e.g., m/z or δ values 570
matching to database) and 2a if the annotation is based on two orthogonal parameters (e.g., m/z 571
values and retention time or m/z and δ values matching to databases) without spiking the 572
corresponding authentic standard. Hence, annotating a compound by using both NMR and MS 573
analytical techniques provides more confidence in the annotation level and facilitates structural 574
elucidation of unknowns. 575
Identification of unknowns is particularly difficult in plant metabolomics due to the lack of chemical 576
standards to confirm the identification of a new metabolite. Initial strategies developed were thus 577
based on accurate mass measurements by HRMS, allowing to obtain chemical formula and matching 578
them to possible chemical structures available in databases, before comparing their fragmentation 579
pattern.100 Successful candidates were confirmed following purification and NMR analysis for
580
structural characterization. This method could be limited by the fact that the lack of sensitivity of NMR 581
measurements could restrict the annotation of new metabolites or biomarkers. The use of capillary 582
21 NMR to overcome this limitation was seen as an alternative,101 but the process was not less
time-583
consuming and labor-intensive. More recent strategies have thus been proposed to increase the 584
identification of unknowns by relying on the complementarity between NMR and MS. The one that 585
attracted the most attention in metabolomics is the so-called SUMMIT, for Structures of Unknown 586
Metabolomics Mixture components by MS/NMR.102 Its principle relies on HRMS measurements of the
587
accurate masses of the different analytes present within a complex sample in order to determine their 588
molecular formulas. From those, all the possible scaffolds which can correspond to these formulas are 589
predicted, and the list can be extensive. A 1D or 2D NMR spectra is then predicted for each of the 590
predicted scaffolds. These predicted NMR spectra are then compared to experimental HSQC NMR 591
spectra, previously deconvoluted into 13C-1H HSQC chemical shifts of each metabolite by combining
592
information from 2D NMR experiments. The possible scaffold hits are finally ranked according the level 593
of concordance between the predicted and the experimental spectra.102 This method was initially
594
developed to prevent time-demanding steps such as sample separation/purification or interrogating 595
metabolic databases and was successfully applied to the identification of previously known compound 596
from E. coli as a proof of principle.102 However, subsequent publications showed that the approach
597
could be further improved by the interrogation of databases, making the method more general and 598
efficient.103,104 In the future, using the SUMMIT strategy could also help guiding retrospectively to a
599
specific MS platform ad hoc or encourage the use of multiple MS platform to increase the chance to 600
detect metabolites by both MS and NMR. Recently after the introduction of SUMMIT MS/NMR, 601
another strategy called NMR/MS Translator was proposed by the same group, as a tool which could 602
be used prior to SUMMIT MS/NMR.105 Following the 1D or 2D NMR spectral acquisition, NMR/MS
603
Translator questions NMR databases and from the obtained hits, it calculates isotopes, adducts, and 604
fragments. From those, MS spectra are reconstructed and compared to the upstream acquired MS1
605
experimental spectra.105 Interrogating databases is limited by the fact that the hits will depends on
606
how well a database is furnished, and yet there have always been a lot of disparities from one database 607
to another.58 Therefore, authors highlighted that the eye confirmation of the resulting annotations by
608
an operator should always be applied to prevent false identification, as reported with NMR/MS 609
Translator for 11 urinary metabolites. However once known metabolites are identified, unknown 610
metabolites are easily distinguished and SUMMIT MS/NMR can come to help (Figure 6),103 for which
611
automation efforts have been pursued.104 While these approaches are very elegant, they imply that
612
metabolites need to be detected by both NMR and MS measurements. However, as already explained 613
in Cross-Comparison of NMR and MS Data Sets to Increase Metabolic Coverage the metabolic coverage 614
between NMR and MS measurements is limited by different parameters such as the low sensitivity of 615
NMR or for MS techniques the ionization efficiency, the choice of the chromatographic phase, and the 616
ionization mode. Therefore, methods such as SUMMIT or NMR/MS translator are restricted to 617
22 compounds that can be detected by both the NMR and MS techniques. As such, physical or chemical 618
derivatization103 prior to analysis might give access to an increased number of unknowns that would
619
not have been commonly detected by NMR and MS otherwise. Although the associated sample 620
handling could be more time-demanding, it would lead to promising perspectives to uncover more 621
unknown metabolites. 622
623
Figure 6. Integrated metabolomics workflow for the identification of known and unknown metabolites in
624
complex mixtures. Combined use of metabolomics databases with experimental NMR and MS spectra (e.g.,
625
NMR/MS Translator105) allows the rapid identification of a maximal number of known metabolites present in the 626
mixture, while unidentified signals are used as fingerprints of unknowns. Next, structures of unknown
627
metabolites can be elucidated or vastly narrowed down by the combined use of multidimensional NMR, MS,
628
cheminformatics, and computation (e.g., SUMMIT MS/NMR102). Figure reprinted from Curr. Opin. Biotechnol., 629
Vol. 43, Bingol, K.; Brüschweiler, R. Knowns and Unknowns in Metabolomics Identified by 630
Multidimensional NMR and Hybrid MS/NMR Methods, p 17-24 (ref 103). Copyright 2017, with permission 631
from Elsevier.
632
Quantitation 633
Quantitative information about metabolites constitutes an invaluable asset to obtain a deeper 634
understanding of the biological reactions and processes occurring in an organism, as changes in 635
metabolite concentrations reflect changes in protein concentrations or gene expressions. For this 636
reason, efforts are being made to collect quantitative data and incorporate them in databases, as it 637
![Figure 1. (a) Results obtained by searching through pubmed.ncbi.nlm.nih.gov in [Title/Abstract], the following 106](https://thumb-eu.123doks.com/thumbv2/123doknet/11313475.282212/6.892.114.777.107.365/figure-results-obtained-searching-pubmed-title-abstract-following.webp)