Development and application of mass
spectrometry-based metabolomics methods
by
Lily Victoria Tong
Submitted to the Department of Chemical Engineering
in partial fulfillment of the requirements for the degree of
Doctor of Philosophy
at the
MASSACHUSETTS INSTITUTE OF TECHNOLOGY
September 2008
@
Massachusetts Institute of Technology 2008. All rights reserved.
A uthor ...
Department of Chemical Engineering
July 31, 2008
Certified by ...
Gregory N. Stephanopoulos
Willard Henry Dow Professor of Chemical Engineering
Thesis Supervisor
A ccepted by ...
William M. Deen
Chairman, Committee for Graduate Students
Development and application of mass spectrometry-based
metabolomics methods
by
Lily Victoria Tong
Submitted to the Department of Chemical Engineering on July 31, 2008, in partial fulfillment of the
requirements for the degree of Doctor of Philosophy
Abstract
Human societies face diverse health challenges including a rapidly aging population, rising incidence of metabolic disease, and increasing antibiotic resistance. These prob-lems involve complex interactions between genes and environment and are often not well understood. To address these challenges, high-throughput and reproducible ad-vances in genome sequencing, transcript measurement, and protein measurement have been developed; the information resulting from these techniques has led to an in-creased understanding of cellular function and the identification of number of novel biomarkers for a variety of diseases.
In recent years, the monitoring of such systems-level cellular behavior has natu-rally extended to the metabolite level, leading to the study of metabolomics. The rise of metabolomics corresponds hand in hand with the desire to address some of the phenotypic informational gaps left behind from genomics, transcriptomics, and proteomics. The study of metabolites carries several advantages. First, the number of metabolites in the human "metabolome," estimated at 2500 metabolites, remains a tractable number for analysis as compared to the 35,000 genes and 100,000-1,000,000 proteins. Metabolites also reliably provide an instantaneous "downstream" biochemi-cal snapshot of a cell, and the typibiochemi-cal metabolomics analysis is carried out on relatively noninvasive patient fluids such as urine or plasma.
The goal of this thesis is to design, develop, and apply methods for the metabolomic analysis of blood via gas chromatography-mass spectrometry (GC-MS) instrumenta-tion. Despite initial successes, methods in metabolomics vary widely and have not been standardized. This was first addressed via the optimization of the instrumen-tation itself, a topic rarely addressed in the literature but crucial toward the reliable identification of biomarkers. We investigated the different GC-MS parameters found to have the largest impact on data quality and employed D-optimal design to pare down the search space to a feasible number of experiments. These parameters were then optimized via response surface estimation to ensure maximum reproducibility and sensitivity of the entire metabolite mixture. The results from this optimization constitute a significant improvement upon existing methods in the literature.
Next, methods were developed for the bioinformatics analysis of raw GC-MS data. Current techniques for metabolite tracking are non-systematic and typically require the laborious use of reference libraries. We developed a method to track conserved metabolites across GC-MS replicates and conditions with the optional use of refer-ence libraries and validated it an E. coli dataset and the differential detection of metabolites in a spiked mixture. In addition, we investigated the best methods for the imputation of missing data as applied to three different metabolomics datasets; to this date, missing data imputation has not been comprehensively addressed in the metabolomics literature, and many methods currently used are needlessly inaccurate. After investigating eight different imputation methods via three deletion methods, it was concluded that k-nearest neighbor algorithms were the best and most accurate method for data imputation.
Finally, the instrumental parameter optimization and metabolite tracking meth-ods were applied to the problem of predicting patient mortality in end-stage renal disease (ESRD). Although ESRD is a complex and well-studied disease, known risk factors only account for 50% of patient deaths, and prediction accuracies for the dis-ease remain relatively low; in addition, mortality rates in the first 90 days of dialysis treatment are double that after 90 days. We sought to investigate whether the ad-dition of metabolomic information would result in increased accuracy of mortality prediction. One hundred twenty patient samples were obtained from a national dial-ysis study (equally representing death and survival within 90 days of starting dialdial-ysis) and analyzed according to our protocol. Two feature selection algorithms were ap-plied to identify significant metabolites distinguishing death and survival, and the corresponding models resulted in improved receiver-operating characteristic (ROC) curve areas of 0.85 and 0.93. This result constitutes a significant improvement from existing clinical models, which at best result in ROC curve areas of 0.80. Based on this work, we hypothesize that our observed differential fatty acid concentrations are indicative of impaired fatty acid oxidation, leading to insulin resistance in ESRD patients (regardless of Type II diabetes status) and eventually, patient mortality.
Thesis Supervisor: Gregory N. Stephanopoulos
Acknowledgments
I would first like to thank my advisor, Greg Stephanopoulos, for his support and guidance. In addition, I would like to thank Joanne Kelleher and my thesis committee members (Daniel Wang, Steven Tannenbaum, and Steve Carr), for their valuable input and suggestions in shaping this work. In addition, on the professional side, I would like to thank: Mark Styczynski and Michael Adsetts Edberg Hansen for their friendship and collaboration- without them, much of this work would not have been possible; Joel Moxley for introducing me to the wonderful world of metabolomics; finally, the entire GS group (members past and present)- they were not only fun in the lab but also made me a better scientist.
On a personal side: my family for encouraging me and supporting me through the years; Liubo Borissov for his advice, patience and love; finally, my friends for sharing this experience with me- I couldn't have done it without you.
Contents
1 Introduction
1.1 M otivation . . . . 1.2 Thesis objectives ...
1.3 Thesis structure ... . . 2 Background and related work
2.1 The nature of metabolic data . . . . 2.1.1 The number of metabolites in the 'metabolome' 2.1.2 Internal v. external metabolites . . . . 2.2 Metabolomics methods . . . . 2.2.1 Experimental preparation . . . . 2.2.2 Instrumental analysis . . . . 2.2.3 Data processing ...
2.2.4 Data characterization, hypothesis testing, feature model construction . . . . 2.3 Achievements in metabolomics . . . . 2.4 Metabolomics and End-Stage Renal Disease (ESRD)
2.4.1 Introduction to ESRD . . . . 2.4.2 Current mortality rates ...
2.4.3 Metabolite markers in renal disease . . . .
19 19 23 23 25 25 26 27 28 30 36 36 selection, and
3 Optimization of GC-MS instrumental analysis
3.2 Introduction . . ... .... .. ... . ... . ... ... .... . 62 3.3 Experimental procedure ... 63 3.3.1 Design of experiments ... 63 3.3.2 GC-MS sample preparation ... 64 3.3.3 Instrumental analysis ... 66 3.4 Results ... . .. . ... ... ... . .. 66
3.5 Estimation of optimal GC-MS parameters . ... 69
3.5.1 Description of response surface estimation . ... 69
3.5.2 Results: five tracked metabolites . ... 72
3.6 Discussion of improved metabolite reproducibility and quantification. 75 4 Systematic tracking of conserved metabolites from GC-MS outputs 79 4.1 O verview . . . . 79
4.2 Introduction . . ... ... ... . .. .. ... ... .. ... 80
4.2.1 Tracking unidentified peaks in metabolite mixtures ... 80
4.3 SpectConnect as a new method for tracking conserved metabolites . 83 4.3.1 SpectConnect algorithm and computational description . . . . 85
4.4 M ethods . . . .. . . . .. . 87
4.4.1 Preparation and analysis of supplemented and control standard m ixtures . . . 87
4.4.2 Preparation and analysis of E. coli strains . ... 90
4.4.3 GC-M S analysis ... 91
4.4.4 Data deconvolution and processing using AMDIS ... 91
4.4.5 Statistical methods ... 92
4.5 R esults . . . .. .. . 93
4.5.1 Mixtures of known components . ... 93
4.5.2 Biological samples ... 97
4.6 Discussion ... . ... . .... ... . ... . 98
5 Additional statistical strategies for data processing and missing data
5.1 O verview . . . . . . . ... 105
5.2 Introduction . .. .. ... ... ... .. ... . .. .. . ... . ... 106
5.3 Application of novel methods for missing data imputation ... 108
5.4 R esults . . . .. 111
5.4.1 Single value deletions ... 111
5.4.2 Uniform deletions ... 113
5.4.3 Nonuniform deletions ... 117
5.4.4 Optimization of the k-nearest neighbor method ... ... 117
5.5 Discussion and evaluation of the contribution of the imputation/modeling w ork . . . .. . 130
6 Application of the metabolomics pipeline to mortality prediction in end-stage renal disease (ESRD)
6.1 O verview . . . . 6.2 Introduction . . . .. . . . . 6.3 Experimental procedure ...
6.3.1 Sample procurement and description . . . . 6.3.2 Sample preparation and instrumental analysis . . . .
6.3.3 Data processing, deconvolution, and missing value im 6.4 Statistical analysis strategies . . . .
6.4.1 Feature selection ...
6.4.2 Sample discrimination . . . . 6.4.3 Model construction: optimal model complexity and m etabolites . . . .. . . . . putation 133 133 134 136 136 137 139 140 140 151 selected 6.5 R esults . . . . 6.5.1 Model performance: Receiver-operating characteristic (ROC)
curves . . . . 6.5.2 Model performance ...
6.6 Experimental validation ... ... 6.6.1 Confirmation of metabolite identities . . . .
156 157 157 160 163 163
6.7 D iscussion . . . .
7 Conclusions and recommendations 171
7.1 Conclusions . . . 171
7.2 Recommendations for future work . ... . 174
A ESRD patient descriptions and clinical metadata 177 B Supplementary ESRD information 269
B.1 Metabolite validation ... 269
B.2 Statistical power calculation ... ... . 274 B.2.1 Calculation of distribution parameters and check on assumptions274 B.2.2 Power calculation and sample size determination ... . 275 164
List of Figures
1-1 A selection of current disease biomarkers of varying complexity . ... 20 1-2 Interaction of the different 'omes' within a cell. . ... 22
2-1 Illustration of metabolite compartmentalization in terms of set theory 28 2-2 Plasma as a pooled average of change across different cells and tissues 29
2-3 A typical metabolomic workflow, with contributions from this thesis
added. ... ... 31 2-4 Schematic of the trimethylsilyl derivatization of ribitol . ... 33 2-5 Functional group and compound coverage by silylation derivatization 34 2-6 Abundance of derivatized metabolites with derivatization time . . .. 35 2-7 Gas chromatography-mass spectrometry allows for the separation and
identification of metabolites in complex mixtures . ... 37 2-8 Automated mass spectral deconvolution and identification system
soft-ware (AMDIS) aids in the deconvolution and identification of metabo-lites from raw GC-MS data ... 40 2-9 Illustration of the difference between good and bad metabolite predictors 46 2-10 The number of individuals in the United States initiating treatment
for end-stage renal disease according to cause of disease. . ... 54 2-11 Total ESRD patients in the United States . ... 55 2-12 Age breakdown of ESRD patients in the United States as compared to
that of the total population ... 56 2-13 End-stage renal disease mortality rates and causes of death ... 57
3-2 Response surface estimation of optimal parameters based on the mini-mization of the coefficients of variation (maximini-mization of reproducibil-ity) of five tracked metabolites. ...
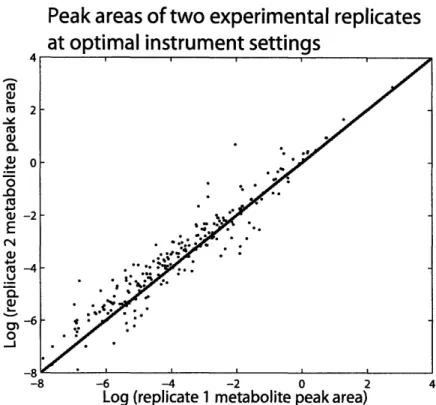
3-3 Reproducibility of experimental replicates at optimal instrumental set-tin gs . . . .
4-1 Illustration of SpectConnect: the composition of a typical GC-MS metabolomic sample motivates the need to systematically track the biomarker components not found in a library of standards . . . . . .
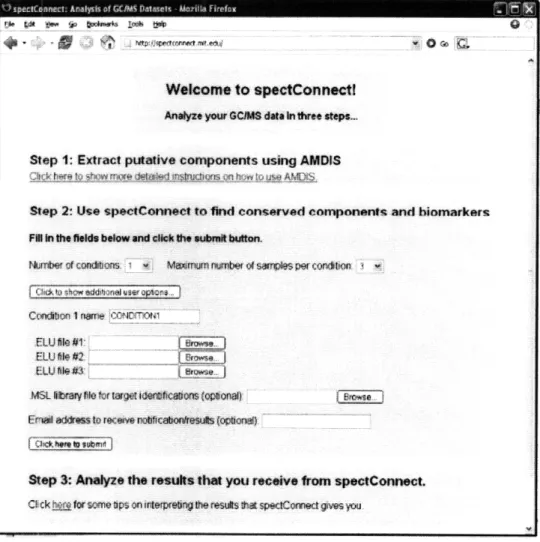
4-2 Illustration of SpectConnect as a freely available as an application on the w eb . . . . 4-3 Illustration of the .ELU file input information sent to SpectConnect . 4-4 Comparing conditions using a global SpectConnect library helps
iden-tify more biomarker candidates. ...
4-5 Including all conserved components in a PCA analysis better captures biological variation in metabolite profiles of cell physiological states..
73 74 84 88 89 99 100
5-1 Overall experimental methodology for the investigation of best
impu-tation m ethods ... . . . . ... . .... ... ... . ... ... 112
5-2 Results for onebyone deletions of GC-MS data . ... 114
5-3 Results for onebyone deletions for LC reduced data . ... 115
5-4 Results for onebyone deletions for LC nonreduced data ... . 116
5-5 Results for uniform deletions of GC-MS data . ... 118
5-6 Results for uniform deletions for LC reduced data . ... 119
5-7 Results for uniform deletions for LC nonreduced data ... . 120
5-8 Results for nonuniform deletions for GC-MS data . ... 121
5-9 Results for nonuniform deletions for LC reduced data ... . 122
5-10 Results for nonuniform deletions for LC nonreduced data ... . 123
5-11 Results for onebyone deletions for LC nonreduced data ... 126
5-12 Histogram of number of nearest neighbors chosen to result in the lowest error for single value deletions of the LC reduced dataset . . . . 127
5-13 Averaged error results for class 0 onebyone deletions for LC reduced data and fixed number of nearest neighbors . ... 128 5-14 Averaged error results for class 1-4 onebyone deletions for LC reduced
data and fixed number of nearest neighbors . . . ... 129
6-1 Boxplot of death and survival ESRD patients with significant ANOVA m etabolites . . . .. . 142 6-2 Visual illustration of the custom feature selection algorithm .... . 148 6-3 Sample output from the custom feature selection algorithm ... 149 6-4 Final output from the custom feature selection algorithm: metabolites
chosen for the model after ten iterations. . ... 150 6-5 Principal Components Analysis of top 20 discriminating metabolites
as determined by ANOVA ... 152 6-6 Principal Components Analysis of the custom feature selection
algo-rithm (top seven model metabolites) . ... 153 6-7 PLS-DA of top 20 discriminating metabolites as determined by ANOVA154
6-8 PLS-DA of the top seven metabolites as determined by the custom feature selection algorithm ... 155 6-9 Optimal ANOVA model complexity as determined by cross validation
on a logistic regression model ... ... 157 6-10 Boxplot of custom algorithm model parameters after leave n-out cross
validation . . . .. . 158 6-11 ROC curve of top 15 discriminating metabolites as determined by
ANOVA .. . . . .. . . . .. .. . . . .. . 159 6-12 Histogram of predicted death v. survival in custom algorithm logistic
regression m odel ... 161 6-13 Validation of the custom algorithm regression model for predicting
death and survival. ... ... 162 6-14 Validation of putatively identified lysine in plasma . ... 165 6-15 Chemical structure of TMS-derivatized f-hydroxybutyrate. ... 166
B-1 Validation of putatively identified lysine in plasma . ... 270 B-2 Validation of putatively identified 3-hydroxybutyrate in plasma . . . . 271 B-3 Validation of putatively identified adipic acid in plasma ... 272 B-4 Validation of putatively identified 2-hydroxybutyrate in plasma . . . . 273 B-5 Test for normality of data for statistical power calculation ... 276 B-6 Test of fit of inverse gamma distribution parameters ... 277 B-7 Statistical power versus sample size . ... . . . . 278
List of Tables
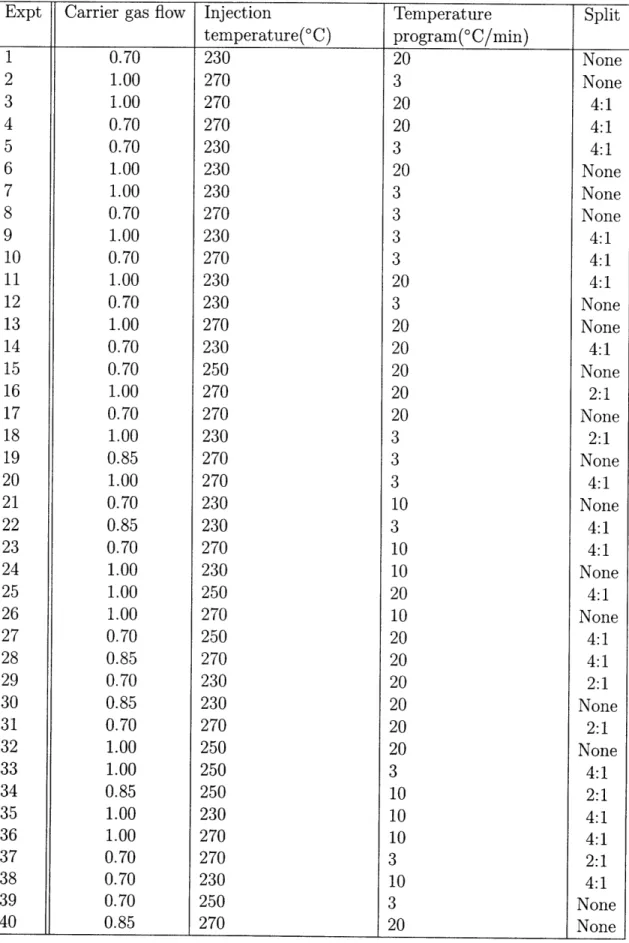
2.1 Predictions and actual outcomes in binary classification ... 47 2.2 Measures of model predictive power . ... . . . 49 3.1 Design of experiments for optimization of GC-MS instrument settings. 65 3.2 Reproducibility of five tracked metabolites and average number of
AMDIS components from each GC-MS parameter experiment . . .. 68 3.3 Reproducibility of five tracked metabolites and average number of
AMDIS components at optimal GC-MS settings . ... 74
4.1 Usage and cataloging of metabolomics peaks in GC-MS studies . ... 82 4.2 SpectConnect can identify metabolites in a known mixture and
differ-ential metabolites in a spiked mixture. . ... 95 4.3 SpectConnect's parameters on the number and type of conserved peaks
that it finds .. . . . . 96
6.1 Mortality biomarkers for patients with end-stage renal disease . . . . 135 6.2 General ESRD study characteristics . ... 138 6.3 Table of most significant metabolites ranked according to p-value, by
ANOVA... . 143 6.4 Incremental ROC of customized feature selection algorithm ... 160
A.1 Patient description for N = 120 ESRD study:outcome, age, sex, race, B M I . . . 178 A.2 Patient description for N = 120 ESRD study: ESRD diagnosis and
A.3 Patient description for N = 120 ESRD study: patient number, date of admission, date of first dialysis, initiation flag, facility ID, facility statistic, and facility location. ... 188 A.4 Patient description for N = 120 ESRD study:date of death, cause of
death diagnosis code using ICD9 coding standard, death diagnosis de-scription, and death vintage... .. 193 A.5 Patient description for N = 120 ESRD study: blood pressure, albumin,
and alkaline lab values ... 199 A.6 Patient description for N = 120 ESRD study: Hepatitis C, bicarbonate,
calcium, and cholesterol ... 204 A.7 Patient description for N = 120 ESRD study: creatinine, EKT/V,
ferratin, and glucose ... 209 A.8 Patient description for N = 120 ESRD study: hemoglobin,
homocys-teine, potassium, sodium, phosphorus, and platelets . ... 214 A.9 Patient description for N = 120 ESRD study: pth, retic hgb(chr), trans
sat, URR, and white blood cells... .. 219 A.10 Patient description for N = 120 ESRD study: IV vitamin D,
Cal-citriol/Calcijex, and Hectorol dosage . ... 224 A.11 Patient description for N = 120 ESRD study: Zemplar, Epogen,
Fer-rlicit, Infed, and Venofer ... 229 A.12 Patient description for N = 120 ESRD study: oral vitamin D
prescrip-tion and dosage ... 234 A.13 Patient description for N = 120 ESRD study: Sensipar/Cinacalcet and
vascular access .. . . .. . .. ... .... .. . ... . ... .. 239 A.14 Patient description for N = 120 ESRD study: vitamin D 25 and 125,
vitamin D binding protein, and BMA and non BMA transfer. ... 244 A.15 Patient description for N = 120 ESRD study: temporary absence,
dialysis withdrawal, kidney function recovery . ... 249 A. 16 Patient description for N = 120 ESRD study: kidney function recovery
A.17 Patient description for N = 120 ESRD study: phosphate binder infor-m ation . . . 259 A.18 Patient description for N = 120 ESRD study: ProBNP and troponin 264
Chapter 1
Introduction
1.1
Motivation
Traditional, 'bottom up' biological experiments are based on a general a priori work-ing knowledge of cellular function. Hypotheses of biological behavior, mechanism, or effect are made prior to experimental observation. The resulting investigation, designed to test these hypotheses, generally consists of targeted approaches designed to test a single variable, typically a single gene or protein. Following the conduction of the experiment, the data are analyzed and used to add to the existing knowledge base, and the cycle repeats.
In contrast, systems approaches to biology have followed a very simple premise: a
system is more than the sum of its parts. Systems biology takes a global, 'top down'
approach to elucidating complex behaviors not otherwise adequately explained by targeted experiments [67, 93]. This approach differs from the convention in that the hypothesis is often formed during the process of experimentation. First, a pertur-bation causes change in the complex and interactive network of cellular machinery. Next, large amounts of data are generated and analyzed in response to the pertur-bation. Finally, these data are used to iteratively shape a hypothesis and provide insight into cellular mechanism, leading to the conduction of more experiments and additional perturbations. The experiments are not driven from single hypotheses nor targeted approaches, and they instead incorporate large amounts of data to generate
hypotheses of the systems-level response.
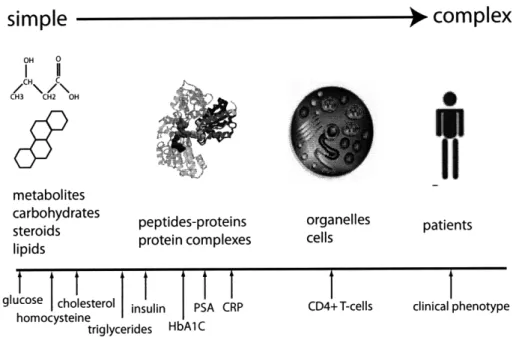
The "central dogma" of biology states that DNA is transcribed into RNA, and RNA is translated into protein. Comprehensive characterization of these steps has led to characterization of both gene expression (transcriptomics) and protein expression (proteomics). The ability to analyze large amounts of data from high-throughput experiments has progressed hand-in-hand with significant advances in computing and the rise of bioinformatics. Accompanied by advances in chemometrics, this has en-abled, within a variety of disease contexts, the identification of biomarkers, or indica-tors which mark differences in disease populations or mark responses to therapeutic effects. Figure 1-1 gives several examples of biomarkers, of varying biological com-plexity, currently used in biology and medicine.
simple
)
complex
OH 0 SI I /C" CH3 CH2 OH9
metabolitescarbohydrates peptides-proteins organelles patients steroids protein complexes cells
lipids
glucose cholesterol insulin PSA CRP CD4+T-cells clinical phenotype
homocysteine
triglycerides HbA1C
Figure 1-1: A selection of current disease biomarkers of varying complexity. Biomark-ers range from low molecular weight molecules (metabolites) to larger molecules such as proteins. Metabolite biomarkers include cholesterol and glucose, used to monitor heart disease risk and diabetes. Protein biomarkers include HDL/LDL and glycated hemoglobin (HbAlc), also for heart disease risk and diabetes. Her2 and CD4 T-cells are cell biomarkers for breast cancer and HIV infection, respectively. Adapted from Zhou, et al [217]
al-ways provide a realistic picture describing change. Prediction based solely on genetic markers is often inaccurate, as phenotypes are also influenced by environmental fac-tors; in addition, upregulated mRNA can be deceiving, as many genes are regulated post-transcriptionally. Protein levels can be affected by protein inactivity and re-sponsiveness to external change. Finally, transcripts and proteins often operate on different time-scales, and drawing conclusions about the relationship between them is often not intuitive.
As such, recent attention has turned to third level of cellular function: metabolites. Metabolomics, the comprehensive measurement of the low molecular weight molecules in cells, and fluxomics, the comprehensive measurement of metabolic fluxes, have the potential of filling in some of the informational gaps left from transcriptomics and proteomics. The metabolome, first described by Oliver et al [134], is defined as the
quantitative complement of all the low molecular weight molecules present in cells in a particular physiological or developmental state. The goal of metabolomics is to
measure and profile the relative or absolute concentrations of as many metabolites as possible, so as to capture as accurate a picture as possible of the biological question at hand.
Metabolites represent both the reactants and products of metabolic networks, and quantification of their concentrations offers direct insight into the kinetics and regu-lation of internal metabolism. In addition, because they constitute the most "down-stream" result of gene expression, it is expected that changes in the metabolome are more amplified as compared to the transcriptome and the proteome [122, 196]. Another advantage is that small metabolites are impacted by (genetic or environ-mental) changes faster and, as such, allow monitoring of metabolic processes on a much shorter time scale than proteins or transcripts [178, 48]. Metabolites carry a consistent structure across all species, enabling cross-species platforms for the tech-nology. Finally, metabolite measurements are more amenable to medical diagnosis applications as they typically represent noninvasive analyses on easily accessible bod-ily fluids. Therefore, the study of the metabolome at different physiological states provides useful information at the functional level, which completes and complements
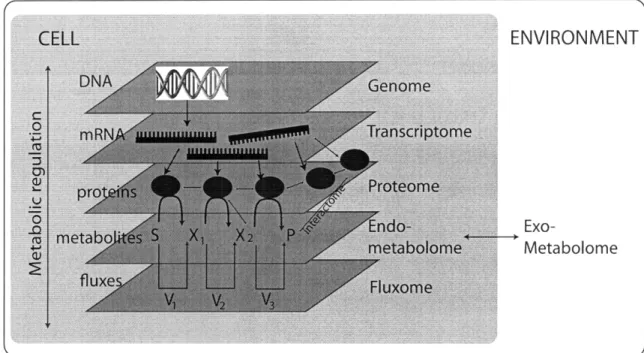
the data provided by the transcriptome and the proteome. This additional cellular dimension enables better inference of macromolecular interactions, correlation of phe-notypic changes based on metabolic relationships, and construction of models which can provide quantitative insights of dynamic biological behavior. A figure of the interactions of the different -omes is given in Figure 1-2.
Figure 1-2: Interaction of the different '-omes' within a cell. Each -ome experiences a series of complex interactions with the other omes (increasing from the top of the figure to the bottom). Interaction with the environment is primarily through the metabolome. Adapted from Nielsen, et al [123]
Metabolomics allows for the rapid characterization of many metabolites of dif-fering chemical structure. These metabolites are identified and quantified in order to provide a metabolic profile similar the transcriptional profile obtained on a DNA microarray. High-throughput, reproducible measurements are necessary due to high sample variability and chemical reactivity in sample preparation. Statistically signif-icantly different metabolic profiles are attributed to different disease states, and an "abnormal" metabolic fingerprint can be used as an indicator of disease or an altered state. The work presented in this thesis shall be taken as an attempt to develop a methodological pipeline for the reproducible and significant analysis of metabolomics
22
ENVIRONMENT
data.
1.2
Thesis objectives
The objective of this thesis is the development of a metabolomics pipeline for the analysis of blood plasma and is detailed as follows:
1. Optimize an experimental method for measuring metabolites in gas chromatography-mass spectrometry Obtaining high-throughput,
compre-hensive, and reproducible data is central toward metabolomics analysis and achieving correct biological conclusions. GC-MS instrumentation has been shown to be both highly reproducible and sensitive for targeted analyses, but to date has not been fully optimized for complex metabolomics mixtures with respect to data quality and reproducibility.
2. Develop bioinformatics tools for raw data analysis. The complexity and richness of metabolomics data necessitates unprecedented bioinformatics tools for analysis. These tools comprise three major functions: 1) a method to com-prehensively track conserved metabolites in sample replicates, 2) impute missing data and process raw data, and 3) identify biomarkers which discriminate be-tween different sample types using a variety of supervised and unsupervised techniques.
3. Apply the above methods to a novel metabolomics problem. The
application chosen in this thesis is that of modeling disease mortality in end-stage renal disease (ESRD).
1.3
Thesis structure
The structure of this thesis roughly follows that of a typical metabolomics experiment. Through the course of this work, the pipeline has been broken up in the following way:
Chapter 2 gives background, related work, and previous approaches for metabolomic analyses. Chapter 3 describes the instrumental and experimental protocol used in the experiments. Optimization of GC-MS settings is performed via D-optimal design to reduce the number of experiments to a feasible number. Response Surface Estimation is then used to estimate the optimal instrumental parameters. Chapter 4 describes a method developed to track conserved peaks in raw GC-MS data following data de-convolution. This method and software tracks conserved metabolites without the use of reference libraries and has been validated. Chapter 5 describes the evaluation of several different methods for imputation of missing data in GC-MS datasets. Meth-ods investigated include those widely used in the metabolomics literature as well as some bioinformatics methods adopted from the microarray literature. These methods are applied and tested in Chapter 6 in the problem of predicting patient mortality in end-stage renal disease (ESRD), and methods include both unsupervised and super-vised analysis strategies. Finally, Chapter 7 offers conclusions and recommendations for future work.
Chapter 2
Background and related work
There are currently three main thrusts of metabolomics research. The first goal is metabolic profiling, or the identification and quantification of metabolite concentra-tions as completely as possible for a given phenotype [44, 52, 57]. The second goal is biomarker discovery, proceeding through the use of an array of computational and statistical methods for data analysis in order to identify biomarker metabolites. These biomarkers discriminate between sample conditions or sample types by being absent, present, or differentially present; besides the insights into functional mechanisms, biomarkers also provide means for diagnosing and treating medical conditions at the clinical level (to facilitate biomarker optimization, large numbers of well-characterized samples and carefully planned experiments are often necessary). The third goal of metabolomics research is in the integration of metabolomic data with other com-prehensive cell-wide data with the goal of elucidating metabolite-to-gene networks. This may result in the addition of "systems-level," functional genomics information, elucidating the role and location of silent genes.
2.1
The nature of metabolic data
Cellular function relies on a complex network of metabolite reactants, products, and intermediaries. Metabolic data is increasingly being used to provide information relating to the biochemical status within a cell; metabolite concentration and flux data
can be viewed as complementary to transcriptomic and proteomic results. Following a perturbation, metabolic data is often highly correlated in its responses; levels of metabolites not necessarily near each other in metabolic pathways rise and fall in patterns quite unlike the observed changes in proteomics and transcriptomics. While these interdependencies present a unique challenge to data analysis, they also offer the ability to glean insight otherwise not available from other types of high-throughput data.
2.1.1
The number of metabolites in the 'metabolome'
Certain aspects of metabolomics suggest that whole-organism metabolic profiling is possible: the number of metabolites present in most organisms is significantly fewer than the number of genes or proteins, and the cost of measuring these metabolites is by comparison significantly lower (a notable exception to this is in the plant kingdom, where it has been estimated that as many as 200,000 different metabolites exist [42]). For example, the yeast genome consists of roughly 6,600 known genes [113], whereas only 600 metabolites comprise the known yeast metabolome [48]. Similarly, the Kyoto Encyclopedia of Genes and Genomes (KEGG) contains roughly a million genes [82], but only 13,000 metabolites. In humans, the metabolome is estimated to be between 2000-3000 metabolites, of which approximately 2500 have been identified, quantified, and stored into central databases [211].
However, comprehensive metabolite coverage is still a significant obstacle, as no instrumental technique measures all metabolites due to their wide range of metabolite chemical diversity. Unlike DNA or proteins, metabolites do not adhere to a subunit-based chemistry, and assaying for many metabolites with many different chemistries simultaneously is difficult; no instrumental technique measures all metabolites, and oftentimes (as is the case in GC-MS), metabolites must also be modified in or-der to be measured. However, relatively speaking, it still remains somewhat more tractable than the genome (35,000 genes) and the proteome (estimated between
2.1.2
Internal v. external metabolites
Primary metabolism functions to biochemically convert substrates into energy and maintain cellular function. Metabolism is typically divided into catabolic path-ways and anabolic pathpath-ways. However, it is more convenient within the context of metabolomics to divide metabolites into two different categories: internal metabo-lites and external metabometabo-lites. Metabolomics sample preparation procedures often differ depending on the type of metabolites being measured.
Internal metabolites refer to metabolites contained within cell walls and which serve to regulate metabolic fluxes by modulation of enzymatic activity through re-versible covalent modification and allosteric effects [27]. Typical examples of these metabolites include sugar phosphates and adenylates. In addition, these metabolites often participate in signal transduction pathways, interacting with proteins post-transcriptionally and leading to tightly regulated changes in gene expression [11]. These metabolites are often measured through specialized techniques, and measuring these metabolites can be challenging due to their chemistry and low concentrations. Within metabolomics, internal metabolites are typically referred to in the context of the "endometabolome," as seen in Figure 1-2.
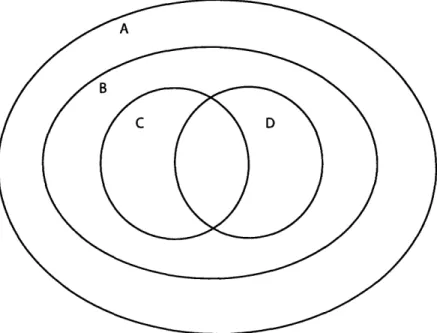
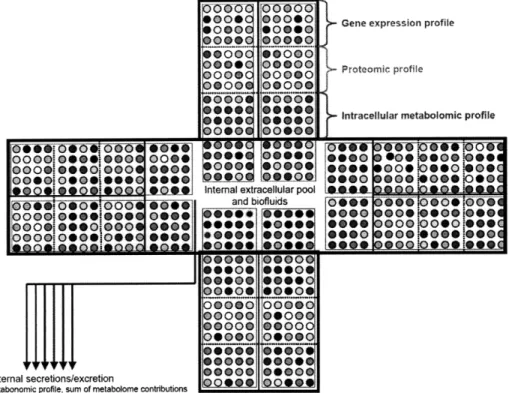
External metabolites are excreted from cells into the secondary environment, such as blood or as with microbials, extracellular fluid. External metabolites serve as ex-ternal signals and signaling mechanisms by which to communicate with other cells and maintain homeostasis. These metabolites participate in metabolite-protein and ligand-receptor interactions and constitute the primary level of environmental infor-mation detected by the cell. These metabolites also include secondary metabolites and can function in other activities, such as controlling cell growth and differentia-tion [56]. Within metabolomics, external metabolites are typically referred to within the context of the "exometabolome," as seen in Figure 1-2. Figure 2-1 illustrates the concept of metabolic compartmentalization in terms of set theory, and Figure 2-2 il-lustrates the exometabolome nature of measuring plasma as a pool of average external metabolite change across cells.
Figure 2-1: Illustration of metabolite compartmentalization in terms of set theory. A represents the set of all metabolites in the human metabolome. B represents the metabolites present in one individual, and C and D represent different tissues within that individual. The intersection of B and C represents those metabolites common to tissues B and C. Reproduced from Beecher [15]
2.2
Metabolomics methods
Advanced analytical techniques vary greatly in sensitivity, information content, and information format. Metabolite fingerprinting methods such as NMR, Raman spec-troscopy, and FT-IR spectroscopy constitute general screening methods used to rapidly classify sample types according to biological relevance or origin [136, 105, 120, 86,
174]. They involve little or no sample preparation and typically involve larger num-bers of measurements. Metabolite profiling methods such as GC-MS, LC-MS, and CE-MS refer to analytical techniques that first employ a separation step (used to separate a complex mixture of metabolites into individual components) followed by a detection/quantification step; these methods provide detailed chromatographic and quantitative analysis of a group of metabolites or those associated with a specific path-way [44, 52, 57, 165]. Other chemical imaging methods such as Fourier-transform infrared spectroscopy (FT-IR), Raman spectroscopy, and nuclear magnetic resonance (NMR) have also been used. The focus of this thesis has been on GC-MS analysis
ID, 0 **0OW9000** 0 0 1 I0*0*i*0 *go0 000-C 0000C*oooc OOOO4C oooec000C seece*000C0000C0004~B0004~s 00-0-00 00000 0000 00000 *0000 00000 00000 00000 @000* 0*0*@ 0000 *0000 000000 o0oo* oo***, oe*** ~ *0*** O FIIAit
Gene expression profile
Proteomic profile
Intracellular metabolomic profile
S g 0 o0go 149D0e
0000 Soeo 09 00 9 0000&*0oeeoo *10%-690% - O Internal extracellular pool
oo** oaoIe 0 and biofluids 0~00
ooo*0000 **** ***
to- e()*In a a s I
External secretions/excretion
Metabonomic profile, sum of metabolome contributions
S0... *000* .... 0000 9*0*n 0) 0 00000 00000 00000 00000 80969 ***** ~ OOOOO ,9W9C 00090~ *0000 00000 .... ****0i *00 *0000*0 ***
*000oe oooeo 0o0***
o*eeo **** *
*** e0e1e*6
0
s sFigure 2-2: Plasma as a pooled average of change across different cells and tissues. Each cell has a characteristic gene expression profile, proteomic profile, intracellular metabolite profile, and extracellular metabolite profile. The metabolites measured in a plasma sample are a pool of average extracellular (or 'exometabolome') change across all cells. Reproduced from Nicholson, et al. [121]
dk* 0* 0" .'
!
00*000 DOOOO 00000 D*** 90000of plasma metabolites, but one should note that the computations and concepts ap-plied to GC-MS here can also be apap-plied to other chromatography-mass spectrometry methods such as LC-MS.
As previously mentioned, unlike the subunit-based chemistries of proteomics and transcriptomics, there are no methods that comprehensively measure all metabolites in the metabolome. All methods have their relative strengths and weaknesses, and as such, there is no one instrumental platform uniformly used in the literature. In addition, there are many other challenges to characterizing the metabolome: 1) not all metabolite synthesis pathways are well characterized despite some end metabolites being easily and reproducibly measured, 2) chemical structures of unknown metabo-lites are sometimes difficult to elucidate, 3) alternate synthesis pathways can convolute analysis and biological conclusions, and 4) metabolic pathways are highly interrelated and extremely complex.
Figure 2-3 shows the general experimental steps involved in a metabolomics ex-periment. Those steps highlighted in gray detail techniques used commonly in the literature. Those steps highlighted in red detail new techniques developed and con-tributed by this thesis that are not yet standardized or commonly used. These steps have either been specifically developed for metabolomics (as in the case of Spect-Connect), or have been adapted from other literature (such as ROC curve analysis). These steps in red will be discussed in the following chapters in larger detail, and this chapter will focus on the more conventional techniques currently used in metabolomics
(highlighted in gray).
2.2.1
Experimental preparation
The top of Figure 2-3 depicts the commonly used workflow for profiling the entire metabolome: quench and extract cellular metabolites [32, 186], separate and purify the metabolites, and identify the metabolites via mass spectrometry [198, 153, 132]. For GC-MS analysis, it is first necessary to chemically modify, or derivatize, metabo-lites to enable gas-phase separation. The metabometabo-lites separated by gas chromatogra-phy are then analyzed in a mass spectrometer, which generates a characteristic mass
_ tlh X -DrD
3
SD3
rD T C3
rD '-I 0) 0) 0) LflFigure 2-3: A typical metabolomic workflow. Generic steps are indicated in dark font, while italicized gray font gives specific examples of those steps. Those steps contributed by the work in this thesis are indicated in red (these steps are not conven-tionally exercised in the metabolomics literature). SpectConnect, outlined in Chapter 4, has little impact on the upstream experimental measurements and is designed to track conserved components in GC-MS extracts that are unlikely to occur purely by chance as artifacts of noise. This data is easily adapted into other standard down-stream methods of visualization and statistical analysis. Other contributions of this thesis include new statistical measures to impute missing data and analyze model results.
cell or biomixture
quenching microbes, plasma, tissue
extraction temperature and reagents
separation GC, LC, CE, GC-GCJEC, PAGE, HPLC
characterization spectra: MS, MS-MS, NMR, IR
putative m tabolites
data deconvoluton, peak alignment / identification
matched from self-matched (conserved):
standard libraries SpectConnect global lib.
1 0's
to 100's
100's to 1000's
components
components
\
/
data processing: normalization, imputation
metabolite means, mediar, knn, hotdeck, BPCA, ILL, LLS, zeros
feature selection/hypothesis testing ANOVA, t-test, custom feature selection algorithm
statistics, visualization, model construction
supervised unsupervised
FDA, PLS-DA, ROC I PCA, clustering, curves,
validation
informatic experimental
~-~---~t~-~-~-/ ~
cross-valialtion standards additional exneriments
spectrum of metabolite fragments.
Metabolite quenching and extraction
Because metabolite turnover is much more rapid as compared to mRNA and proteins, samples must be quenched to ensure fast and reproducible metabolic inactivation (this is particularly important for measuring compounds such as glycolytic intermediates and sugar phosphates). Proper sampling ensures that metabolites are completely ex-tracted, metabolite levels do not chemically or enzymatically change, and metabolites are not destroyed in the process.
In microbial samples, quenching at low temperatures is vital toward ensuring in-stantaneous arrest of metabolic activity and to break cell walls. Typically, quenching is performed by mixing with organic solvents and/or low temperatures; traditional sol-vents used include methanol, perchloric acid, and liquid nitrogen, and temperatures of extraction can be as low as -40oC. Perchloric acid has been shown to degrade metabo-lites sensitive to the high oxidate medium, and is not suitable for global metabolomics due to this high analyte loss. Liquid nitrogen has been shown to puncture cell walls, resulting in the mixing of intracellular and extracellular metabolites. Alternatively, metabolic quenching can also be performed by rapidly changing pH [203, 202] or in boiling ethanol [54].
Once metabolites are quenched, they must be extracted from the sample matrix. Extraction is particularly important when analyzing internal metabolites, as internal metabolites must be separated from pools of external metabolites (in the plasma medium, external metabolites are of little concern). Extraction efficiencies vary due to varying metabolite chemistries, and there is no one method which optimally extracts for all metabolites. Typical extraction conditions are at neutral pH in mixtures of organic compounds, often in tandem with quenching procedures [202]. There is currently no consensus regarding the optimal extraction procedures, several methods have been suggested, such as ultrafiltration [191], acetonitrile [31], and methanol [74], and methanol-chloroform solution [148].
metabo-lites. In plasma, a protein precipitation step typically works in conjunction with an extraction step to separate out plasma metabolites. A difficult balance is struck between throughly and efficiently removing all protein while not pulling out any an-alytes of interest [168]. In addition, it has been speculated that metabolites such as citrate, lysine, and thereonine are bound to plasma proteins [106], and inconsistent removal of protein may lead to inconsistent GC-MS measurement and quantitation.
Metabolite derivatization
Prior to gas chromatographic analysis, non-volatile metabolites (which includes both polar and nonpolar compounds) are derivatized to volatile compounds such that they enter the instrument in the gas phase at the GC-MS inlet temperature. Derivati-zation also helps to improve thermal stability and ioniDerivati-zation efficiency. There are many derivatization methods available, each of which targets metabolites of a spe-cific chemistry and thus limits the set of metabolites that can be analyzed. Silylation is a popular and established derivatization technique, with several libraries available to identify compounds. In addition, TMS derivatives are generally highly volatile, thermally table, and have excellent properties for gas chromatography. Figure 2-4 shows trimethylsilyl derivatization reaction for the case of ribitol; the procedure for this reaction is given in Section 3.3.2.
MSTFA
MC CH
Figure 2-4: Schematic of the trimethylsilyl derivatization of ribitol
TMS derivatization is typically performed via the addition of N-Methyl-N-trifluoroacetamide (MSTFA) or N, O-bis[Trimethylsilyl]trifluoroacetamide (BSTFA), typically in the
presence of the catalyst trimethylchlorosilane (TMCS) and following a methoximation step typically with hydroxyamine hydrochloride dissolved in pyridine. MSTFA+1%TMCS is capable of derivatizing both primary and secondary amides, primary and secondary
amines, carbohydrates, carbonyls, carboxyl groups, and hydroxyl groups. It does not cover thiols, sulfides, or sulfonic acids. A chart of the functional groups (and com-pounds) covered by silylation is shown in Figure 2-5.
It should be noted that multiple derivatizations are possible for some compounds (e.g. amino acids, carbohydrates) because they contain more than one reactive group. Kanani et al [81, 80] found that the desired derivatization products could be selected for while controlling derivatization time. The variation of derivatization products with time for a selected group of metabolites is shown in Figure 2-6.
Functional group Compound class
amides
0II
R-C-NH2 Ramines
H R - C-NH2 R H O Hi
I
-C-N-R H H -C -N- R H barbituates, benzodiazepines imides, proteinsalkaloids, amino acids amino sugars, amphetamines
biogenic catecholamines, carbamates, hydroxyl amines
nitrosamines, nucleostides nucleotides, urea carbohydrates (CH20H)n carbonyls carboxyls hydroxyls nitriles >C=O starches, sugars
acid halides, acid anhydrides,
aldehydes, enols, esters, ketones, hydrazones, oximes, phenoxy acids, steroids (hydroxy/keto hormones) amino acids, cannabinols, carboxylic acids, glycerides, hydroxy acids, lipids/ phospholipids, prostaglandins, steroids (bile, hydroxy/keto
hormones)
alcohols, alkaloids, cannabinoids, glycols, phenols
0
R - C-OH
ROH
R-C-N
Category -1 and 2 Metabolites -c- raW TMS -r b 5ritlUB Glycerol 3TMS bt sorbTMS t. onate TMS Sft-uc-me mox2 TMS . -o-ctrate TMS I- Fusrte TMS - glucose MeOXI1 TMS .2 0 OW g9)C 0 E 0 .A-am 4.0 30 S 100 200 300 400 500
Time After Addition of MSTFA (minutes) Category 3 Metaboll s
.OIMS glycie NO i -O-hanoi3wm,NN,O-TMS
,N.ONU-TM -asportae.N.O.O-TMS i -gutwiokAcid 3TMS
n..N.UIOIMS - hmoacystina, N,NO-TMS -- spar e N.N,,O-TMS
, ,O-N.TM . +.-- glukamireN,O-TMS
I
Time After Addition of MSTFA (minutes)
Figure 2-6: Abundance of derivatized metabolites with derivatization time, from Kanani et al [80]. A) Category 1 and 2 metabolites indicate that derivatization may continue after the typical 90 minute mark for MSTFA derivatization. B) Category 3 metabolites clearly still undergo changes after 90 minutes, and metabolites should be derivatized for at least 350 minutes to ensure complete derivatization.
(B) E 0 . 0 0 o I x I ~~-~~~~--- ----i ------- ---~ _ . .s---_--:::::-:: : ~ ~..~
2.2.2
Instrumental analysis
In GC-MS, the gas chromatography column separates the derivatized mixture of metabolites based on component volatility, polarity, and molecular weight. Compo-nents elute from the column at characteristic times based on component chemistry interactions with the column stationary phase. These separated compounds then en-ter the mass spectromeen-ter, where they are then bombarded with ions; the resultant fragmentation of the compound creates a signature mass spectral pattern that is later used to identify the compound. A characteristic mass spectral pattern is created for every point in time, or instrument 'scan,' of the raw data file, and the sum of the total number of ions is reflected in the Total Ion Count (TIC) of the chromatogram. Figure 2-7 illustrates this point, showing the TIC versus time for a raw data file. The bottom of Figure 2-7 shows a representative mass spectra for a given peak in the chromatogram.
GC-MS is a popular, sensitive and reproducible method for metabolomics analy-sis, yet it has many drawbacks. It is limited in its inability to measure high-molecular weight metabolites (e.g. higher molecular weights than tri- to tetra-saccharides, or-ganic diphosphates, or co-factors). In addition, identification of unknown compounds not found in conventional mass spectral libraries is very difficult and must often be combined with other analyses such as accurate-mass techniques (JEOL), collision-induced decomposition [72] or MS-MS methods [171]. Oftentimes this mass spectral information is used in conjunction with small molecule databases, such as PubChem, KEGG, and CAS Scifinder. It is estimated that currently, less than 30-40% of de-tected spectra can be linked to known metabolites [40]. In Chapter 3 of this thesis, we investigate the optimal GC-MS instrumental parameters for anaysis of complex metabolomics mixtures.
2.2.3
Data processing
Discussion on the optimization and best practices in data processing has been rather limited in the literature, but a variety of methods have been developed to aid the
Figure 2-7: Gas chromatography-mass spectrometry allows for the separation and identification of metabolites in complex mixtures. By first separating metabolites in the gas chromatogram and then allowing these metabolites to undergo mass spectral fragmentation, the result of GC-MS analysis allows for the identification and relative quantification of metabolomics mixtures.
metabolomics researcher in data analysis. According to the metabolomics literature, four major steps must typically be performed during data processing: 1) detection of peaks, 2) correction of mass and retention time shifts, and 3) normalization of peaks, and 4) construction of component lists [189].
For the sake of this thesis, we have expanded upon these processing steps and rearranged them as the following: 1) data deconvolution (which encompasses peak detection and shift corrections) and 2) peak alignment, 3) normalization and trans-formation, and 4) imputation of missing values. The contributions of this thesis to these steps are given in Chapter 4 with respect to peak alignment and Chapter 5 with respect to data transformation and imputation of missing values.
Data deconvolution and filtering
In targeted GC-MS analysis, in which the concentrations of select specific compounds are desired, only certain regions of the chromatogram or certain m/z values of mass spectra may be considered relevant. For non-targeted metabolomic analyses, on the other hand, the entire chromatogram (for all m/z values) is important, prompting efforts to select experimental parameters that maximize metabolite peak accessibility [132]. However, accurate analysis of all of this data presents some challenges. Some "true" chromatographic peaks may be hard to distinguish from noise. Other peaks may contain mixtures of metabolites that coelute, so the individual MS scans of their peaks are not pure spectra of either component.
Thus, the immediate processing steps after the storage of raw GC-MS data typi-cally include peak enumeration, or distinguishing"true" peaks from noise in a chro-matogram, and spectral deconvolution, or the filtering of putative pure spectra from two overlapping peaks. These steps may be performed either with proprietary soft-ware for a specific manufacturer's apparatus or with publicly available softsoft-ware such as AMDIS [175]. Putative pure spectra are separated from overlapping peaks, noise is reduced, and baseline shifts and machine drift are addressed; these measure work to reduce the amount of noise present in each sample and to provide an accurate quan-tification of individual peak areas. Whether or not spectral deconvolution is applied,
the user is left with a set of chromatographic peaks that putatively represent individ-ual components in the sample mixture. Oftentimes, multiple experimental conditions have been assayed and all of the results need to be analyzed and compared.
For our purposes, we have used AMDIS (automated mass spectral deconvolution and identification system) for deconvolution of raw GC-MS data [175]. A screenshot of an AMDIS analysis is given in Figure 2-8. AMDIS was originally developed by the National Institute of Standards and Technology (NIST) as a freely available tool to aid in the targeted analysis and deconvolution of GC-MS data. The advantages of using AMDIS includes its ability to sync with variety of instrumental platforms, some user control over deconvolution settings, and the ability of the user to create custom libraries for future targeted analysis in GC-MS samples. Some disadvantages to AMDIS involve its oversensitivity; oftentimes, it creates multiple target spectra and multiple models for single metabolite, leading to difficulties in interpreting results from complex spectra. These issues are further explored in Chapter 7.
Data peak alignment and identification
It is in the following steps that methods for metabolomic experimental data anal-ysis are rather scattered. Few tools are available for easy comparisons of multiple experimental conditions; ChromaTOF (LECO, St. Joseph, MI, USA) is a representa-tive example of some of the better proprietary software for performing this analysis. However, ChromaTOF can only be used with LECO mass spectrometers, so such a program is not useful for many scientists. Similar problems arise with other man-ufacturers' software packages; many are inadequate for whole-dataset analysis, and analysts typically do not have the luxury of buying new equipment strictly for its superior software. Alternatively, there are other proprietary programs available that work for a variety of manufacturers' hardware, such as MetAlign (Plant Research International, Wageningen, Netherlands). However, such programs are typically ex-pensive and not uniformly used in the scientific literature. There are a few freely available packages that can perform some of this data analysis, such as mzMine [84] and SpecAlign [213], though these newer tools also have yet to see widespread testing
Figure 2-8: Automated mass spectral deconvolution and identification system soft-ware (AMDIS) aids in the deconvolution and identification of metabolites from raw GC-MS data using a variety of data formats. The top of the figure shows the GC-MS chromatogram with the total ion count (TIC) being tracked over time. The middle windows show the tracking of the top three ions for a given point in time, along with a list of potential library matches for the mass spectra in the raw data file. Finally, at below, the mass spectra for a given point in time is compared to that of a library match.
in scientific literature. Rather, a much more common approach is to compare the spectra from a given run to a reference library of spectra so that metabolite peaks may be tracked by names.
Following spectral alignment, spectra are typically compared to a reference li-brary of spectra to determine the identity of present metabolites. The scope of most automated data analysis techniques is limited to those compounds which have been isolated, purified, and had their spectra stored in the reference library; if a data spec-trum can not be found in a library, it is typically discarded. Even the largest pub-licly available libraries [12, 43, 124] are often incomplete, leaving many metabolites unidentifiable without additional experimental work [44]. These libraries, despite their size and more than 350,000 entries, contain mostly non-biological compounds, often omit chromatographic behavior, and commonly misidentify spectral peaks (e.g. NIST, Wiley, and Sigma-Aldrich libraries). For this reason, many researchers have created customized reference libraries using standard reagents [94, 163, 41, 211]; how-ever, this is prohibitively labor-intensive and the resulting library will necessarily be incomplete because many compounds of interest are not commercially available- for example, only 200 of the 600 known yeast metabolites can be purchased [37]. Since most techniques are library-dependent, and the creation of truly complete libraries is so difficult, a large amount of valuable information for biomarker identification or cell analysis is subsequently lost; in plants, it is estimated that up to 70% of peaks in a typical GC-MS spectra are unidentified [18]. In Chapter 4, we present a method for tracking conserved metabolites in metabolomics samples with the optional use of reference libraries.
Data normalization and transformation
Data are typically normalized with respect to internal standards injected into the biomixture medium at the start of experimental preparation. In contrast to microar-ray normalization, in which data is normalized according to some total florescence from the array, multiple internal standards are often used to compensate for the dif-ferent chemistries present in metabolomics mixtures [74], as this has also traditionally
been done in targeted analyses. Ribitol is and has been a common internal standard used in metabolomics experiments [46, 80]. Some evidence has been stated that the use of multiple internal standards does not have a significant improvement upon the reproducibility of the GC-MS data [216], and the use of both multiple and single internal standards is still commonly practiced.
Data transformation is well-documented as a distinct component of proper data normalization in the microarray literature. Here, data are first taken as a ratio between a query and a reference sample, and then that ratio is log2-transformed
[139]. The reasoning behind this log2-ratio is to keep consistent the relationship
between the query and the reference sample; a two-fold upward change in ratio of the query to reference has a log2 value of 1, whereas a two-fold change downward has a
log2 ratio value of -1. The main advantage of log2 transformation include increased
normality in the distribution of metabolite peak areas, leading to greater ease in future bioinformatics calculations and manipulations.
Data transformation is not yet commonly practiced in metabolomics datasets. There has been some discussion on techniques of transformation used in conjunction with normalization, of which there are typically three options (adapted from Steuer
et al [179]):
1. Normalization and transformation by z-score. The z-score is whitened data such that each datapoint has the metabolite mean subtracted and is divided by the metabolite standard deviation (thus normalizing to unit standard deviation and zero mean). In this, it is assumed that valuable information is not contained in the mean nor variance.
2. Division by metabolite mean or median. Doing so would retain values of the relative variance of the variables. log2-transformation is optional after this step.
3. Transformation of the distribution. log2-transformation is the most common
transformation at this step, as it ensures a more Gaussian distribution to the data (if there are many small peak areas, the distribution may exhibit kurtosis to the leftward tail). Another example of a distribution transformation is a rank
transformation, or a transformation projection in which the N measurements are projected into equally spaced numbers on the interval [0,1] with their order being preserved.
In Chapter 5, we explore different transformation techniques (no transformation,
log2-transformation, and log2-transformation with z-score data whitening) in the
ap-plication of determining the best imputation techniques for missing metabolomics data.
Imputation of missing data
GC-MS and LC-MS data contain missing values for reasons including instrumen-tal limits of detection, peak co-elution, ion suppression effects, and improper data alignment between samples. Because it is often costly and infeasible to repeat exper-iments, one has two options when faced with missing data: the data can be ignored (marginalization) or the missing values can be filled in (imputation). Data marginal-ization discounts the impact of the missing values but is difficult to implement, as many statistical tools cannot cope with missing data; clustering methods and many unsupervised method such as PCA are not possible without the use of more special-ized techniques [89, 170]. On the other hand, data imputation bypasses this problem by replacing missing values with new values. These imputed values generated by the method (and assumptions) of choice and are perhaps problematically treated as equally reliable as original data. Recent systematic approaches to tracking conserved metabolites among sample replicates allow for a user-specified missingness to deter-mine the metabolites studied (sC), and imputation of these missing values yields more comprehensive data coverage.
To date, there has been little discussion regarding how to best handle missing values. Disregarding metabolites for which there is missing data is impractical, as missing values are unavoidable and it would result in the loss of much valuable in-formation. Current methods for handling missing values in metabolomics datasets involve imputation via metabolite medians, means, and other simple metrics [179]. Bijlsma et al suggested imputing values based on triplicates: if two values are present
![Figure 2-6: Abundance of derivatized metabolites with derivatization time, from Kanani et al [80]](https://thumb-eu.123doks.com/thumbv2/123doknet/14731752.573113/35.918.220.711.158.943/figure-abundance-derivatized-metabolites-derivatization-time-kanani-et.webp)