arXiv:1001.0696v1 [astro-ph.SR] 5 Jan 2010
January 5, 2010
A photometric and spectroscopic investigation of star formation in
the very young open cluster NGC 6383
⋆,⋆⋆
G. Rauw
1,⋆⋆⋆, J. Manfroid
1,†, and M. De Becker
1,‡GAPHE, Institut d’Astrophysique et de G´eophysique, Universit´e de Li`ege, All´ee du 6 Aoˆut 17, Bˆat B5c, 4000 Li`ege, Belgium Received date / Accepted date
ABSTRACT
Context.The very young open cluster NGC 6383 centered on the O-star binary HD 159176 is an interesting place for studying the impact of early-type stars with strong radiation fields and powerful winds on the formation processes of low-mass stars.
Aims.To investigate this process, it is necessary to determine the characteristics (age, presence, or absence of circumstellar material) of the population of low-mass pre-main-sequence (PMS) stars in the cluster.
Methods.We obtained deep U B V (R I)cHα photometric data of the entire cluster as well as medium-resolution optical spectroscopy
of a subsample of X-ray selected objects.
Results.Our spectroscopic data reveal only very weak Hα emission lines in a few X-ray selected PMS candidates. We photometrically identify a number of Hα emission candidates but their cluster membership is uncertain. We find that the fainter objects in the field of view have a wide range of extinction (up to AV = 20), one X-ray selected OB star having AV≃8.
Conclusions.Our investigation uncovers a population of PMS stars in NGC 6383 that are probably coeval with HD 159176. In addition, we detect a population of reddened objects that are probably located at different depths within the natal molecular cloud of the cluster. Finally, we identify a rather complex spatial distribution of Hα emitters, which is probably indicative of a severe contamination by foreground and background stars.
Key words.Stars: pre-main sequence – X-rays: stars – open clusters and associations: individual: NGC 6383
1. Introduction
Substantial efforts have been dedicated to the investigation of the low-mass star formation process in very young open clusters harbouring a population of early-type stars. Many of these stud-ies were inspired by X-ray observations of these open clusters (with either Chandra or XMM-Newton) that found a wealth of moderately bright X-ray sources associated with low-mass pre-main-sequence (PMS) stars (e.g., Prisinzano et al. 2005, Sana et al. 2007). A strong and often variable X-ray emission is fre-quently observed for PMS stars in the classical and the weak-line T Tauri (hereafter cTTs and wTTs respectively) stage. However, enhanced X-ray emission is only one characteristic of PMS stars; in addition to a Li overabundance, position in a colour-magnitude diagram, photometric variability, Hα emission, and near-infrared excesses that can help us identify the population of PMS stars in a given cluster. Unfortunately, all these criteria are biased to some extent: X-ray and Hα emission are strongly variable and could be weaker over some part of the PMS lifetime or over some stellar mass ranges; the Li lines can only be mea-sured for rather bright objects observable using medium
resolu-Send offprint requests to: G. Rauw
⋆ Based on observations collected at the European Southern
Observatory (ESO, La Silla, Chile).
⋆⋆ Table 2 is only available in electronic form at the CDS
via anonymous ftp to cdsarc.u-strasbg.fr (130.79.128.5) or via http://cdsweb.u-strasbg.fr/cgi-bin/gcat?J/A+A/
⋆⋆⋆ Research Associate FRS-FNRS (Belgium) †
Research Director FRS-FNRS (Belgium)
‡
Postdoctoral Researcher FRS-FNRS (Belgium) Correspondence to: rauw@astro.ulg.ac.be
tion spectroscopy; photometric surveys are heavily affected by foreground or background objects that are unrelated to the clus-ter, and IR-excesses are only detected for a subset of the PMS objects. Therefore, it is important to consider as many criteria as possible when identifying the stars in the PMS stage.
In this paper, we consider the case of the very young clus-ter NGC 6383. The clusclus-ter distance was consistently declus-termined to be 1.3 ± 0.1 kpc, while the reddening towards the brighter cluster members corresponds to E(B − V) = 0.32 ± 0.02 (for a review of the cluster properties, see Rauw & DeBecker 2008 and references therein). NGC 6383 is centered on the massive O7((f)) V + O7((f)) V binary HD 159176 (Linder et al. 2007) and an XMM-Newton observation detected 76 X-ray sources (Rauw et al. 2003) in addition to HD 159176 (De Becker et al. 2004). Most of these secondary sources were considered to be PMS stars or at least PMS candidates (Rauw et al. 2003, hereafter Paper I). To ascertain the status of these objects, we obtained optical spectroscopy of a subsample of the X-ray selected ob-jects as well as multi-band photometry of the cluster as a whole. The present paper reports the analysis of these data.
2. Observations
Low-resolution spectra of a set of X-ray selected stars in NGC 6383, taken from Paper I, were obtained on the night of June 22-23, 2004 with the EMMI instrument mounted on ESO’s 3.5 m New Technology Telescope (NTT) at La Silla. The EMMI instrument was used in the Red Imaging and Low Dispersion Spectroscopy (RILD) mode with grism # 5 (600 grooves mm−1), providing a wavelength coverage from about 3800 to 7020 Å. This instrumental configuration yields
Table 1. The filters used in the photometric campaigns with the
WFI.
Filter ESO number
U BB#U/50 ESO877 B BB#B/123 ESO878 V BB#V/89 ESO843 Rc BB#Rc/162 ESO844 Ic BB#I/203 ESO879 Hα NB#Halpha/7 ESO856
a spectral resolution of 5.0 Å (FWHM of the He-Ar lines in the wavelength calibration exposures). The targets selected for spectroscopy were the brightest X-ray sources found to have a single optical counterpart within the 8 arcsec correlation radius used in Paper I. Their V magnitudes range from about 11.3 to 17.9. The exposure times were between 5 and 40 min depending on the magnitude of the targets. The data were reduced in the standard way using the long context of the midas package. The observing conditions were photometric over most parts of the night and we thus performed a relative flux calibration of our spectra against an observation of the spectrophotometric standard star LTT 9239 (Hamuy et al. 1992).
Photometric observations of the cluster were obtained with the Wide Field Imager (WFI) instrument at the ESO/MPG 2.2 m telescope at La Silla during two observing runs in September 2003 (service mode) and June 2004 (visitor mode). The WFI in-strument has a field of view of about 34′×33′covered by a mo-saic of 4 × 2 CCD chips with a pixel size of 0.238 arcsec/pixel. The frames were taken through a set of U B V (R I)cHα filters
(see Table 1) with various exposure times (from 1 second to about 10 minutes, depending on the filter) to allow measure-ments of both faint and moderately bright objects. Our photo-metric data are complete to magnitudes of about 20.5, 22.5, 22.0, 21.5, 20.5, and 20.5 for the U, B, V, Rc, Ic, and Hα filters,
re-spectively.
The data were bias subtracted and flat fielded using the iraf package. The raw images consist of dithered observations per-formed to fill the gaps between the WFI CCDs. The photometry in the natural system was obtained with the daophot software in two steps: a first pass on stacked, registered images in all filters allowed us to produce a deep catalogue of sources. In a second pass, the photometry of these sources was obtained for the individual CCDs with apertures of 4, 5, 8, and 11 pixel di-ameter (i.e., 0.95, 1.2, 1.9, and 2.6 arcsec). The larger aperture data were used to perform all-sky photometry. After a number of iterations, satisfactory zeropoints and extinction coefficients were obtained. To determine the latter, seven Stetson (B V R I) and Landolt (B V R I) standard fields were observed during the same nights. In addition, U B V R I data for 8 stars in NGC 6383 were obtained from FitzGerald et al. (1978), Th´e et al. (1985) and Zwintz et al. (2005). The data of the individual frames were then homogenized using bright isolated stars as secondary stan-dards with values determined from the all-sky photometry. The astrometry was established by matching the instrumental coor-dinates with the 2MASS point source catalogue. The 1.2 arcsec aperture is well suited to our analysis in terms of both accu-racy and sensitivity to crowding in the field. In the following, we use the photometry corresponding to this aperture, except when stated otherwise.
The passbands of the WFI filters, and in particular that of the
B filter, are rather non-standard. Unfortunately, the limited
num-ber of observed standard stars did not cover a sufficient range of
Fig. 1. Comparison between the B − V colour index in the WFI
system and the standard system for 156 stars selected as the best observed among those in common with Paunzen et al. (2007). The solid line yields our best-fit colour transformation.
spectral types to establish precise colour transformations from these standards. Therefore, we compared our WFI photometric data in the natural system with published Johnson-Cousins pho-tometry of stars in common in NGC 6383. In this context, we established a colour transformation (Fig. 1) based on the com-parison between our VWFI magnitudes and (B − V)WFI colours and the standard B V photometry for 156 stars in common with the (online) Table 1 of Paunzen et al. (2007). The resulting rela-tions are1
(B − V)std= −0.227 + 1.418 (B − V)WFI,
Vstd= VWFI+ 0.053 − 0.101 (B − V)WFI.
The coefficients of the colour terms of these relations are in rea-sonable agreement with those proposed by ESO on the WFI in-strument website2. Unfortunately, there are much fewer avail-able data for the calibration of the U, Rc, and Icfilters. We
there-fore adopted the coefficients of the colour terms following the transformations given by ESO and only determined the zero-points by comparing the WFI with the existing standard colours of seven stars. The resulting relations are
(U − V)std= 1.08 (U − V)WFI+ 0.002 + 0.02 (B − V)std,
(V − Rc)std= 0.98 (V − R)WFI+ 0.017 − 0.09 (B − V)std,
(V − Ic)std= 0.94 (V − I)WFI+ 0.023 − 0.08 (B − V)std.
1 The zeropoints in these relations only apply to our reduction of this
specific data set and cannot be compared to other reductions of other WFI data.
2
Fig. 2. Left and middle panel: flux-calibrated spectra of the F-K type stars in our spectroscopic sample of NGC 6383. The fluxes
were arbitrarily normalized to unity at the wavelength of 6820 Å and the spectra were shifted vertically by 0.4 units for clarity. The spectral types become progressively later from left to right and from top to bottom. The rightmost panel shows a zoom on the spectral region around the Hα line for those stars that are emitters or emission candidates.
In the following, we applied these transformations to all of our data. Unless stated otherwise, all colours given in this paper refer to the transformed colours.3
Because of its special passband definition and a lack of suit-able standard fields, the Hα filter in use at the WFI cannot be directly tied to any existing standard photometric system. In the natural system, the Rc−Hα zeropoint was at first fixed arbitrarily
to zero for the standard stars. In a second step, we re-calibrated the zeropoint by comparing the observed Rc−Hα and
dered-dened V − Icindices of 9 stars whose spectra do not exhibit Hα
emission with the Rc−Hα versus V − Icrelation of emission-free
main-sequence stars in NGC 2264 as determined by Sung et al. (1997). To express the Rc−Hα indices in the system of Sung et
al. (1997), we need to subtract (4.71 ± 0.06) from the observed indices. All values of the Rc−Hα index quoted in this paper
and all plots involving this index refer to the Sung et al. (1997) system.
3. Spectroscopy
To establish the MK spectral types of the targets in NGC 6383, we used the digital spectral classification atlas compiled by R.O. Gray available on the web4. The details of the classification are given for each star in Appendix A. The results are summarized in Table 3.
The majority of the spectroscopically studied objects are late-type (F-K) main-sequence or slightly more luminous stars (see Fig. 2 and Table 3). The exceptions are the mid B-type star5 #56 and the early-type B star #76 (see Fig. 3).
3 Table 2 with the standard photometric data of those sources that are
detected in all filters is available at the CDS.
4 http://nedwww.ipac.caltech.edu/level/Gray/frames.html
5 Throughout this paper, we shall use the numbering convention
in-troduced in Paper I to designate the X-ray sources in the cluster, except when stated otherwise.
3.1. Late-type stars
For most stars of our spectroscopic sample, Hα is detected in absorption. The exceptions are stars #20, 25, 50, and possibly #57 and 39. We checked the existence of these emission lines on the original two-dimensional long-slit spectra to avoid incor-rectly identifying a cosmic ray hit or poorly corrected nebular Hα emission. Although nebular emission exists around all tar-gets of our sample, it is removed by sky subraction and the neb-ular line is too weak to account for the strength of the observed stellar emission features. We emphasize that the strongest emis-sion is seen in the spectrum of the counterpart of X-ray source #50. This object experienced an X-ray flare during the
XMM-Newton observation (see Paper I). The situations for stars #57
and #39 are not entirely clear. In the former, we observe two weak emission peaks bluewards of the rest-frame wavelength of the Hα line with heliocentric velocities of −564 and −71 km s−1. Although our inspection of the 2D-spectra confirmed that these features are not artefacts, the detection of this blueshifted emis-sion structure needs to be confirmed by additional observations. Finally, in the spectrum of star #39, a broad absorption feature is observed blueward of the Hα rest wavelength, while the line itself seems to be filled in by emission.
All spectroscopically observed objects with Hα emission in their spectrum are of spectral type K (see Fig. 2), while all stars of earlier spectral type display the Hα line in absorption. We also note that the equivalent widths (EWs) of these emission lines are rather modest. For instance, they are much weaker than the 10 Å equivalent width conventionally adopted as the limit between the objects of the wTTS and cTTs categories (e.g., Preibisch et al. 2001). Therefore, these objects are candidate wTTs.
Although the spectral resolution of our data is insufficient to resolve the possible Li i λ 6708 line from the neighbouring Fe i lines, we note that the spectra of the majority of the targets later than spectral type F (especially stars #1, 16, 25, 39, 55, 57, 65, 67, and 70) display a rather strong absorption feature at the wavelength of the Li i line. The unresolved blend with the Fe i lines probably accounts for the asymmetric shape of the ob-served profiles. The possible detection of Li in the spectra of the
late-type stars of our sample is compatible with a PMS status. We note that all spectra (except #56 and #76) display a signifi-cant absorption feature at about 6104 Å. This feature is unlikely to be associated with the Li line observed in Population II stars, whose intensity should be very weak (see e.g., Ford et al. 2002). This absorption could instead be caused by a blend of Ca i λ 6103 with Fe i.
Finally, we emphasize that star #55 (= FJL 23) was previ-ously suggested to be a foreground object (Th´e et al. 1985; Rauw et al. 2003), but this conclusion is not confirmed by our present analysis. The photometric and spectroscopic properties of this star are indeed consistent with it being a member of NGC 6383.
3.2. Early-type stars
The OB star #76 appears heavily absorbed and must therefore belong to a population of stars located behind NGC 6383. Our photometric measurements indeed yield E(B − V) ≃ 2.5 for this star. The NGC 6383 cluster is understood to be located in front of a dust cloud (Lloyd Evans 1978) and star #76 is therefore likely a background object located either inside or behind this cloud.
Fig. 3. Flux-calibrated spectra of the two early-type stars in our
spectroscopic sample of NGC 6383. Star #76 probably has an earlier spectral type than #56, but is much more absorbed. The fluxes are presented in the same way as in Fig. 2.
The case of star #56 (= FJL 24, FitzGerald et al. 1978) is also quite interesting. Mid to late-type B stars are usually not strong X-ray emitters. Using the bolometric correction for a B5-7 V star and the X-ray flux from Paper I, we derive a log LX/Lbolvalue of −5.13 ± 0.11 for this star. To evaluate the X-ray luminosity, we converted the EPIC-pn count rate given in Paper I into an unabsorbed flux of (8.2 ± 1.9) × 10−14erg cm−2s−1 in the 0.5 – 10 keV band, assuming a thermal plasma at a temperature of kT = 0.5 keV and an absorption by an interstellar neutral hydrogen column of 1.91 × 1021cm−2. We note that our estimate of the X-ray flux would change by less than 20% regardless of the
temper-ature of the emitting plasma in the range 0.3 – 2 keV. Assuming a distance of 1.3 kpc, the resulting X-ray luminosity amounts to (1.7 ± 0.4) × 1031erg s−1, which places this object clearly among the X-ray bright late B-type stars (see e.g., Bergh¨ofer et al. 1997, Sana et al. 2006b, and Naz´e 2009). We note that this value of the X-ray luminosity would also be rather high if the emission was originating in an unresolved PMS companion.
4. Photometry
Photometric data for a total of about 80 000 sources were ex-tracted. We have cross-correlated these data with the 2MASS near-IR catalogue (Skrutskie et al. 2006) and found about 18 000 matches within 0.5 arcsec, 7000 of which have good quality near-IR photometry. Among the latter, 2639 objects have reli-able WFI photometry in all filters including the Hα filter.
Cluster members fainter than V ∼ 11 are expected to be pre-main-sequence objects. Unfortunately, these objects popu-late a region of the colour-magnitude diagrams that is potentially highly contaminated by field stars unrelated to NGC 6383 (see Fig. 4). Since the cluster is probably located in front of a dust cloud, we expect the background objects to appear redder than the true cluster members.
4.1. Cross-correlation with the X-ray catalogue
We cross-correlated the catalogue of X-ray sources from Paper I with the list of sources detected in our photometric data. To derive the optimal correlation radius, we applied the technique of Jeffries et al. (1997). In this approach, the distribution of the cumulative number of catalogued sources as a function of the cross-correlation radius rXis given by
Φ(d ≤ rX) = A 1 − exp −r2 X 2 σ2 + (N − A)h1 − exp(−π B r2X)i,
where N, A, σ, and B indicate, respectively, the total number of cross-correlated X-ray sources (N = 76), the number of true correlations, the uncertainty in the X-ray source position, and the surface density of the catalogue of photometric sources. The best-fit model parameters are A = 57.8, σ = 1.8 arcsec, and B = 1.22 × 10⁻²arcsec−2. The latter value (independently determined from the best fit to the cross-correlation process) is in reasonable agreement with the true mean surface density of our photometric catalogue (1.8 × 10⁻²arcsec−2).
The optimal correlation radius that includes the majority of the true correlations whilst simultaneously limiting contamina-tion by spurious coincidences to about 15%, is found to be about 5 arcsec. The following X-ray sources have no optical counter-part in our photometric data: #4, 5, 18, 19, 21, 26, 28, 40, 71, and #72. Some of the sources (e.g. #14 and #36) which had no counterpart in the USNO catalogue (see Paper I), now have a faint optical counterpart in our data. We note that HD 159176 (X-ray source #44) is too bright to be reliably measured in our photometric data and was thus not included in the correlation process.
The colour-magnitude diagrams shown in Fig. 4 indeed con-firm that the bulk of the X-ray sources with an optical counter-part populate a locus where PMS stars are expected. We note that these diagrams also include the 44 PMS candidates identified by Paunzen et al. (2007) on the grounds of photometric criteria.
Table 3. Summary of the properties of the targets of our spectroscopic sample. The last column yields the cross identification with
objects previously studied by FitzGerald et al. (1978) as well as some information about objects with Hα emission.
Star Spectral Type Hα V B − V V − Ic Rc−Hα Notes
#1 K0 V abs. 15.04 1.16 1.45 −4.70 #3 F5 V abs. 13.51 0.77 1.07 −4.77 #16 G0–5 V–IV abs. 14.96 1.10 1.37 −4.72 #20 K0 V em. 15.84 1.25 1.67 −4.72 EW = −1.0 Å,v = 85 km s−1 #25 K2 V em. 15.09 1.25 1.62 −4.54 EW = −0.5 Å,v = 5 km s−1 #39 K2–4 V P-Cyg? 15.15 1.25 1.54 −4.70 = FJL 9 #50 K7 V em. 17.88 1.61 2.09 −4.65 EW = −3.0 Å,v = −14 km s−1 #54 G7 V abs. 12.77 0.85 1.00 −4.71 #55 G0–1 IV abs. 13.81 0.97 1.20 −4.72 = FJL 23 #56 B5–7 V abs. 11.35 0.26 0.40 −4.85 = FJL 24
#57 K0–5 III double peak em.? 15.49 1.25 1.56 −4.72 EW = −0.3 Å,v = −564, −71 km s−1
#65 G5 IV–III abs. 14.02 1.05 1.30 −4.72
#67 G5–K0 V abs. 14.21 0.91 1.12 −4.65
#70 G5–K0 IV–III abs. 15.19 1.08 1.33 −4.75
#76 O9–B5 abs. 17.81 2.21 2.89 E(B − V) ≃ 2.5
Fig. 4. Colour-magnitude diagrams of the WFI photometric data with errors of less than 0.15 on V and less than 0.21 in the relevant
colour. Single and multiple counterparts of the X-ray sources from Paper I are shown as filled and open squares, respectively, while the PMS candidates from Paunzen et al. (2007) are shown as open circles. The main-sequence relation was shifted to account for a distance modulus of 10.57 and a reddening of E(B − V) = 0.32. The reddening vectors are shown for each diagram and the short and long-dashed lines yield the 1.5 and 10 Myr isochrones, respectively, from Siess et al. (2000).
4.2. Near infrared photometry
Based on the cross-correlation with the 2MASS data, we can compile a near-IR colour-colour diagram. For this purpose, we applied the colour transformations of Carpenter (2001, updated in 20036) to convert the 2MASS colours into the homogenized
J H K photometric system of Bessell & Brett (1988). The results
are illustrated in Fig. 5. In the left panel of this figure, we show the J H K colour-colour diagram. The heavy solid lines yield the intrinsic colours of main-sequence stars and giants according to Bessell & Brett (1988), while the dashed straight line yields the locus of dereddened colours of classical T Tauri stars according to Meyer et al. (1997).
6 http://www.ipac.caltech.edu/2mass/index.html
With l = 355.69◦ and b = +0.04◦, the NGC 6383 field lies
just outside the area investigated by Nishiyama et al. (2009) in their study of the extinction law towards the Galactic cen-tre. Nevertheless, we assume here that their results also apply to our targets. In doing so, we find that the apparent reddening of the objects in the field of NGC 6383 spans a very wide range: about 2.4 in AK s, which corresponds roughly to 20 magnitudes
in AV. It is most interesting that there appears to be a
continu-ous distribution of reddening values. We already pointed out that the cluster is likely located at the front side of a large molecular cloud. The results in Fig. 5 imply that we observe a population of sources from different depths inside this molecular cloud. This situation compromises any attempt to define a straightforward cluster membership criterion based on the reddening.
Fig. 5. Left panel: colour-colour diagram of the 2MASS counterparts of the WFI objects. Only those sources with reliable near-IR
photometry are shown. The solid lines yield the locus of the main-sequence and of the giant branch according to Bessell & Brett (1988), while the dashed straight line indicates the locus of the unreddened cTTs following Meyer et al. (1997). The reddening vector is shown for AK s= 0.5. Middle panel: Location of the X-ray sources from Paper I (filled and open squares), PMS candidates from
Paunzen et al. (2007, open circles) and Hα emitters (× symbols) and candidates (+ symbols) in the J H K colour-colour diagram. The other symbols have the same meaning as in Fig. 4. Right panel: colour-magnitude diagram. The main-sequence is shown for a distance modulus of 10.57 and for three different values of the reddening (from left to right, AK s= 0.0, 0.5, and 1.0).
In the middle panel of Fig. 5, we have also plotted the near-IR counterparts of those stars that are either selected as X-ray sources, PMS candidates from Paunzen et al. (2007), or Hα emit-ters (see next subsection). This figure shows that the vast major-ity of the X-ray sources are subject to a rather moderate redden-ing. At the same time, we find no obvious correlation between Hα emission and the existence of a near-IR emission: the major-ity of the possible Hα emitters (see Sect. 4.3) have rather normal near-IR colours.
Finally, the rightmost panel of Fig. 5 displays the colour-magnitude diagram, where the main-sequence relation has been shifted for a distance modulus of 10.57. Again, the existence of a wide, continuous range of interstellar reddening is quite obvi-ous. We note that the reddening of the bright cluster members (E(B − V) = 0.32) corresponds roughly to AK s= 0.11.
4.3. Hαemission candidates identified from photometry
According to our current understanding of classical T Tauri stars, these objects are surrounded by a circumstellar disk that is trun-cated at its inner edge by the stellar magnetosphere. Most of the time, cTTs accrete at a rate well below 10−6M⊙yr−1 and their
Hα emission originates in accretion streams that are controlled by the magnetic field (see e.g., Schulz 2005).
We used the Rc−Hα index, calibrated against the Sung et al.
(1997) Rc−Hα versus V −Icmain-sequence relation (see Sect. 2),
to identify potential Hα emitters. The relevance of the Sung et al. (1997) relation for our dataset was checked using synthetic pho-tometry, obtained by numerical integration of the spectropho-tometric data of main-sequence stars from Jacoby et al. (1984) through the WFI V and Hα filter passbands. The operation was performed for stars of spectral types from B4 V to M5 V. Our synthetic photometry is in excellent agreement with the Sung et al. main-sequence relation. We then repeated the integration by adding an Hα emission line of increasing equivalent width to the Jacoby et al. (1984) spectra. In this way, we found that an Hα equivalent width of 10 Å, which is usually adopted as the
thresh-old for cTTs, corresponds to an Rc−Hα index 0.24 ± 0.04 above
the main-sequence relation.
We therefore consider a star as an Hα emission candidate if its Rc−Hα colour index is between 0.12 and 0.24 above the
main-sequence relation (corresponding roughly to an EW be-tween 6 and 10 Å) and as an Hα emitter if the corresponding colour index is more than 0.24 above the main-sequence rela-tion. In this way, we arrive at a list of 924 Hα candidates and 592 emitters. If we restrict ourselves to stars with photometric errors of less than 0.15 mag in V and less than 0.21 in Rc−Hα,
these numbers become 475 and 189 for the Hα candidates and emitters, respectively. The 0.06 mag uncertainty in the zeropoint of the Rc−Hα index translates into an uncertainty of a factor 1.8
in the numbers of emitters and candidates.
Since the objects in our data appear to have a range of ex-tinction values, we checked that our selection criterion for Hα emission is not biased by false detections which could be caused by a heavy reddening that produces an artificially high Rc−Hα
index. To do so, we evaluated the(Rc+Ic)
2 −Hα colour index, which has a different sensitivity to reddening than our Rc−Hα criterion.
The vast majority of objects selected with the Sung et al. (1997) criterion are also identified as candidates or emitters according to the(Rc+Ic)
2 −Hα colour.
From Fig. 6, we see that neither the Paunzen et al. (2007) PMS candidates nor the X-ray sources display strong Hα emis-sion: there are only half a dozen X-ray sources in the Hα emitter region. We note that those objects for which our spectroscopy re-vealed (rather weak) Hα emission are not identified as emitters in our photometric data. This suggests that wTTs will be diffi-cult to identify with narrow-band photometry (see also Dahm & Simon 2005 for a comparison of the efficiency of narrow-band photometry and slitless grism spectroscopy to identify weak Hα emitters).
Whilst many emission candidates and emitters are rather faint objects, we see that Hα emission is apparently not restricted to only the faintest (and hence least massive) stars. A few ob-jects as bright as V ∼ 10 – 11 are identified as Hα emitters. The brightest is the Be star HDE 317861 (B3 - 5 Vne, Lloyd Evans
Fig. 6. Left: the Rc−Hα index is shown as a function of the V − Iccolour. The symbols have the same meaning as in Fig. 4. The solid
line indicates the relation for main-sequence stars as taken from Sung et al. (1997) and reddened by E(V − Ic) = 0.512. The
short-and long-dashed lines yield the thresholds for Hα cshort-andidates short-and emitters, respectively. Right: V versus Rc−Hα colour-magnitude
diagram. The + and × symbols represent Hα emitter candidates and emitters, respectivley.
1978) with V = 9.76 and R − Hα = −4.32. Whilst the Herbig Ae star FJL 4 (= V 486 Sco, A5 IIIp, Th´e et al. 1985) is classified as a candidate Hα emitter with our criteria, indications of emission are found in neither our photometric nor spectroscopic data of FJL 24 (= X-ray source #56, B5-7). We note that the latter ob-ject was classified as B8 Vne by FitzGerald et al. (1978), since one observation out of six analysed by these authors displayed Hβ emission. Our spectrum of this star exhibits strong Balmer absorption lines (see Fig. 3).
The presence of Hα emission does not automatically imply that a star is a member of the cluster. For instance, our sample of Hα emitters and candidates may contain foreground, magnet-ically active, dMe stars, unrelated to the cluster. The incidence of dMe stars (with an Hα EW > 1 Å) increases towards lower masses and hence later spectral types (see Hawley et al. 1996 and references therein): the observed frequency is about 10% at spectral types earlier than M2, but increases towards about 60% around spectral type M5. Furthermore, the dMe stars of the ear-lier spectral types appear on average 0.5 mag brighter in MV and
MK than their dM counterparts (Hawley et al. 1996). An
esti-mate of the number of foreground dMe stars can be obtained by following the same approach as Dahm & Simon (2005), based on the stellar luminosity function of Jahreiß & Wielen (1997) and the dMe incidence of Hawley et al. (1996). In this way, we arrive at an estimated number of 151 foreground dMe stars. We note that this number is an upper limit, since the reddening due to interstellar material along the line of sight towards NGC 6383 was not taken into account in this evaluation.
A strong contamination by foreground dMe objects is a
pri-ori expected to produce a rather uniform spatial distribution of
Hα selected stars across the field of view. However, the spatial distribution of the Hα emitters and candidates is far from uni-form (see Fig. 7). Indeed, the density of emitters is higher to-wards the north of the field of view and especially in the
north-western part, while there is a paucity of Hα emitters in the south-west and to the east of HD 159176. This can be quantified for instance by comparing the north-west and south-east quadrants: the former contains a total of 1951 objects with good photomet-ric data, 18% of which are either emitters or candidates, whereas the latter contains 3056 good quality objects only 3% of which are selected as Hα emitters or candidates. The lack of Hα emit-ters and candidates in the south-east is particularly surprising because this region has the highest density of stars. Therefore, the paucity of emitters cannot be attributed to the effect of in-terstellar absorption. Although projection effects could play a role, we note that unlike our findings for X-ray emitters (see Paper I), there is no clear concentration of Hα selected stars in the cluster core7. Outside the core, the mean spatial density of Hα emitters and candidates are 0.08 and 0.26 arcmin−2, respec-tively. Taken together, these numbers are higher than expected from the predicted maximum number of foreground dMe stars (0.13 arcmin−2), indicating that the distribution of Hα emitters and candidates must be related to the properties of the cluster or its background.
What is the reason for the lack of accreting PMS stars in the south-western and eastern parts of the halo of NGC 6383, as inferred from the position of Hα emitters and candidates? One possibility is photoevaporation of the protoplanetary disks by ei-ther the extreme-UV (EUV) and far-UV (FUV) irradiation from the O-type binary HD 159176 or the EUV, FUV and X-rays of the central PMS star itself. The former effect was predicted the-oretically, and evaporating disks with cometary tails were ob-served with Spitzer in three cases at distances between 0.1 and 0.35 pc from an O-star (Balog et al. 2006, 2008 and references therein). However, in NGC 6383, several Hα emitters are
rela-7 Kharchenko et al. (2005) estimate a core radius of 4.8 arcmin and a
corona radius of 15 arcmin for NGC 6383, while Piskunov et al. (2008) evaluate a tidal radius of at least 30 arcmin.
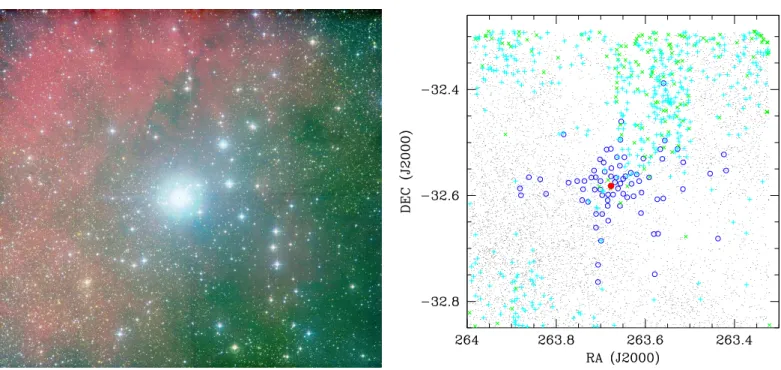
Fig. 7. Left: three-colour image of the NGC 6383 cluster compiled from our WFI photometry. Right: spatial distribution of the Hα
emitters (× signs) and candidates (+ signs). The large dot in the centre of the field indicates the position of HD 159176, while the open circles represent the X-ray sources taken from Paper I. North is at the top and east is on the left.
tively close to the O-star binary. We found 8 Hα emitters and 19 candidates within 5 armin of HD 159176, which corresponds to a linear radius of 1.9 pc at the distance of 1.3 kpc. Therefore, we would have to assume that the photoevaporation occurs prefer-entially along certain directions and affects the cluster halo more efficiently than the core, which is rather unlikely. Concerning the second effect, Gorti & Hollenbach (2009) predict photoevapora-tion of the accrephotoevapora-tion disk by irradiaphotoevapora-tion of the PMS star within a rather short timescale of about 1 Myr. If the emission measure of the X-ray emitting plasma correlates with the EUV emission measure of the PMS star, this second scenario could, at least qualitatively, explain why the most prominent X-ray emission is observed from wTTs. This photoevaporation caused by irradia-tion by the central star itself should however affect PMS stars irrespective of their position in the cluster. This scenario alone is therefore insufficient to explain the complex distribution of Hα emitters.
An alternative could be that our sample is heavily contam-inated by background objects. For instance, we could be ob-serving the edge of another star-forming region to the north of HD 159176. We tested this possibility by considering the spatial distribution of objects with high J − K indices (J − K > 2.5) that hence are potentially highly reddened background stars. This distribution reveals a lack of objects in the south-west, but is oth-erwise rather uniform. Therefore, while it is likely that our sam-ple is highly contaminated by a population of background stars, we see no peculiar pattern in the spatial distribution of highly reddened stars.
5. The Hertzsprung-Russell diagram
From the various colour-magnitude diagrams presented in the previous section, we find that the X-ray sources and the Paunzen et al. (2007) PMS candidates (hereafter the PNZ objects) are the best candidate cluster members, whereas the Hα emission crite-ria select a population that could contain a significant fraction of background objects as well as some field dMe stars.
Assuming a distance modulus of 10.57 and a reddening
E(B−V) = 0.32 for the cluster members (see Rauw & De Becker
2008 and Sect. 1), we built the Hertzsprung-Russell diagram of the X-ray sources, the PNZ objects, and the Hα selected stars. To do so, we evaluated the effective temperatures and bolomet-ric corrections by means of a linear interpolation of the Kenyon & Hartmann (1995) tables as a function of (V − Ic)0. The results are shown in Fig. 8. Whilst some of the Hα selected objects form a continuation of the locus of the X-ray and PNZ objects, the ma-jority of the Hα emitters are located below this locus. This result must be caused by the contamination of our Hα sample by fore-ground dMe stars or backfore-ground objects located inside or behind the molecular cloud. Since our attempts to establish an efficient and self-consistent membership criterion failed, we instead ap-plied a rough selection based upon the J − K colour and the position with respect to the cluster core. By selecting only stars with J − K < 1.5, which is roughly equivalent to AK < 0.54,
and within the 5 arcmin radius of the cluster core, we obtain a cleaner Hertzsprung-Russell diagram where the Hα emitters are now mainly in a lower mass continuation of the locus of PNZ and X-ray selected PMS stars.
There are a number of available theoretical PMS tracks that we can compare with our data. The various evolutionary codes differ in many respects and the most important differences con-cern the opacities, the equation of state, the treatment of the stel-lar atmosphere, and most importantly the treatment of convec-tion (see the discussions in Siess et al. 2000). Here, we chose to compare our data with the results of four different models: the 1997 version of the tracks of D’Antona & Mazzitelli (1997, hereafter DM97), the Siess et al. (2000, hereafter SDF00) cal-culations, and both the standard and rotating, models of Landin et al. (2009, hereafter LMV09). Whilst the DM97 computations use the full spectrum of turbulence (FTS) approach to treat con-vection, the other calculations considered here rely instead on the mixing length theory (MLT). These different treatments
ob-Fig. 8. Top: Hertzsprung-Russell diagram of the X-ray sources,
PNZ objects, Hα emitters, and candidates. The PMS evolution-ary tracks are taken from Siess et al. (2000) for masses of 0.2, 0.3, 0.4, 0.5, 0.7, 1.0, 1.5, 2.0, 2.5, 3.0, 4.0, 5.0, 6.0, and 7.0 M⊙.
The thick solid line illustrates the zero-age main-sequence and the dashed lines yield isochrones for ages of 0.5, 1.5, 4.0, 10.0, and 20.0 Myr. The symbols have the same meaning as in Fig. 6. Bottom: same, but with the selection criteria J − K < 1.5 and position within the 5 arcmin radius of the cluster core applied to the Hα emitters and candidates.
viously lead to quantitative differences in the PMS tracks, and one expects conflicting results when empirically determining the ages of observed PMS stars. For instance, D’Antona & Mazitelli (1997) argue that the FTS approach generally yields a lower age spread than the MLT. With these limitations in mind, we
piled the histograms of the ages of the PMS candidates by com-paring with the isochrones of the various models (see the results in Fig. 9 and Table 4). We emphasize that the age distribution of the Hα selected stars would actually be meaningless because, as stated above, this selection criterion probably fails to properly identify cluster members.
Table 4. Mean ages and standard age deviations (in Myr) for the
various samples of PMS candidates in NGC 6383. X-ray selected PNZ objects mean stand. dev. mean stand. dev.
DM97 1.9 2.5 2.6 4.0
SDF00 3.8 3.0 2.8 2.9
LMV09 std. 2.1 2.6 1.9 2.9
LMV09 rot. 1.7 2.3 1.8 3.0
Figure 9 shows that the DM97 isochrones indeed yield a strongly peaked age distribution (especially for the PNZ ob-jects). We note that this information is not obvious from the standard deviations listed in Table 4, since the few outliers at ages of 10 Myr and older have a strong impact on these param-eters. Although the quantitative picture depends upon the evo-lutionary models in use, we note that the X-ray sources and the PNZ objects have essentially identical age distributions which are strongly peaked below 5 Myr and the likely PMS stars have a mean age between 2 and 3 Myr. From the observational point of view, the combined uncertainty in cluster distance and red-dening (as inferred for the brighter cluster members) amounts to 0.18 mag, which introduces an uncertainty of about 0.4 Myr in the cluster age. The latter number is well within the disper-sion of the ages implied from the comparison with the different evolutionary models.
Our results are in reasonable agreement with the upper age limit of 4 Myr inferred by Paunzen et al. (2007). We note that FitzGerald et al. (1978) derived a younger cluster age of 1.7 ± 0.4 Myr. The difference may originate from the use of different PMS isochrones or the work of FitzGerald et al. (1978) being restricted to the brighter cluster members only.
Finally, we estimated the age of the central early-type binary HD 159176 from the effective temperature and bolometric luminosity determined by the spectral analysis of Linder et al. (2007). The bolometric luminosities were computed by assuming that AV = 0.96 and DM = 10.57, while the
effec-tive temperatures were adapted from Martins et al. (2005) following the spectral types derived by Linder et al. (2007). Since HD 159176 is probably a detached binary system, binary evolution effects are unlikely to have played a major role in the evolution of the system to date. Therefore, we compared the position of the stars in the Hertzsprung-Russell diagram with the single-star evolutionary tracks of Meynet & Maeder (2003). Depending on whether we use the evolutionary tracks with an initial equatorial rotational velocity of 0 or 300 km s−1, we estimate the age of the system to be in the range 2.3 – 2.7 Myr, in good agreement with the 2.8 ± 0.5 Myr estimated by FitzGerald et al. (1978). As a result, we find that the age of the massive binary and the mean age of the PMS stars are reasonably consistent with a single star-formation event about 2 – 3 Myr ago.
We emphasize that many objects meet more than one PMS criterion simultaneously. This is the case for the X-ray sources #16, 20, 25, 39, 42, 47, 51, 57, and 63 that appear in the list of
Fig. 9. Distribution of ages as inferred from the comparison with
PMS isochrones. The evolutionary models are from D’Antona & Mazzitelli (1997, top left), Siess et al. (2000, top right), and Landin et al. (2009) without rotation (lower left) and with rota-tion (lower right).
PMS candidates of Paunzen et al. (2007). Five of these objects were observed spectroscopically and were found to exhibit a sig-nificant absorption probably caused by Li i λ 6708. For three of them, we also found weak Hα emission (#20, 25 and 57) in the spectra. Finally, we note that our X-ray source #51 is identical with WEBDA object 382, which is understood to be a rapidly rotating PMS star (Paunzen et al. 2007, Zwintz et al. 2005, their object 71).
6. Conclusions
Our photometric and spectroscopic investigation of NGC 6383 has detected a significant population of reddened objects with extinctions spanning a continuous range up to AV ≃20. We
sug-gest that these objects are located at different depths within the natal molecular cloud of the cluster. NGC 6383 could therefore be the visible part of a significantly larger star formation event, probably affecting large parts of this molecular cloud.
We have found that the best PMS candidates display little or no Hα emission in their spectrum. The mean age of the most likely low-mass PMS candidates in NGC 6383 is found by com-paring with various PMS evolutionary tracks, to be 2 – 3 Myr, in reasonable agreement with the estimated age of HD 159176 at the centre of the cluster. It therefore appears that the low-mass stars and the O-type binary were born in the same star-formation event.
Acknowledgements. We acknowledge support from the Fonds de Recherche
Scientifique (FRS/FNRS), through the XMM/INTEGRAL PRODEX contract as well as by the Communaut´e Franc¸aise de Belgique - Action de recherche con-cert´ee - Acad´emie Wallonie - Europe. This research made use of data products from the Two Micron All Sky Survey, which is a joint project of the University
of Massachusetts and the Infrared Processing and Analysis Center/California Institute of Technology, funded by NASA and NSF.
References
Balog, Z., Rieke, G.H., Su, K.Y.L., Muzerolle, J., & Young, E.T. 2006, ApJ 650, L83
Balog, Z., Rieke, G.H., Muzerolle, J., Bally, J., Su, K.Y.L., Misselt, K., & G´asp´ar, A. 2008, ApJ 688, 408
Bergh¨ofer, T.W., Schmitt, J.H.M.M., Danner, R., & Cassinelli, J.P. 1997, A&A, 322, 167
Bessell, M.S., & Brett, J.M. 1988, PASP 100, 1134 Carpenter, J.M. 2001, AJ 121, 2851
D’Antona, F., & Mazzitelli, I. 1997, in Cool Stars in Clusters and Associations, eds. R. Pallavicini & G. Micela, Mem. S. A. It., 68, 807
De Becker, M., Rauw, G., Pittard, J.M., Antokhin, I.I., Stevens, I.R., Gosset, E., & Owocki, S.P. 2004, A&A, 416, 221
Dahm, S.E., & Simon, T. 2005, AJ 129, 829
FitzGerald, M.P., Jackson, P.D., Luiken, M., Grayzeck, E.J., & Moffat, A.F.J. 1978, MNRAS, 182, 607
Ford, A., Jeffries, R.D., Smalley, B., Ryan, S.G., Aoki, W., Kawanomoto, S., James, D.J., & Barnes, J.R. 2002, A&A, 393, 617
Gorti, U., & Hollenbach, D. 2009, ApJ 690, 1539
Hamuy, M., Walker, A.R., Suntzeff, N.B., Gigoux, P., Heathcote, S.R., & Phillips, M.M. 1992, PASP, 104, 533
Hawley, S.L., Gizis, J.E., & Reid, I.N. 1996, AJ 112, 2799 Jacoby, G.H., Hunter, D.A., & Christian, C.A. 1984, ApJS, 56, 257
Jahreiß, H., & Wielen, R. 1997, in Hipparcos’97, ESA SP-402, eds. B. Battrick, M.A.C. Perryman & P.L. Bernacca, 675
Jeffries, R.D., Thurston, M.R., & Pye, J.P. 1997, MNRAS, 287, 350 Kenyon, S.J., & Hartmann, L. 1995, ApJS 101, 117
Kharchenko, N.V., Piskunov, A.E., R¨oser, S., Schilbach, E., & Scholz, R.D. 2005, A&A, 438, 1163
Landin, N.R., Mendes, L.T.S., & Vaz, L.P.R. 2009, A&A, 494, 209
Linder, N., Rauw, G., Sana, H., De Becker, M., & Gosset, E. 2007, A&A, 474, 193
Lloyd Evans, T. 1978, MNRAS, 184, 661
Martins, F., Schaerer, D., & Hillier, D.J. 2005, A&A, 436, 1049 Meyer, M.R., Calvet, N., & Hillenbrand, L.A. 1997, AJ, 114, 288 Meynet, G., & Maeder, A. 2003, A&A, 404, 975
Naz´e, Y. 2009, A&A, 506, 1055
Nishiyama, S., Tamura, M., Hatano, H., Kato, D., Tanab´e, T., Sugitani, K., & Nagata, T. 2009, ApJ, 696, 1407
Paunzen, E., Netopil, M., & Zwintz, K. 2007, A&A, 462, 157
Piskunov, A.E., Schilbach, E., Kharchenko, N.V., R¨oser, S., & Scholz, R.D. 2008, A&A, 477, 165
Preibisch, T., Guenther, E., & Zinnecker, H. 2001, AJ, 121, 1040
Prisinzano, L., Damiani, F., Micela, G., & Sciortino, S. 2005, A&A, 430, 941 Rauw, G., De Becker, M., Gosset, E., Pittard, J.M., & Stevens, I.R. 2003, A&A,
407, 925
Rauw, G., & De Becker, M. 2008, in Handbook of Star Forming Regions, Vol. II:
The Southern Sky, ASP Monograph Publ., 5, ed. B. Reipurth, 497
Sana, H., Rauw, G., Naz´e, Y., Gosset, E., & Vreux, J.-M. 2006, MNRAS, 372, 661
Sana, H., Rauw, G., Sung, H., Gosset, E., & Vreux, J.-M. 2007, MNRAS, 377, 945
Schulz, N.S. 2005, From Dust to Stars, Springer & Praxis Publishing Ltd., Chichester, UK
Siess, L., Dufour, E., & Forestini, M. 2000, A&A 358, 593
Skrutskie, M.F., Cutri, R.M., Stiening, R., Weinberg, M.D., Schneider, S., et al. 2006, AJ 131, 1163
Sung, H., Bessell, M.S., & Lee, S.-W. 1997, AJ, 114, 2644
Th´e, P.S., Hageman, T., Westerlund, B.E., & Tjin A Djie, H.R.E. 1985, A&A, 151, 391
Zwintz, K., Marconi, M., Reegen, P., & Weiss, W.W. 2005, MNRAS 357, 345
Appendix A: Notes on individual stars
Star #1: the strength of the G-band and the ratio Fe i λ 4325/Hγ suggest a K0 spectral type. The strength of Y ii λ 4376 relative to Fe i λ 4383 and the general appearance of the violet-system CN bands and Ca ii H and K lines indicate a main-sequence or slightly brighter luminosity class. We thus adopt a K0 V spec-tral type with an uncertainty of about two specspec-tral subtypes.
Star #3: the strength of the H8 line compared to the Ca ii H and K lines, the strength of the (weak) G-band, and the relative importance of metallic line spec-trum indicate an F5 spectral-type. The weakness of the Sr ii λ 4077 line indicates
a main-sequence or subgiant luminosity class. We thus classify this star as F5 V with an uncertainty of two spectral subtypes.
Star #16: the strength of the G-band and the Ca i λ 4227 line as well as the ratio Fe i λ 4325/Hγ suggest an early G (G0-5) spectral type. The strength of Sr ii λ4077 suggests either a subgiant or giant luminosity class. The strength of Y ii λ4376 relative to Fe i λ 4383 is instead indicative of a main-sequence luminosity class. We thus adopt a G0-5 V-IV spectral type.
Star #20: the strength of the G-band and the ratio Fe i λ 4325/Hγ yield a spectral type of about K0. The strength of Sr ii λ 4077 compared to the nearby Fe i lines suggests a main-sequence or slightly brighter luminosity class. We thus classify this star as K0 V with two subclasses of uncertainty. The star exhibits a rather strong Hα emission above the continuum with an equivalent width of about −1.0 Å.
Star #25: the same criteria as for star #20 yield an early to mid K spectral type. The strength of Sr ii λ 4077 compared to the nearby Fe i lines suggests a main-sequence luminosity class. This is also in agreement with the strength of Y ii λ 4376 relative to Fe i λ 4383. We thus adopt a K2 V spectral type with an uncertainty of about two spectral subtypes. The Hα line is seen in emission above the continuum with an EW of −0.5 Å.
Star #39: the strength of the G-band indicates that this star must be earlier than K5, whilst the weakness of the Balmer lines and the ratio of Fe i λ 4325/Hγ suggest a spectral type later than K0. Considering also the general appearance of the spectrum, we favour a spectral type K2-4. The same criteria as for star #25 indicate a main-sequence luminosity class. We thus adopt a K2-4 V spectral type. While no Hα emission is seen above the continuum, there is also no absorption at the wavelength of Hα. There is an absorption towards the blue, suggesting a kind of P-Cygni profile.
Star #50: the strength of the Ca i λ 4227 line and the MgH feature at 4780 Å suggest a late-K main-sequence type, whilst the lack of visible TiO bands indi-cates that the star must be earlier than M0. We adopt a K7 V spectral type with an uncertainty of at least two subtypes. A strong (EW = −3.0 Å) Hα emission is detected.
Star #54: the strength of the G-band and the Ca i λ 4277 line as well as the ratio Fe i λ 4325/Hγ suggest a late G spectral type. The strength of Sr ii λ 4077 as well as the strength of Y ii λ 4376 compared to Fe i λ 4383 yield a main-sequence or giant luminosity class. We thus adopt a G7 V spectral type with an uncertainty of two subtypes in spectral type.
Star #55: the same criteria as for star #54 yield an early-G type, G0-5, but closer to G0. The strength of the Ti ii, Fe ii λλ 4172-78 blend, as well as of the Sr ii λ 4077 line suggest a subgiant luminosity class. We classify this star accordingly as G0-1 IV.
Star #56: as inferred by the presence of He i lines, this object is a B-star. The intensity ratio He i λ 4471 versus Mg ii λ 4481 as well as the strength of the Ca ii K line indicate a spectral type B5-7. The rather broad Balmer lines suggest a main-sequence luminosity class. We thus classify this star as B5-7 V. The spectrum also exhibits the diffuse interstellar band (DIB) at 4430 Å.
Star #57: the same criteria as for star #39 suggest a spectral type K0-5. The strength of Sr ii λ 4077 compared to the nearby Fe i lines suggests a giant luminosity class, whilst the strength of Y ii λ 4376 compared to Fe i λ 4383 could be consistent with either a main-sequence or giant classification. Considering also the general appearance of the spectrum, we adopt a K0-5 III classification. Our spectrum displays a blue-shifted Hα emission above the continuum with an equivalent width of about −0.3 Å.
Star #65: the same criteria as for star #16 indicate a G5 spectral type. The strength of the Sr ii λ 4077 line suggests that the star is a subgiant or giant. We thus classify this star as G5 IV-III.
Star #67: the same criteria as for stars #16 and #25 yield a G5-K0 V spectral type.
Star #70: the same criteria as for star #16 indicate a late G spectral type. The strength of Sr ii λ 4077 compared to the nearby Fe i lines and the strength of Y ii λ4376 relative to Fe i λ 4383 suggest a subgiant or giant luminosity class. We thus classify the star as G5-K0 IV-III.
Star #76: the spectrum of this source is very red with almost no flux be-low ∼ 4300 Å. However, this must be a rather hot object, since in addition to some Balmer absorption lines, we also see several He i absorption lines (λλ 4471, 4922, 5876, 6678). The Mg ii λ 4481 line is weaker than He i λ 4471. The spec-trum also exhibits a number of strong diffuse interstellar bands. This star must therefore be a heavily extinguished object of spectral type O9-B5.