Development, Physics, Technology and Operation of a “Pilot-Scale” Dielectric
Barrier Discharge Reactor
SEAN WATSON
Département de génie Physique
Mémoire présenté en vue de l’obtention du diplôme de Maîtrise ès sciences appliquées Génie physique
Août 2019
Ce mémoire intitulé :
Development, Physics, Technology and Operation of a “Pilot-Scale” Dielectric
Barrier Discharge Reactor
présenté par Sean WATSON
en vue de l’obtention du diplôme de Maîtrise ès sciences appliquées
a été dûment accepté par le jury d’examen constitué de :
David MÉNARD, président
Michael WERTHEIMER, membre et directeur de recherche Pierre-Luc GIRARD-LAURIAULT, membre
ACKNOWLEDGEMENTS
I would like to express my deep gratitude to Professor Michael R. Wertheimer, my research supervisor, for his patient guidance, and useful critiques of this research work. I would also like to thank Dr. Bernard Nisol, for his counsel and enthusiastic encouragement. Assistance provided by Mr. Yves Leblanc, our lab technician, was also of great support to this work. Finally, I would also like to extend my special thanks to the co-authors of the journal articles presented in this thesis, namely Professor Frédéric Sirois and Professor Sophie Lerouge, Dr. Hervé Gagnon and Mylène Archambault-Caron.
RÉSUMÉ
Ce mémoire fait suite aux recherches précédentes à Polytechnique Montréal dans le domaine des plasmas froids générés dans des décharges à barrières diélectriques (DBD), travail qui continue depuis les années 1980. Ce sujet a été à l’origine de plusieurs mémoires et thèses qui, bien évidemment, ont fait l’objet de nombreux articles publiés dans des revues internationales. Le présent candidat à la maîtrise a fait ses débuts au sein du groupe de recherche en 2015, avant de commencer son programme de M.Sc.A.. Il a été co-auteur de plusieurs articles, dont un exemple est présenté en annexe. Le contenu de ce document, présentant le véritable travail accompli au cours du programme de M.Sc.A., est essentiellement composé autour de 2 chapitres principaux (chapitres 4 et 5) : il s’agit d’articles (le premier déjà publié, le second étant soumis en juin 2019) dont le candidat est l’auteur principal.
Dans le premier article, présenté au chapitre 4, deux réacteurs à DBD de tailles différentes, un petit et l’autre plus grand d’un ratio de ca. 1 : 40, avec leurs équipements associés ainsi qu’un programme Matlab® dédié, ont été utilisés pour déterminer avec précision l’énergie électrique, , dissipée par cycle de la tension (en courant alternatif) appliquée, . Pour le petit réacteur, le tout a été accompli sur une gamme de fréquences entre 5 ≤ ≤ 50 kHz et en utilisant une paire identique de différents matériaux diélectriques (des disques de 2.54 cm de diamètre) possédant une permittivité relative variant entre 2.1 ≤ ≤ 9.5, et agissant à titre de barrières diélectriques au sein d’une DBD pour 4 gaz différents : He, Ne, Ar et N2. Pour le plus grand réacteur, a été limitée à 20 kHz, et ce dans l’Ar et l’He. Ce dernier système a pour principale utilisation des expériences de polymérisation par plasma, où des « monomères » organiques sont mélangés au flux du gaz porteur : l’Ar. La méthode pour évaluer avec exactitude est d’abord présentée, pour suivre avec une comparaison des valeurs mesurées sous différentes conditions. Dans la mesure du possible, ces valeurs sont comparées entre le petit et le grand réacteur, puis dans un second temps avec les valeurs retrouvées dans la littérature. La fiabilité de la méthode est confirmée, par exemple, du fait de la concordance avec les valeurs de champs de rupture électrique pour les gaz étudiés reprises dans la littérature, de même qu’avec plusieurs autres nouveaux résultats.
Le deuxième article, présenté au chapitre 5, traite de la méthodologie précédemment développée pour comprendre les échanges d’énergie entre les molécules-précurseurs et le gaz porteur d’Ar au sein du grand (à l’échelle pilote) réacteur DBD. L’accent est mis sur une famille de précurseurs organiques simples, c’est-à-dire cinq hydrofluorométhanes, CHxFy (0 ≤ x ≤ 4; y = 4 - x). Chacun de ces précurseurs (à des concentrations de ‰) a été mélangé avec 10 litres standards par minute (slm) d’Ar dans une DBD à 20 kHz, 8 kV (crête-à-crête). Pour chaque composé, l’énergie absorbée par molécule, a été tracée en fonction des flux de précurseur, (en sccm). Outre la détermination de à partir des mesures électriques telles que mises en place lors de travaux précédents, nous avons étudié la physico-chimie du plasma à l’aide d’une technique de diagnostic supplémentaire, la spectrométrie d’émission optique. L’influence de la structure chimique des précurseurs a été mise en évidence lors de l’étude des dépôts de couches minces de polymères par plasma (PP). De plus, les vitesses de dépôt et les angles de contact de ces films de PP ont été mesurés et corrélés avec les valeurs de et les compositions chimiques déterminées par XPS.
ABSTRACT
This thesis extends earlier research at Polytechnique Montreal in the area of dielectric barrier discharge (DBD) “cold” plasmas, work that commenced as far back as the 1980s; it has over the years been the object of numerous M.Sc.A. / Ph.D. theses and, of course, many articles published in international journals. The present master’s candidate started collaborating with the DBD team in 2015, before commencing his own M.Sc.A. program, and has been co-author of several published articles, for example the one presented in the Appendix. The content of this current document, truly the research associated with this M.Sc.A. program, is to a large extent concentrated in two main chapters (Nos. 4 and 5), articles for both of which the candidate is the lead author.
In the first article, Chapter 4, two DBD reactors, one small, the other about 40 times larger, associated equipment and a dedicated Matlab® code have been used to carry out precise determinations of electrical energy, , dissipated per discharge cycle of the applied a.c. voltage, .In the smaller reactor, this was done over the frequency range 5 ≤ ≤ 50 kHz and using twin pairs of several different insulating materials (2.54 cm diameter discs) with relative permittivities between 2.1 ≤ ≤ 9.5 as dielectric barriers in DBDs for 4 different gases: He, Ne, Ar and N2. In the large reactor, was restricted to 20 kHz in Ar and He; this latter system primarily serves for plasma polymerization experiments in which organic “monomers” are admixed with the flow of Ar as carrier gas. We report the method for exactly evaluating , then present and compare values measured under different conditions. To the extent possible, these are compared between the small and large reactors, and with results published in the literature. The reliability of the method is confirmed, for example, by reproducing published breakdown fields of the gases examined, and by several other original results.
The second article, Chapter 5, deals with this method that we have developed for understanding energetic exchanges between precursor molecules and Ar carrier gas in the large (pilot-scale) DBD reactor. It focuses on a particular family of quite simple organic precursor gases, namely five hydrofluoromethanes, CHxFy (0 ≤ x ≤ 4; y = 4 - x). Each of those precursors (at ‰ concentrations) was mixed with 10 slm of Ar in a 20 kHz, 8 kV (peak-to-peak) DBD. For each compound, , the energy absorbed per molecule, was plotted as a function of precursor
flow rate, (in sccm). Beside determination of from electrical measurements of the types perfected in preceding work, we have used optical emission spectroscopy (OES) as a diagnostic of the plasma physico-chemistry. The influence of the precursors’ chemical structures has been investigated by depositing thin plasma polymer (PP) coatings; we have measured the deposition rates and water contact angles of these PP films, and have correlated them with values and chemical compositions determined from XPS measurements.
TABLE OF CONTENTS
ACKNOWLEDGEMENTS ... III
RÉSUMÉ ... IV
ABSTRACT ... VI
TABLE OF CONTENTS ... VIII
LIST OF TABLES ... X
LIST OF FIGURES ... XI
LIST OF SYMBOLS AND ABBREVIATIONS... XV
LIST OF APPENDICES ... XVII
CHAPTER 1 INTRODUCTION ... 1
CHAPTER 2 CRITICAL LITERATURE REVIEW ... 4
2.1 General Considerations ... 4
2.2 DBDs for Use in PECVD ... 7
CHAPTER 3 ORGANIZATION OF THE DOCUMENT AND COHERENCE OF THE ARTICLES IN RELATION TO THE RESEARCH GOALS ... 9
3.1 Introduction ... 9
3.2 Evaluation of from ... 10
CHAPTER 4 ARTICLE 1: ENERGETICS OF NOBLE GAS DIELECTRIC BARRIER DISCHARGES: NOVEL RESULTS RELATED TO ELECTRODE AREAS AND DIELECTRIC MATERIALS... 13
4.1 Introduction ... 14
4.2 Experimental Methodology ... 16
4.2.2 Equivalent Circuit Model and Energy Computation ... 18
4.3 Experimental Results and Discussion ... 21
4.4 Conclusions ... 27
CHAPTER 5 ARTICLE 2: ENERGETICS OF REACTIONS IN A DIELECTRIC BARRIER DISCHARGE WITH ARGON CARRIER GAS: VIII HYDROFLUOROMETHANES ... 30
5.1 Introduction ... 31
5.2 Experimental Section ... 33
5.3 Results and Discussion ... 35
5.3.1 Energy Absorbed by Precursor Added to the Ar Carrier Gas ... 35
5.3.2 Optical Emission Spectroscopy (OES) ... 37
5.3.3 Results for Individual Ar/CHxFy Mixtures ... 39
5.4 Discussion ... 51
5.5 Conclusions ... 56
CHAPTER 6 GENERAL DISCUSSION ... 57
CHAPTER 7 CONCLUSION AND RECOMMENDATIONS ... 59
7.1 Recommendations for future work ... 59
7.2 Contributions by the Author, Sean Watson (S.W.)...60
REFERENCES ... 61
APPENDICES... 67
APPENDIX A ARTICLE 3: ENERGETICS OF MOLECULAR EXCITATION, FRAGMENTATION AND POLYMERIZATION IN A DIELECTRIC BARRIER DISCHARGE WITH ARGON CARRIER GAS... 67
LIST OF TABLES
Table 4.1 Relative permittivities ( ) and thickness ( ) of dielectrics used in this research. . 18 Table 4.2 Values of the equivalent circuit model elements, Fig. 3. ... 20
Table 4.3 Dielectric breakdown field values calculated from , at = 20 khz. values from the literature are presented for comparison (a : large reactor; b : small reactor) . 27
Table 5.1. Results of broad-scan XPS analyses of PP deposits on c-Si substrates obtained from DBD discharge plasmas in Ar/CHxFy mixtures. ... 43
Table 5.2. Compilation of calculated (1/ ) slopes, deposition rates, r, and values for DBD plasmas in Ar/CHxFy mixtures. ... 55 Table A.1. Numerical values of slopes (in Watts) and (in eV) for all compounds presented in Figure A.3. ... 74
LIST OF FIGURES
Figure 1.1. DBD reactors used in 3 different applications: (a) low-pressure system, reprinted with permission from[1], (b) atmospheric pressure plasma torch configuration (© Surfx Technologies LLC, used with permission), (c) atmospheric pressure planar DBD configuration, reprinted with permission from[2]. ...1 Figure 2.1. (a) Filamentary discharges in air at 1 bar; (b) dielectric barrier APGD in a flow of pure He at 1 bar (Reproduced with permission from [25]). ... 4 Figure 2.2. (a) Filamentary (streamer-) discharges in an air gap at 4 kV peak voltage; (b, c)
Pseudo-glow behavior at 2 kHz in a 0.5-mm helium gap under atmospheric pressure, with
peak voltage across the metallic-dielectric electrode gap as a parameter. (b) 430-V peak (c) 720-V peak. (Reproduced with permission from [5]). ... 5 Figure 3.1. (a) Comparison of versus (rms) between pure Ar (F = 10 slm, upper curve) and acetylene-doped Ar ( = 20 sccm, lower curve) DBD plasmas at 20 kHz. (b) Plots of versus precursor gas flow, , for Ar ( = 10 slm) DBD plasmas “doped” with hydrocarbons. The frequency was = 20 kHz and the applied voltage, 2.8 kVrms. Reproduced with permission from [7]. ... 10 Figure 3.2. Plots of absorbed energy difference, , versus C2H2 flow, , for Ar ( = 10 slm) DBD plasmas at 20, 30 and 40 kHz. The applied voltage, , was 2.8 kVrms. Reproduced with permission from [7]. ... 11 Figure 4.1. (a) Schematic diagram of the small DBD cell and associated components; (b) scale drawing of the large DBD reactor: upper electrodes (A); lower electrode (D); dielectric barriers (B, C); discharge gap (2 mm) (E); gas injector / diffuser (F). ... 16
Figure 4.2. Equivalent electrical circuit diagram; the portion in the dashed rectangle represents the discharge cell. = 50 Ω; see text for further details. ... 18 Figure 4.3. Characteristics (amplitude and phase) of the (a) small; and (b) large DBD reactors, as a function of frequency, , of the same applied a.c. voltage ( ) as during He or Ar discharges (measured at 100 kPa in air, where no discharges are present). The continuous
curves through the data points represent the best fits to the presented equivalent circuit model. In (b), notice that deviations in phase angle are only about 1°. ... 19 Figure 4.4. Typical examples of measured ( , ) and calculated ( , ) electrical signals of multiple (two) periods of DBD in the large reactor: (a, b) APGD in He ( = 20 kHz, = 2
mm); (a) = 675 Vrms: (b) = 2.8 kVrms; (c, d) APGD in Ar ( = 20 kHz, = 2 mm); (c) = 2.0 kVrms ; (d) = 3.3 kVrms. The characteristics of the large reactor, for example the dielectric barrier materials, are described in sub-section 4.2.1. ... 22 Figure 4.5. Plot of versus (Vrms) for He APGD at = 20 kHz in the small reactor; different dielectric barrier materials of the same thickness, = 2.0 mm, gap width, = 2.0 mm, and He flow, = 3.1 L/min, were maintained constant throughout. The uncertainty of values is estimated at < 10%, on the basis of multiple repetitions. The superimposed straight-line plot of versus represents values at = 800 Vrms, which for PTFE (Teflon®) was obtained by downward extrapolation. ... 23
Figure 4.6. (a) Plots of versus , and (b) of versus for He and Ar DBD measurements conducted using the large reactor, where v is the plasma volume and the dielectrics are specified in the sub-section 4.2.1. In (b), the dotted line corresponds to a quadratic fit. ... 24 Figure 5.1. Right-hand side: Examples of measured ( , ) and calculated ( , ) electrical signals of two DBD periods, averaged over one minute of data acquisition: (a) APGD in Ar + 30 sccm of CH4 ( = 20 kHz, = 2 mm; = 2.8 kVrms); (b) APGD in Ar + 32 sccm of CF4, same DBD conditions. Left-hand side: “instantaneous” (ca. 50 µs) and signals, showing more filamentary nature of (b). ... 36
Figure 5.2. Plots of versus 1/ (see text) for the five CHxFy molecules used in this research. Characteristics of particular interest, namely the values of and of the initial slopes, [d( )/d( )], will be the objects of discussion later in this text. ... 37 Figure 5.3. Optical emission spectra of Ar/CHxFy mixture DBD plasmas. Different colors, corresponding to specific cases (see box), highlight the main spectral features that served for diagnostics in the following sections. ... 38
Figure 5.4. Plots of (a) versus ; and (b) versus (see text for explanations), for the case of Ar/CF4 mixtures with 0 ≤ ≤ 40 sccm (log-log scales, base 10). ... 40 Figure 5.5. Plots of (a) versus ; and (b) versus (see text for explanations), for the case of Ar/CHF3 mixtures with 0 ≤ ≤ 50 sccm (log-log scales, base 10)... 41 Figure 5.6. High-resolution (HR) C 1s XPS spectra of PP-CHF3 coatings on c-Si substrates from mixtures with Ar, with (a) = 3 sccm and (b) = 10 sccm. ... 44 Figure 5.7. Plots of (a) versus ; and (b) versus ; (c) (green) and water contact angle (red) versus (see text for explanations), for the case of Ar/CH2F2 mixtures with 0.9 ≤ ≤ 40 sccm. Note log-log scales in (a) and (b). ... 46 Figure 5.8. High-resolution (HR) C 1s XPS spectra of PP-CH2F2 coatings on c-Si substrates from mixtures with Ar, with (a) = 3 sccm and (b) = 14 sccm. ... 47 Figure 5.9. Plots of (a) versus ; and (b) versus (see text for explanations), for the case of Ar/CH3F mixtures with 1 ≤ ≤ 50 sccm (log-log scales, base 10)... 49 Figure 5.10. Plots of (a) versus (log-log scales, base 10); and (b) versus (see text for explanations), for the case of Ar/CH4 mixtures with 2 ≤ ≤ 50 sccm. ... 50 Figure 5.11. Log-log (base 10) plots of (a) CF2, (b) CF3, and (c) CH (386 nm) band intensities, , versus of the CHxFy molecules, using the same colors as previously. ... 52 Figure 5.12. Deposition rates, (in nm/min) of PP coatings from the CHxFy molecules, for (a)
= 3 sccm and (b) = 10 sccm. The colored data points represent contact angles of sessile water droplets on the corresponding PP surfaces. ... 54
Scheme A.1. (i) Formic acid (M = 46.0); (ii) Acetic acid (M = 60.0); (iii) Acrylic acid (M = 72.0). ... 71
Figure A.1. (a) Plot of and (b) (in eV, see text) versus for three organic acids shown in Scheme 1 ( = 20 kHz, = 2.8 kVrms, = 10 slm). ... 71 Figure A.2.(a) Plot of (in eV) versus 1/ for three organic acids shown in Scheme 1; (b) region closest to the origin (f = 20 kHz, 2.8 kVrms, F = 10 slm). ... 72
Figure A.3. Plot of (in eV) versus molecular mass, , for a series of simple gases and more complex organic molecules. Explanation of abbreviations: MMA: methyl methacrylate; PIB: propyl isobutyrate; n-PMA: n-propyl methacrylate; AMA: allyl methacrylate; TMDSO: tetramethyldisiloxane; HMDSN: hexamethyldisilazane; HMDSO: hexamethyldisiloxane (f = 20 kHz, 2.8 kVrms, F = 10 slm). ... 73
LIST OF SYMBOLS AND ABBREVIATIONS
This list presents the symbols and abbreviations used in the thesis in alphabetical order, along with their meanings.
Area
a.c. Alternating Current a.f. Audio Frequency AP Atmospheric Pressure APGD Atmospheric Pressure Glow
Discharge
APTD Atmospheric Pressure Townsend Discharge
Parasitic Capacitance (c.f. Fig 4.2)
Parasitic Capacitance (c.f. Fig 4.2)
CAG Contact Angle Goniometry Capacitance of the Dielectric
(c.f.Fig 4.2)
Calculated Gap Capacitance (c.f. Fig 4.2)
d Dielectric Thickness (c.f. Eq. 4.2) DBD Dielectric Barrier Discharge
Activation Energy
Energy Difference (pure - mixture) Electrical Energy Input
Energy per Molecule
Carrier Gas Flow (mainly Ar) Frequency
Precursor-Molecule Flow FWHM Full Width at Half Maximum G Reactor- and Process Dependant
Factor
HV High Voltage
Current
Discharge Current (c.f. Fig 4.2) Gas Current (c.f. Fig 4.2) Gap Current (c.f. Fig 4.2)
Measured Current (c.f. Fig 4.2) ITO Indium-Tin-Oxide
Emission Intensity per Molecule Relative Permittivity
LP Low Pressure Molecular Mass Number of Cycles
OES Optical Emission Spectroscopy
Power
PP Plasma Polymer
PECVD Plasma Enhanced Chemical Vapor Deposition
PTFE Poly(tetrafluoroethylene)
Charge
Deposition Rate r.f. Radio Frequency
Mass Deposition Rate per Unit of Monomer Flow Precision Resistance = 50 Ω (c.f. Fig 4.2) sccm Standard cm3/minute slm Standard L/minute Kinetic Temperature
Potential Difference
Volume
Cell Potential (c.f. Fig 4.2) Potential across (c.f. Fig 4.2) Gap Potential (c.f. Fig 4.2)
Measured Potential across (c.f. Fig 4.2)
Source Potential (c.f. Fig 4.2) Power Input
WCA Water Contact Angle
XPS X-Ray Photoelectron Spectroscopy ‰ Parts per Thousand
LIST OF APPENDICES
Appendix A Article 3: Energetics of Molecular Excitation, Fragmentation and
Polymerization in a Dielectric Barrier Discharge with Argon Carrier Gas... 67
A.1 Introduction ... 68
A.2 Experimental ... 70
A.3 Results and Discussion ... 70
A.4 Outlook ... 75
CHAPTER 1
INTRODUCTION
A plasma is a partially- or fully-ionised gas. It can be generated at low pressure (LP, partial vacuum, typically near 1 millibar or 100 Pa) or at atmospheric pressure (AP, 100 kPa). Figure 1.1 shows (a) a LP plasma between two electrodes in a glass reactor; (b) an AP plasma “jet”; (c) a so-called dielectric barrier discharge (DBD) plasma, the type that will exclusively be discussed hereafter in this thesis. A DBD plasma is formed by applying a high alternating-current (ac) voltage in the gap between two electrode surfaces, at least one of which is covered by a dielectric. Further information on the topic of DBD will be presented and discussed in Chapter 2. All plasmas shown in (a), (b) and (c) are “cold”, that is, the gas temperature remains close to 300 K.
Figure 1.1. DBD reactors used in 3 different applications: (a) low-pressure system, reprinted with permission from [1], (b) atmospheric pressure plasma torch configuration (© Surfx Technologies LLC, used with permission), (c) atmospheric pressure planar DBD configuration, reprinted with
permission from [2].
Over the course of many years, beginning in the 1980s, Prof. Wertheimer’s laboratory at Polytechnique Montréal has been conducting experimental research involving DBD, high-voltage (HV) breakdown of gases at AP, first at power frequency (60 Hz) in air or its constituents [3, 4], but more recently at audio-frequency (typically 20 kHz) in noble gases such as He [5-7]. The objectives of those studies were, first, to investigate the physico-chemical degradation of polymers that played the role of dielectric barriers [3, 4], later to characterize the “atmospheric pressure glow discharge” (APGD) behavior of He first reported in 1969 by R. Bartnikas [5]
.
Those early studies then morphed into yet others [8, 9] that laid the important groundwork for research presented in this M.Sc.A. thesis, namely the development of a precise method for measuring electrical energy input, , primarily into He APGD; combined with accurate
temperature (T) measurements, this enabled one to perform a detailed calorimetric (heat balance) investigation. A key objective of research presented in this thesis has been to further investigate and exploit the precise methods for measuring into all noble gas DBD plasmas with the aid of two home-built DBD reactors with very different characteristics [8, 9]. Accurate knowledge of is important for several reasons: (i) in the case of pure noble gas discharges, it helps confirm that one has good, reliable understanding of the plasma physics involved; (ii) more important, as will be shown later, measurements have opened the way to measure energy uptake by molecular “dopant” gases that are added in very small (typically parts-per-thousand, ‰) concentrations to the noble carrier gas flow (see below). Surprisingly, little published work of this type can be found in the literature, but all is based on modeling of the plasma discharges, also addressed in later sections. The earliest reported values in He atmospheric pressure (AP) DBD were those of Decomps et al. [10], followed later by power density measurements of Nersisyan and Graham [11]
, while Hofmann and coworkers reported power dissipation in AP He and Ar radio-frequency (r.f.) plasma jets [12]. Values of in uniform AP DBD in Ar were discussed by Tyata et al. [13], while Merbahi et al. [14] reported for mono-filamentary Ar micro-discharges.
Another paper from this laboratory [9] reported how , now measured in Ar DBD, could lead to , the average energy absorbed per molecule of a “dopant” gas or vapor from the Ar plasma “energy reservoir”, the dopant being introduced at ‰ concentration into the Ar carrier gas flow. This powerful new methodology subsequently gave rise to an extensive series of studies wherein organic precursor (or “monomer”) molecular dopants led to deposition of thin plasma polymer (PP) film coatings [9, 15-17]. The author of this thesis has participated very actively in most of that research, even as principal author in certain parts thereof, for example the second article (Chapter 5) in this thesis. However, he also first conducted a comparative study of the two technologically important noble gases, He and Ar, in their pure state, using two DBD reactor systems (“small”, area = 5.1 cm2; and “large”, area = 216 cm2
), the first article (Chapter 4) in this thesis.
The objectives of this M.Sc.A. thesis can therefore be described as follows:
(a) To help extend the traditional strengths in DBD research that this laboratory has developed over the course of many years. An important task will be to thoroughly assess transferability of
the energy measurement methodology using two very distinct home-built DBD reactors fed with either Ar or He;
(b) More particularly, to further exploit the powerful methodology for precise energy measurements in (pure or “doped”) noble gas DBD plasmas [8, 9, 15]
. We will here focus on the effect of electronegative atoms (such as F) in dopants on (1) the physico-chemical composition and the homogeneity of discharges, and (2) the validity of our energy measurement methodology in potentially difficult cases like filamentary, CF4-doped Ar discharges.
(c) In an even more general way, another sub-objective can be stated as follows: “Cold” DBD plasmas are of very great scientific and technological interest, wherein the latter extends over many diverse fields including (i) ozone generation; (ii) ultraviolet light sources; (iii) surface modification of polymers for adhesion enhancement; (iv) plasma-enhanced chemical vapor deposition (PECVD) of thin coatings; and more recently (v) plasma medicine, a very rapidly expanding multi-disciplinary topic involving not only physicists and chemists, but also biologists and clinicians. The review article by U. Kogelschatz [18] gives an even more complete list of applications, but also the underlying fundamental science: even though that paper is now 16 years old, it remains one of the most-cited references and introductions for newcomers to this field. Therefore, another sub-objective here is to help advance fundamental and practical aspects of
DBD plasma science.
To help understand how these objectives connect with this AP plasma research, a short state-of-the-art review will first be offered in Chapter 2, and an overview of the document’s organization in Chapter 3. From there, the thesis will expand by presenting two relevant research articles, the first (Chapter 4) pertaining to electrical measurements of the AP plasma discharge in noble gases; the second (Chapter 5) shows how this particular methodology is used to analyze PP deposition (AP-PECVD) in the specific case of hydrofluoromethanes. A presentation of the findings with respect to the electrical characterization of plasma will follow, before discussing further research objectives and possible improvements to the current methodology which might be explored.
We now continue, in Chapter 2, to present an overview of the literature that has been most relevant to the context of this thesis.
CHAPTER 2
CRITICAL LITERATURE REVIEW
2.1 General Considerations
DBD for plasma processing at AP have been gaining importance, to a large extent because they obviate the need for costly vacuum systems. In his review article, Kogelschatz described in detail the physics of this thermodynamically non-equilibrium (cold) plasma, along with its uses in numerous plasma-chemical reactions such as ozone synthesis, surface modification of polymers, abatement of pollutants, and excimer lamps [18]. Indeed, many gases, but especially the noble gases, can serve as efficient emitters of ultraviolet (UV) and vacuum-UV (VUV) radiation [18-22].
Generally, AP DBDs under audio-frequency (ca. 10 kHz and up) alternating current (a.c.) conditions are filamentary, comprising many ultra-rapid constricted micro-channels (streamers) that occur pseudo-randomly over the dielectric surface, a charge transfer occurring at each discharge site on the electrodes [18]. However, in 1969, Bartnikas [5] reported that a.c. discharges in He can manifest glow that extends uniformly over the entire electrode surface [6, 10, 23, 24]. Now often termed atmospheric pressure glow discharges (APGDs) on account of their spatially homogenous appearance, they have also been reported in other gases and gas mixtures [25, 26]. Figure 2.1(a) illustrates filamentary (streamer) discharge in air, while (b) shows the uniform “glow” (APGD) discharge that covers the entire surface area of the electrodes. In both cases, the images were acquired perpendicularly through a transparent indium-tin-oxide (ITO)-coated glass plate, ITO serving as the conducting ground electrode.
Figure 2.1. (a) Filamentary discharges in air at 1 bar; (b) dielectric barrier APGD in a flow of pure He at 1 bar (Reproduced with permission from [27]).
Figure 2.2. (a) Filamentary (streamer-) discharges in an air gap at 4 kV peak voltage; (b, c)
Pseudo-glow behavior at 2 kHz in a 0.5-mm helium gap under atmospheric pressure, with peak
voltage across the metallic-dielectric electrode gap as a parameter. (b) 430-V peak (c) 720-V peak. (Reproduced with permission from [7]).
Figure 2.2(a,b,c) shows (sinusoidal) voltage and superimposed current oscillograms, where (a) corresponds to Figure 2.1(a), and (b,c) to Figure 2.1(b). Regarding (a), the multitudes of streamer discharges in air or O2, generally in electronegative gases, are characterized by very short (a few ns) duration current pulses and small (ca. 100 µm) diameters that give rise to the luminous spot-footprints in Figure 2.1(a). But in this present work we shall be dealing further with the filamentary type of discharges only sporadically (Figure 2.1(a) and Figure 2.2(a)), rather with the “glow-type” (APGD) discharges of the types illustrated in Figure 2.1 (b) and Figure 2.2 (b,c); more will be said about these further below.
Apart from Kogelschatz [18], Massines and coworkers also published more recent comprehensive reviews of APGD physics, including their own seminal contributions [25, 26]. For example, it is known that Penning transfer via energetic metastables (He*, 19.8 eV lowest energy level; and Ne* (Neon), 16.6 eV) or dimers (He2, Ne2) can efficiently ionize residual traces of atmospheric or other gaseous impurities, giving rise to a so-called memory effect and a lowering of the breakdown voltage [25, 26]. For these reasons, they are also referred to as Penning mixture. Pure nitrogen (N2) is another gas in which APGD-like behavior can be observed [6, 28]. However, as explained by Massines and coworkers [25, 26, 28], its discharge physics is quite distinct and this has led them to coin for it the term APTD (Townsend) discharge.
APGD in He and Ne is characterized by a short-duration (ca. 5 µs) current peak per half cycle of the applied a.c. voltage, see Fig. 2(b), while the current peak is of much longer (tens of
µs) duration for APTD [6, 25, 26, 28]. However, a noteworthy feature of He and Ne APGD is the possible appearance of one or more additional current peak(s) per half-cycle under certain conditions, namely when the applied voltage is sufficiently high, and/or with deliberate addition of a gaseous dopant, see Fig. 2(c); this has been termed pseudo-glow by Bartnikas et al. [5-7]. Therefore, to distinguish the two situations, we shall hereafter refer to them as single peak (Fig. 2(b)) and multi-peak (Fig. 2(c)) regimes, respectively. Other key characteristics of APGD and APTD are the virtually perfect reproducibility, over very long durations, of the multi-μs current peaks’ time-span and amplitudes [5-7, 10, 23, 24, 26, 28, 29]
. It is this latter feature that enables measurements of the type reported in this present work.
In recent years, AP DBDs have also gained prominence for the deposition of thin films [2, 25, 30]
(see section 2.2. below) and in so-called “plasma medicine” [31]. In most of those applications, it is essential that the gas (kinetic) temperature, , remain near ambient, slightly above 300 K. This laboratory has shown that reliable measurements are best carried out by using fiber-optic thermometers [8, 32]; commercial fiber-optic thermometers were developed for use in conditions involving high voltages and/or intense electromagnetic fields, where conventional (e.g. thermocouple) instrumentation must be disqualified. The use of fiber-optic thermometers, however, is surprisingly not a widespread practice even though it was clearly shown that determination of based on optical emission spectroscopic (OES) techniques invariably overestimates the true gas temperature, often very grossly [32, 33].
Beside measuring , it is clearly important for the operator of a (AP) plasma system to also know the exact amount of electrical power, , delivered to the plasma and hence also to a substrate. Now, in many low-pressure (LP) plasma systems (r.f., or microwave), electrical power measurements can be carried out relatively accurately, albeit with some pitfalls and sources of uncertainty. But there is good reason to believe that, for power measurements in AP DBD plasmas, this is not the case. For example, many researchers use Q-V plots, also known as Lissajous figures [13, 34-36]; first introduced by Manley in 1943 [35, 37], this technique is now known to require considerable caution.
Chapter 4 of this thesis is devoted to exploiting the methodology developed in this laboratory for measuring power (or, rather , the energy per cycle of the applied audio-frequency voltage)
[9]
to a comparative study of two noble gases, He and Ar, in two very different DBD reactor systems.
2.2 DBDs for Use in PECVD
The literature regarding deposition of thin organic films for practical uses by plasma-enhanced chemical vapor deposition (PECVD), also known as plasma polymerization (PP), goes back at least to the early 1960s [38]. During subsequent decades, thousands of articles devoted to this subject have been published worldwide, as well as several monographs [39, 40]. While earlier literature almost exclusively dealt with high-frequency, r.f., or microwave glow-discharge plasmas sustained at reduced pressure, typically near 100 mTorr (13.3 Pa), there has more recently been growing interest in PP based on atmospheric pressure AP plasmas [25, 36, 41-47]. DBD constitute the main approach that enables scale-up for industrial processing, because they obviate the need for vacuum systems and can thereby potentially reduce costs significantly, as already pointed out in section 2.1. above.
In the PP literature, there has long been an interest in correlating deposition kinetics, physico-chemical and structural properties of films with energy absorbed by the organic precursor (monomer) molecules in the plasma. Indeed, this often controversial subject has been the object of a series of debates in the journal Plasma Processes and Polymers [48]: Hegemann and coworkers [49-51] developed an original approach towards the macroscopic phenomenology of PP, one which leads to an unifying dependence of the mass deposition rate per unit of monomer flow, , on the macroscopic reaction parameter ( here being power input), by way of a quasi-Arrhenius expression:
(2.1)
where is an apparent activation energy, and a reactor- and process-dependent factor related to the maximum monomer conversion into film growth. , proportional to the average energy transferred per monomer molecule during its travel through the active plasma zone, governs the formation of reactive intermediates. It was originally known as the Becker parameter [52], or since the late 1970s as the Yasuda parameter [39, 53], (energy per mass of monomer), being molecular mass of the monomer. The use of Eq. (2.1) in plots of versus allows one to
identify different regimes in the PP process, for example “monomer-rich” and “monomer-lean” ones; these usually lead to films with significantly differing structures and characteristics. An important motivation of Hegemann’s work has been to develop their macroscopic approach to facilitate reactor scale-up, and to permit comparison of data from different laboratories.
Implementation of the concepts just described is relatively straightforward in the case of high frequency (h.f.) low pressure (LP) PP, for the following reasons; (i) usually, the monomer is introduced into the plasma reactor undiluted, although Hegemann and coworkers have shown how their method can be used also for mixtures including a second (reactive, but non-polymerizing) gas [49, 50]; (ii) while not simple and unambiguous, it is often possible to measure power absorbed in h.f. plasmas with reasonable precision. Now, in the case of AP discharges, particularly for PP reactions, neither of these generally apply:
(i) First, AP PP processes necessarily use a flow of (inert) carrier gas wherein that of the monomer is generally highly diluted (typically in the ‰ range);
(ii) regarding power measurements in AP plasmas, we have every reason to believe (see section 2.1. above) that such measurements are far from being simple, certainly not those involving AP DBDs.
Although various authors have proposed and attempted to use the Yasuda parameter in the context of AP DBD PP [36, 45-47, 54], combined complications (i) and (ii) above have so far presented major obstacles. Now, the precise method for measuring , the energy dissipated per cycle of the applied a.c. voltage in noble gas AP DBD developed in this laboratory [8, 55], results in reliable data, based on objective assessment criteria discussed elsewhere [8] and later in this thesis (Chapter 4). Referring to objective (b) in Chapter 1, an important sub-objective has been to further investigate whether measurements can yield specific information about PP reactions when a small precursor addition in 10 slm of Ar carrier constitutes only a few ‰ (or less) of total feed gas flow into the DBD reaction zone; the particular precursor family examined here has been the family of five hydrofluoromethanes (CHxFy, (0 ≤ x ≤ 4; y = 4 - x); PECVD of AP DBD reactions in this family of compounds constitutes the entirely novel content of Chapter 5.
CHAPTER 3
ORGANIZATION OF THE DOCUMENT AND
COHERENCE OF THE ARTICLES IN RELATION TO THE
RESEARCH GOALS
3.1 Introduction
Chapters 1 (Introduction) and 2 (Critical Literature Review) have presented the concepts, context, background and earlier work (both in this laboratory and elsewhere) underlying the research described in this M.Sc.A. thesis.
Chapters 4 and 5 provide two articles, both already published in international journals with peer review systems; their titles are
(i) “Energetics of noble gas dielectric barrier discharges (DBD): Novel results related to
electrode areas and dielectric materials”;
(ii) “Energetics of reactions in a dielectric barrier discharge with argon carrier gas: viii
hydrofluoromethanes”.
Those two articles are presented integrally, the only major modification being that all references have been combined in numerical order with the preceding lists from Chapters 1 and 2 in the overall summary bibliography at the end of this document. Both articles are complete documents, ones that contain practically all the information required for the reader to fully understand the content. Now, this requirement must, of course, also apply to this thesis, a document of more elaborate content than the two articles and its preceding chapters. Another important piece of information from earlier work in this laboratory [9] is therefore provided in the sub-section to follow. It will act as the “glue” between Chapters 4 and 5, so to speak. To avoid excessive repetition, we shall be referring to symbols and methods presented in those chapters whenever called for, for example in section 5.2, (Experimental) of Chapter 5. For further assistance with the symbols, the reader is kindly referred to the list of symbols and abbreviations presented at p. xiv-xv.
3.2 Evaluation of
from
An earlier article from this laboratory [9] described the method by which one evaluates the key parameter (in eV), the energy per precursor molecule that is central to the content of Chapter 5. It was derived from the energy difference, , associated with the precursor admixture to the 10 slm pure Ar carrier gas flow under the very same other experimental conditions (reactor geometry, applied high voltage (HV) frequency, amplitude, etc.). Chapter 4 presents the equivalent circuit model and MATLAB® program used to determine (in µJ), the energy dissipated in the pure AP DBD plasma during each applied a.c. HV cycle. An important required piece of information is therefore to present the intervening steps between , , and
.
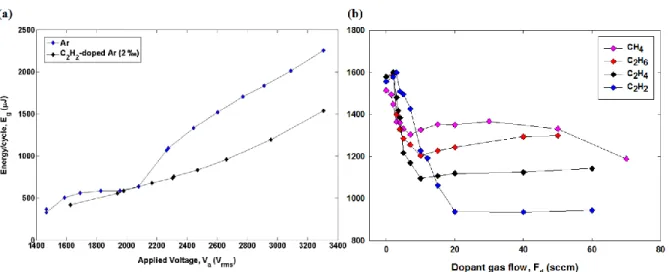
Figure 3.1. (a) Comparison of versus (rms) between pure Ar (F = 10 slm, upper curve) and acetylene-doped Ar ( = 20 sccm, lower curve) DBD plasmas at 20 kHz. (b) Plots of versus
precursor gas flow, , for Ar ( = 10 slm) DBD plasmas “doped” with hydrocarbons. The frequency was = 20 kHz and the applied voltage, 2.8 kVrms. Reproduced with permission
from [9].
Figure 3.1. (a) shows the curves for 20 kHz DBD plasmas, the upper and lower ones respectively corresponding to the pure Ar carrier gas (10 slm), and with addition of 20 sccm (2
‰) of acetylene (C2H2). For > 2400 Vrms; is seen to remain near-constant between the upper (pure) and lower, precursor loaded, branches. The next step was then to measure using
fixed parameters for = 2.8 kVrms, and = 20 kHz, while changing the concentration of the added reagent (“dopant”) gas flow, . This exercise was carried out not only for C2H2, but also for other hydrocarbons (CH4, C2H6, C2H4), resulting in the measurements shown in Figure 3.1. (b).
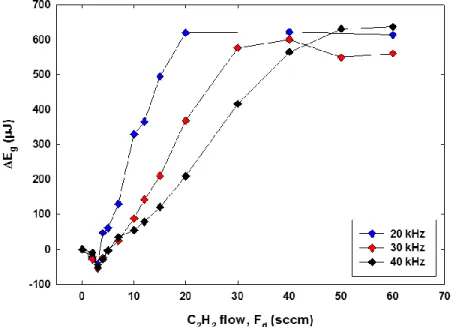
Figure 3.2. Plots of absorbed energy difference, , versus C2H2 flow, , for Ar ( = 10 slm) DBD plasmas at 20, 30 and 40 kHz. The applied voltage, , was 2.8 kVrms. Reproduced with
permission from [9].
The first, tentative, interpretation for the different hydrocarbon curves implied identifying the two regimes. For , a certain “critical” precursor flow rate, all molecules and most of their fragments undergo reaction during their residence time in the plasma zone, a condition that will be further addressed as the monomer-lean regime. For , a certain fraction may escape without reacting (completely), or by consuming energy via a different set of channels, hence resulting in a monomer-rich regime. To test this hypothetical interpretation, we now plot (Figure 3.2) values of , the energy difference (per cycle) between the case of pure Ar [~1600 µJ, see Figure 3.1.(a)] and Ar with a flow, of C2H2 additive, versus , corresponding to = 20, 30 and 40 kHz. We calculate the energy consumed per molecule under the presumed condition where all C2H2 molecules just appear to have been converted in the plasma, namely at
the very beginning of the plateau regions in Figure 3.2, corresponding to . For the case of 20 kHz, and during a one-second time interval, the total energy absorbed by the C2H2 molecules,
, is: (3.1)
Figure 3.2. shows that the plateau is reached at = 20 sccm; the corresponding number of molecules, , entering into the discharge zone is, at 295 K:
= , or, for the one-second time interval:
(3.2)
Therefore, energy consumed per molecule is, from (3.1) and (3.2):
(3.3)
From Figure 3.2., we note that for = 30 and 40 kHz, ~ 30 and ~ 40 sccm, respectively; therefore, the value = 9.0 remained constant for all three conditions. This tends to confirm the total conversion hypothesis proposed above. Considering that C≡C (~8.7 eV) bond-breakage occurs very close to the above-calculated value of 9 eV, it can be concluded that the methodology for evaluating (= ) is physically meaningful, a conclusion that subsequently proved reliable in a large variety of contexts (different families of organic molecules, of course including not only the hydrocarbons in Figs. 3.1. and 3.2. above, but also others) [9]. In the Appendix we present further examples of evaluations as they pertain to organic acids and other organic precursor compounds.
Having now provided adequate, detailed background information about evaluation of , it is possible to advance to presentations of Chapters 4 and 5.
CHAPTER 4
ARTICLE 1: ENERGETICS OF NOBLE GAS
DIELECTRIC BARRIER DISCHARGES: NOVEL RESULTS RELATED
TO ELECTRODE AREAS AND DIELECTRIC MATERIALS
Sean Watson, Bernard Nisol, Hervé Gagnon, Mylène Archambault-Caron,
Frédéric Sirois, Michael R. Wertheimer.
Article published in:
Energetics of Noble Gas Dielectric Barrier Discharges (DBD): Novel Results
Related to Electrode Areas and Dielectric Materials
Abstract— Two dielectric barrier discharge (DBD) reactors, one small, the other about 40 times
larger, associated equipment and a dedicated Matlab® code have been used to carry out precise determinations of electrical energy, , dissipated per discharge cycle of the applied a.c. voltage, .In the smallerreactor, this was done over the frequency range 5 ≤ ≤ 50 kHz and using twin pairs of several different insulating materials (2.54 cm diameter discs) with relative permittivities between 2.1 ≤ ≤ 9.5 as dielectric barriers in DBDs for 4 different gases: He, Ne, Ar and N2. In the large reactor, f was restricted to 20 kHz in Ar and He; this latter system primarily serves for plasma polymerization experiments in which organic “monomers” are admixed with the flow of Ar as carrier gas. We report the method for exactly evaluating , then present and compare values measured under different conditions. To the extent possible, these are compared between the small and large reactors, and with results published in the literature. The reliability of the method is confirmed, for example, by reproducing published breakdown fields of the gases examined, and by several other original results.
Index Terms— Dielectric barrier discharge (DBD); atmospheric pressure (AP); cold plasma;
small and large reactors; permittivity; noble gas; energy dissipation; APGD.
4.1 Introduction
Dielectric barrier discharges (DBD) for plasma processing at atmospheric pressure (AP) have been gaining importance because they obviate the need for costly vacuum systems. As indicated by its name, this discharge type, including AP glow discharges, APGD, may be obtained in gaps between two electrode surfaces where at least one of them is covered by a dielectric. In his well-known review article, Kogelschatz described in detail the physics of this thermodynamically non-equilibrium (cold) plasma, along with its uses in numerous plasma-chemical reactions such as ozone synthesis, surface modification of polymers, abatement of pollutants, and excimer lamps [18]
. More recently, AP DBDs have also gained prominence for the deposition of thin films [2, 25, 30]
and in so-called “plasma medicine” [31]. In most of these applications, it is essential that the gas (kinetic) temperature, T, remains near ambient, slightly above 300 K. We have shown that
reliable gas temperature measurements are best carried out by using fiber-optic thermometers [8, 32]
, but beside measuring T, it is clearly important for the operator of an AP plasma system to also know the exact amount of electrical power, P, delivered to the plasma and hence also to a substrate. Now, in many LP plasma systems (radio-frequency, r.f., or microwave), electrical power measurements can be carried out relatively accurately, albeit with some pitfalls and sources of uncertainty. But there is good reason to believe that, for power measurements in AP DBD plasmas, this is not the case. For example, many researchers use Q-V plots, also known as Lissajous figures [13, 34, 35, 45]. First introduced by Manley in 1943 [35, 37], this technique is now known to require considerable caution [35].
In two earlier articles [8, 9], we laid important groundwork for research that is presented here: in the first, we reported development of a precise method for measuring electrical energy input, , primarily into He APGD; combined with fiber-optic T measurements, it enabled us to perform a detailed calorimetric (heat balance) investigation. The second paper, reference [9], showed how , now measured in Ar DBD, could lead to , the average energy absorbed per molecule of a “dopant” gas or vapor from the Ar plasma “energy reservoir”, the dopant being introduced at typically ‰ concentration into the Ar carrier gas flow. This powerful new methodology gave rise to a subsequent, still ongoing, series of studies wherein the dopants, organic “monomer” molecules, led to deposition of thin plasma polymer film coatings [9, 15, 16].
Therefore, a key objective of the research presented here has been to further investigate and exploit the precise methods for measuring electrical energy input into noble gas DBD plasmas, , with the aid of the two above-mentioned home-built DBD reactors with very different characteristics [8, 9]. Surprisingly, little published work of this type can be found in the literature, but all is based on electrical modeling of the plasma discharges. The earliest reported values in He AP DBD were those of Decomps et al. [10], followed later by power density measurements of Nersisyan and Graham [11] Innovative aspects of the present work are not only to compare our unique Eg measurement technique among reactors of vastly differing sizes in this laboratory, using He and Ar along with different dielectric barrier materials, and then to compare those results with ones reported in the literature, but also to possibly use it as a tool for facilitating
industrial scale-up of DBD technology. The two DBD reactors used here are described in the following section.
4.2 Experimental Methodology
4.2.1 Dielectric Barrier Discharge Reactors
Two DBD plasma reactors, one small (electrode area, A = 5.1 cm2), the other much larger ( = 216 cm2) and ancillary systems are respectively depicted in Fig. 4.1 (a) and (b). Both have been separately described in earlier papers [8, 9], so this needs not be repeated here in detail. While the small reactor has mainly served for plasma diagnostics [8], the larger one is used for deposition of organic coatings, so-called plasma polymers, based on mixtures of a noble carrier gas (argon, Ar) and highly diluted admixtures of volatile hydrocarbons [56].
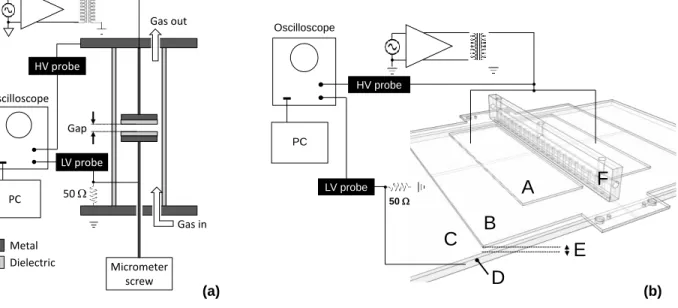
Figure 4.1. (a) Schematic diagram of the small DBD cell and associated components; (b) scale drawing of the large DBD reactor: upper electrodes (A); lower electrode (D); dielectric barriers
(B, C); discharge gap (2 mm) (E); gas injector / diffuser (F).
It is nevertheless important to briefly describe the electrical system: The upper electrodes in (a) and (b) were connected to a HV power supply comprising a variable-frequency a.c. generator (0.5 Hz to > 50 kHz, Hewlett-Packard 3310A), a power amplifier (QSC Ltd., Model RMX2450), an HV transformer (Enercon, Model LM2727-03), and an impedance matching transformer. The
Gas out Gas in Micrometer screw Gap 50 HV probe Metal Dielectric Oscilloscope PC LV probe (a) (b) 50 HV probe Oscilloscope PC LV probe C D E A F B
a.c. power supply voltage, , was measured using an HV probe (Tektronix P6015A). For both setups, the lower electrode was connected to ground via a 50 Ω precision resistor, which served to measure the discharge current pulse amplitude and shape.
It is of interest to examine how the energy stored in the capacitor, , representing the series combination of both (top and bottom) dielectric barriers and the gap, might affect the value of . The charge of this capacitor is related to the potential by the following equation:
(4.1)
(4.2) In (4.2), represents the permittivity of vacuum; is the relative permittivity; is the area; is the thickness and subscripts , and respectively correspond to the top, bottom and gap (gas) dielectrics. When the top and bottom dielectrics are the same , and ), (2) simplifies to:
(4.3)
The energy stored in a capacitor charged up to a potential of is given by:
(4.4) Clearly, both and determine , hence they most likely also affect . Accordingly, we have investigated a series of different dielectrics with 2.1 ≤ ≤ 9.5 but constant thicknesses, (see Table 4.1). The method for evaluating the electrical energy dissipated in the gas discharge per cycle, , will be presented in the following sub-section. In order not to “overload” the content of this article, we elect not to report diagnostic measurements
other than electrical ones ( , , and their dependence on time, , and frequency, ); the interested reader may find other types of diagnostic measurements, for example (gas) temperature [8] and optical emission spectroscopy [15] in other publications from this laboratory.
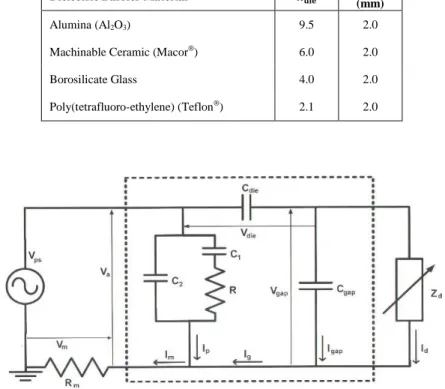
Table 4.1 Relative permittivities ( ) and thickness ( ) of dielectrics used in this research.
Dielectric Barrier Material (mm)
Alumina (Al2O3) 9.5 2.0
Machinable Ceramic (Macor®) 6.0 2.0
Borosilicate Glass 4.0 2.0 Poly(tetrafluoro-ethylene) (Teflon®) 2.1 2.0
Figure 4.2. Equivalent electrical circuit diagram; the portion in the dashed rectangle represents the discharge cell. m = 50 Ω; see text for further details.
4.2.2 Equivalent Circuit Model and Energy Computation
Fig. 4.2 presents the equivalent electrical circuit model for both experimental set-ups, small and larger A DBD reactors, while the portion inside the dashed rectangle corresponds only to the actual discharge cell. and correspond to the voltage signals respectively measured by the aforementioned high- and low-voltage probes. is a 0.1% precision 50 Ω resistor, is a non-linear variable impedance; its value, although unknown with precision, tends toward zero during discharges and toward infinity between discharge events.
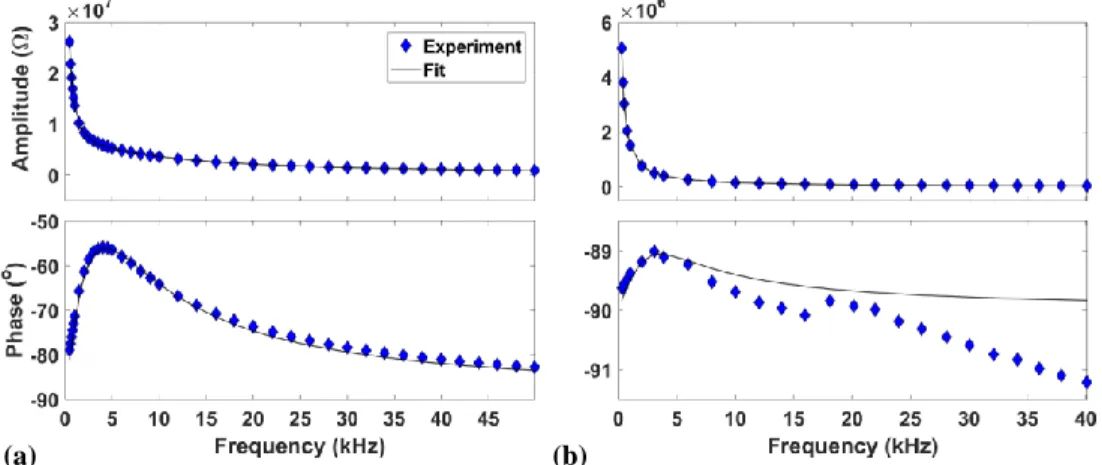
In both cases, parameters , , , , and were derived from separate sets of nominally identical and measurements, but obtained when the cells were open to atmospheric air and therefore no discharges were present on account of the high breakdown voltage of air. From these and measurements, and were calculated. These sets of and measurements in air without discharges were repeated for frequencies, , varying from 0.5 up to 40 or 50 kHz. As shown in Fig. 4.3, the amplitudes and phases of , when plotted as a function of for typical scenarios, quite precisely follow the theoretical response corresponding to the model, Fig. 4.2, over the entire frequency range.
Figure 4.3. Characteristics (amplitude and phase) of the (a) small; and (b) large DBD reactors, as a function of frequency, , of the same applied a.c. voltage ( ) as during He or Ar discharges (measured at 100 kPa in air, where no discharges are present). The continuous curves through the
data points represent the best fits to the presented equivalent circuit model. In (b), notice that deviations in phase angle are only about 1°.
Fig. 4.3 shows graphical comparisons with experimental data points for both the small (a), and large (b) DBD reactors; the best fits obtained from the equivalent , , , , and models are quite remarkable. Knowing the dimensions of the dielectrics, the gap spacing and the relative permittivities of the dielectric materials, die and gap can be calculated. Table 4.2 summarizes numerical values corresponding to Fig. 4.3 for both the small and large reactors. Not unexpected, the phase angle in (a) varies widely (from ca. 55 to 82º between 3 and 50 kHz), while that in (b), between 89 and 91º in the same frequency range, deviates little from 90º, which
corresponds to the ideal response anticipated for this large-area planar, low-loss capacitor. We shall return to these characteristics later in the text.
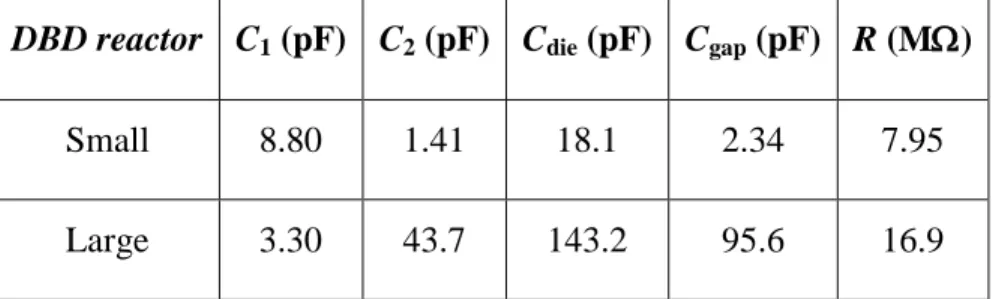
Table 4.2 Values of the equivalent circuit model elements, Fig. 3.*
DBD reactor C1 (pF) C2 (pF) Cdie (pF) Cgap (pF) R (M)
Small 8.80 1.41 18.1 2.34 7.95
Large 3.30 43.7 143.2 95.6 16.9
*Values for the small reactor pertain to alumina dielectric; large reactor: Macor® + glass (invariable).
By applying Kirchhoff’s laws to the equivalent circuit in Fig. 2, the following equations are obtained:
The voltage across the cell is given by:
(4.5)
The measured current corresponds to:
(4.6)
To calculate the gas current , we need to compute the parasitic impedance and current :
(4.7)
(4.8)
(4.9)
(4.10)
(4.11)
Calculating the gap current requires first to compute the gap impedance, :
(4.12) (4.13)
The discharge current is obtained by:
(4.14)
Finally, the electrical energy dissipated in the gas discharge per cycle, , is:
(4.15)
Here is the number of complete cycles at the applied voltage frequency.
4.3 Experimental Results and Discussion
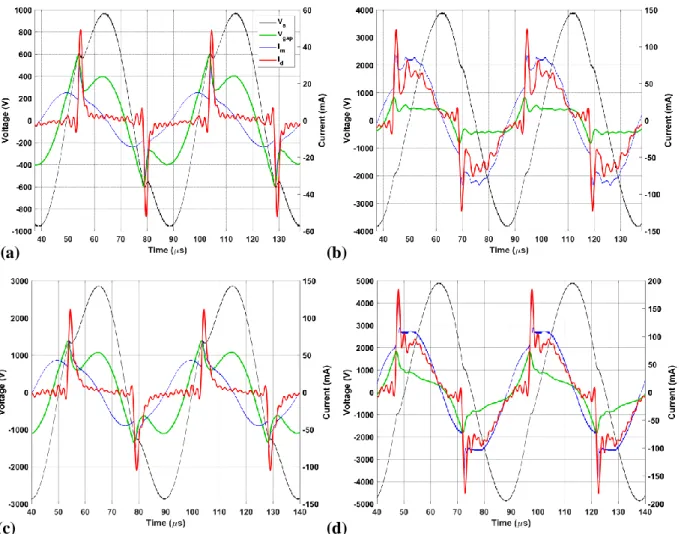
Fig. 4.4 (a) to (d) present typical examples of measured ( , ) and calculated ( , ) electrical signals obtained in the large DBD reactor for the cases of noble gas discharges, respectively He (a, b) and Ar (c, d), under the listed experimental conditions. While (a) shows the well-documented features of APGD in He gas [18, 25], namely single, short-duration (< 5 µs) current peaks per a.c. half-cycle, (b) also manifests “glow” behavior in He at higher , where multiple discharge peaks occur per half-cycle, termed “pseudoglow” by Radu et al. [7]. Clearly, the DBD here occupies a much larger fraction of the a.c. half-period. According to the literature, Ar DBD is expected to be filamentary, unless the Ar is “doped” with certain vapors or gases such as a ketone like acetone, or ammonia [25]. While, in the small reactor, filamentary behavior did prevail with pure Ar, in the large reactor, very similar characteristics as for He (a, b) could be observed for pure Ar under practically all experimental conditions [see Fig. 4.4 (c, d)]. Experience in our laboratory has also shown that all but a few highly electronegative “dopant”
additives result in APGD-type behavior like that in (c, d), including O2 [16]. To the best of our knowledge, these observations for the case of Ar DBD are so far unreported by others.
Figure 4.4. Typical examples of measured ( , ) and calculated ( , ) electrical signals of multiple (two) periods of DBD in the large reactor: (a, b) APGD in He ( = 20 kHz, = 2
mm); (a) = 675 Vrms: (b) = 2.8 kVrms; (c, d) APGD in Ar ( = 20 kHz, = 2 mm); (c) = 2.0 kVrms ; (d) = 3.3 kVrms. The characteristics of the large reactor, for example the
dielectric barrier materials, are described in sub-section 4.2.1.
Using eq. (2), it is possible to evaluate the energy dissipated per cycle of the applied a.c. voltage, as illustrated in Fig. 4.5 for the case of He discharges in the small reactor, where different pairs of dielectric barrier materials have been utilized.
(a) (b)
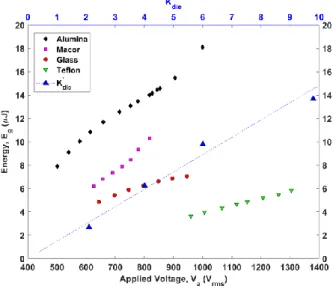
Fig. 4.5 shows “quasi-linear” increases in with rising , albeit with differing “slopes” and over different ranges. These quasi-linear characteristics are not unexpected, considering the continuous “APGD-like” behavior of He with rising as described in Fig. 4.4. Nevertheless, the main feature of Fig. 4.5 that we wish to underline here is the following: while the Al2O3 dielectric permitted experimentation over a wide range of values, this was not the case for the other materials because arcing tended to occur at higher . This can be explained by the fact that a lower voltage drop occurs at the dielectric materials and, therefore, a larger proportion of is present at the gap when using materials with higher relative permittivities, . The set-up is therefore more efficient at applying higher voltages through the gap for a given applied voltage when using higher- materials. It also emerges clearly that at any given , values of rise almost proportionately with ; this is illustrated in Fig. 4.5 by the superposed plot of versus for the case of = 800 Vrms. This is the first such experimental demonstration, to the best of our knowledge [8].
Figure 4.5. Plot of versus (Vrms) for He APGD at = 20 kHz in the small reactor; different dielectric barrier materials of the same thickness, = 2.0 mm, gap width, = 2.0
mm, and He flow, = 3.1 L/min, were maintained constant throughout. The uncertainty of values is estimated at < 10%, on the basis of multiple repetitions. The superimposed straight-line
plot of versus represents values at = 800 Vrms, which for PTFE (Teflon®) was obtained by downward extrapolation.
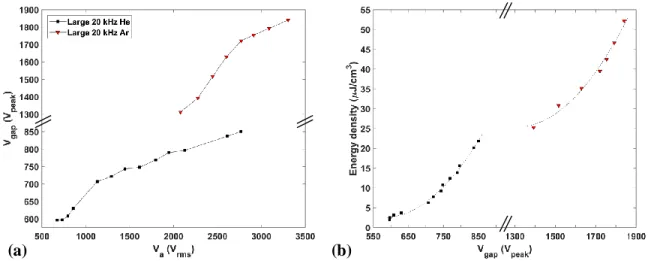
Capacitive edge and other parasitic effects dominated electrical behavior of the small reactor, as illustrated by the phase angles presented in Fig. 4.3, while this was clearly not the case for the large reactor. To test this hypothesis, we first calculated and plotted versus data for the large reactor in Fig. 4.6 (a), then versus in (b), for both He and Ar DBD. Note that the values of being discussed here correspond to the maximum values of the green-colored traces in Fig. 4.4.
Figure 4.6. (a) Plots of versus , and (b) of versus for He and Ar DBD measurements conducted using the large reactor, where v is the plasma volume and the dielectrics
are specified in the sub-section 4.2.1. In (b), the dotted line corresponds to a quadratic fit.
Several important observations can now be made on the basis of Fig. 4.6: First and foremost, the most relevant value of voltage that ought to be considered for characterizing DBD physics is rather than , and the relationship between these two is clearly quite non-linear [see (a)]. Indeed, the plot of versus , Fig. 4.6 (b), is here seen to display a quadratic behavior for both He and Ar DBD.
It is also of interest to examine a possible relationship between energy stored in the dielectrics and gap capacitors (eq. (4.1)) and the energy dissipated in the DBD plasma. If we recall the physics of an ideal (lossless) capacitor fed by an applied sinusoidal voltage, power
at any instant of the voltage period is given by:
(4.16)
Integrating over a full cycle yields a net value of zero, because energy stored in the capacitor by the power source during the first quarter-period is returned in full during the second, and the same process repeats for the third and fourth quarter-periods, but with the opposite voltage polarity. Thus, one can estimate the maximum value of energy stored in the capacitors (dielectrics and gap) by integrating over the first quarter-period, where the positive discharge occurs. Taking the lowest peak values of presented in Fig. 4.6, namely 955 and 3220 Vpeak in He and Ar, respectively, and using eq. (4.1), we compare calculated and measured energy densities per half-period, , where v = 43.2 cm3
is the plasma volume. The dielectrics in the large reactor were comprised of two different materials: glass ( = 4.0, = 3.0 mm) and Macor® ( = 6.0, = 3.5 mm). The parameters for the gap in the large reactor were: ≈ 1.0, = 2.0 mm, and = 216 cm2. Respective numerical values of for He and Ar calculated using eq. (4.1), 0.30 and 3.44 µJ/cm3, are roughly 3 and 4 times smaller than corresponding measured values of in Fig. 4.6 (b), ca. 0.95 and 12.6 µJ/cm3
, respectively. The obvious conclusion is that, while the discharge is active, most of the energy is provided by the a.c. power supply. However, it is interesting to compare those values from eq. (4.1) of energy stored in the dielectric and gap capacitors with what we shall call the “power boost” that can be observed in Fig. 4.4; this occurs when the discharge is initiated and the associated current is larger than the measured current coming from the a.c. power supply. The energy density of this “power boost” can be estimated by integrating over the period when using the following formula:
(4.17)
Using the same data as for the preceding calculation, eq. (4.4) yields respective values for He and Ar of 0.29 and 0.88 µJ/cm3. These are clearly comparable with the ones presented above (0.30 and 3.44 µJ/cm3); this supports our hypothesis that observed values at discharge
![Figure 1.1. DBD reactors used in 3 different applications: (a) low-pressure system, reprinted with permission from [1] , (b) atmospheric pressure plasma torch configuration (© Surfx Technologies LLC, used with permission), (c) atmospheric pressure plana](https://thumb-eu.123doks.com/thumbv2/123doknet/2351754.36441/18.918.115.804.417.596/different-applications-permission-atmospheric-configuration-technologies-permission-atmospheric.webp)