HAL Id: hal-00000715
https://hal.archives-ouvertes.fr/hal-00000715
Submitted on 13 Oct 2003
HAL is a multi-disciplinary open access
archive for the deposit and dissemination of
sci-entific research documents, whether they are
pub-lished or not. The documents may come from
teaching and research institutions in France or
abroad, or from public or private research centers.
L’archive ouverte pluridisciplinaire HAL, est
destinée au dépôt et à la diffusion de documents
scientifiques de niveau recherche, publiés ou non,
émanant des établissements d’enseignement et de
recherche français ou étrangers, des laboratoires
publics ou privés.
Sulphur-bearing species in the star forming region
L1689N
Valentine Wakelam, Alain Castets, C. Ceccarelli, B. Lefloch, E. Caux, L.
Pagani
To cite this version:
Valentine Wakelam, Alain Castets, C. Ceccarelli, B. Lefloch, E. Caux, et al.. Sulphur-bearing species
in the star forming region L1689N. Astronomy and Astrophysics - A&A, EDP Sciences, 2004, 413,
pp.609-622. �10.1051/0004-6361:20031572�. �hal-00000715�
ccsd-00000715 (version 1) : 13 Oct 2003
Astronomy & Astrophysics manuscript no. 2789.hyper14031 October 13, 2003 (DOI: will be inserted by hand later)
Sulphur-bearing species in the star forming region L1689N
V.Wakelam
1, A.Castets
1, C.Ceccarelli
1,2, B.Lefloch
2, E.Caux
3and L.Pagani
41
Observatoire de Bordeaux, BP 89, 33270 Floirac, France
2
Laboratoire d’Astrophysique, Observatoire de Grenoble - BP 53, F-38041 Grenoble cedex 09, France
3
CESR CNRS-UPS, BP 4346, 31028 - Toulouse cedex 04, France
4
LERMA & FRE 2460 du CNRS, Observatoire de Paris, 61, Av. de l’Observatoire, 75014 Paris, France Received ; accepted
Abstract.We report observations of the expected main S-bearing species (SO, SO2 and H2S) in the low-mass
star forming region L1689N. We obtained large scale (∼ 300′′x200′′) maps of several transitions from these
molecules with the goal to study the sulphur chemistry, i.e. how the relative abundances change in the different physical conditions found in L1689N. We identified eight interesting regions, where we carried out a quantitative comparative study: the molecular cloud (as reference position), five shocked regions caused by the interaction of the molecular outflows with the cloud, and the two protostars IRAS16293-2422 and 16293E. In the cloud we carefully computed the gas temperature and density by means of a non-LTE LVG code, while in other regions we used previous results. We hence derived the column density of SO, SO2 and H2S, together with SiO and H2CO
- which were observed previously - and their relevant abundance ratios. We find that SiO is the molecule that shows the largest abundance variations in the shocked regions, whereas S-bearing molecules show more moderate variations. Remarkably, the region of the brightest SiO emission in L1689N is undetected in SO2, H2S and H2CO
and only marginally detected in SO. In the other weaker SiO shocks, SO2 is enhanced with respect to SO. We
propose a schema in which the different molecular ratios correspond to different ages of the shocks. Finally, we find that SO, SO2and H2S have significant abundance jumps in the inner hot core of IRAS16293-2422 and discuss
the implications of the measured abundances.
Key words.ISM: abundances – ISM: molecules – Stars: formation – ISM: individual: L1689N, IRAS16293-2422
1. Introduction
Low mass star forming regions are composed by at least three main ingredients: the molecular cloud from which protostars are born, the protostars themselves, and the shocked regions at the interface between the cloud and the outflows emanating from the protostars. These three regions have very different physical conditions, where tem-perature, density and also chemical abundances greatly differ (e.g. van Dishoeck & Blake 1998). This paper fo-cuses on the abundance changes occurring to the S-bearing molecules and the relevant sulphur chemistry. Depending on the physical condition of the gas, it is believed that different types of reactions play a role in the formation of sulphur-bearing molecules. In molecular clouds, ion-molecule reactions are the most important (Oppenheimer & Dalgarno 1974; Prasad & Huntress 1982; Millar & Herbst 1990), whereas in the warm gas of the hot cores and shocks, neutral-neutral reactions play the major role in forming sulphur species (Pineau Des Forˆets et al. 1993; Charnley 1997; Hatchell et al. 1998; Keane et al. 2001).
Send offprint requests to: wakelam@observ.u-bordeaux.fr
Specifically, in warm gas, the abundances of H2S, SO and
SO2are supposed to increase significantly. This is the
rea-son why they are often used to trace shocks (Pineau Des Forˆets et al. 1993; Chernin et al. 1994; Bachiller & Perez Gutierrez 1997). And because of the relatively fast evolu-tion of their chemistry, on time scale of tens of thousand years, they are good candidates to be chemical clocks to study the evolution of outflows (Bachiller et al. 2001) and hot cores (Charnley 1997; Hatchell et al. 1998). Overall, it is widely accepted that in star forming regions the forma-tion of S-bearing molecules is largely determined during the cold collapse phase, when atomic sulphur freezes out on grains and probably forms H2S. When the protostar
starts to heat its environment, H2S evaporates and it
re-acts with hydrogen atoms to give sulphur atoms. S rapidly reacts with OH and O2to form SO, that in turn gives SO2
by reacting with OH (e.g. Charnley 1997).
In this paper, we present large scale maps of several transitions of SO, SO2 and H2S in the molecular cloud
L1689N, a molecular cloud located in the ρ Ophiuchi cloud complex at 120 pc from the Sun (Knude & Hog 1998). Based on atomic oxygen observations, Caux et al.
(1999) found that the gas temperature in this cloud is (26 ± 0.5) K and the H2 density is larger than 3 ×10⁴
cm−3. L1689N harbors two young protostellar sources.
The first one is IRAS16293-2422 (hereinafter IRAS16293), a Class 0 protostar (15 L⊙) still in the accretion phase
(Walker et al. 1986; Zhou 1995; Narayanan et al. 1998; Ceccarelli et al. 2000a). Like many other young protostars, IRAS16293 is a binary system with a total mass around 1.1 M⊙ (Looney et al. 2000), whose two sources are
sep-arated by 5′′, namely a projected separation of 600 AU.
The structure of the envelope surrounding IRAS16293 has been reconstructed based on multifrequency H2O, SiO, O
and H2CO line observations (Ceccarelli et al. 2000a,b).
In the outer region (r ≥ 150AU), the envelope gas shows molecular abundances typical of cold molecular clouds. In the inner region (r ≤ 150AU, i.e. about 2′′in diameter) the
abundances of H2O, SiO and H2CO jump to abundances
typical of the hot cores around massive protostars. This structure has been recently confirmed by Sch¨oier et al. (2002), who modeled the continuum and the line emis-sion from several other molecules. The second protostar, 16293E, is a recently discovered low mass and very young Class 0 source situated South-East of IRAS16293. It was detected first by Mizuno et al. (1990) as a strong NH3peak
emission. Its protostellar nature is discussed in Castets et al. (2001, hereinafter CCLCL01).
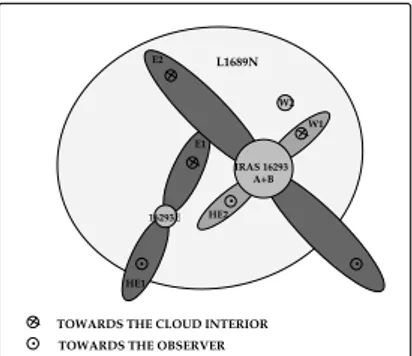
The L1689N region is complex and has long been known to house multiple outflows (Fukui et al. 1986; Wootten & Loren 1987; Mizuno et al. 1990; Hirano et al. 2001). The recent work by CCLCL01 claims that the two protostars IRAS16293 and 16293E drive three bipolar out-flows. Two of them originate from each of the two com-ponents of IRAS16293, while the third outflow probably emanates from 16293E (Fig. 1). In the present article we will adopt the scheme outlined in CCLCL01 (Fig. 1), but our main conclusions are substantially unaffected by the actual evolutionary stage (pre-stellar or protostellar) of 16293E, questioned in Lis et al. (2002). What is important in the following discussion is the presence in L1689N of at least one protostar, IRAS16293, and six regions which shows an enhancement of SiO and/or H2CO emission, and
that are sites of shocked gas marked as E1, E2, HE11,
HE2, W1 and W2 (Fig. 1). In particular, CCLCL01 found that the brightest site of SiO emission, E2, does not show up any H2CO enhanced emission, whereas the brightest
H2CO emission site, E1, is also accompanied by strong
SiO emission. HE2 and HE1 represent a third class, for only H2CO emission is detected there and no SiO. The
goal of the present work is to study how the abundances of S-bearing molecules change in all these sites, compared with the abundances in the IRAS16293 protostar and in the cloud.
The article is organized as follows. The observations are presented in Sect. 2, the results are presented in Sect. 3, and the column density determinations are detailed in
1
This region is not considered farther in this work because too weak.
16293E
TOWARDS THE OBSERVER
IRAS 16293 W2 E2 E1 HE1 HE2 W1 A+B L1689N
TOWARDS THE CLOUD INTERIOR
Fig. 1. Sketch of the region seen face on. The dark grey outflows have been clearly identified by CCLCL01. Light gray used for the outflow emanating from IRAS16293 and the W2 source indicates that these are only assumptions.
Sect. 4. In Sect. 5 we discuss the results, i.e. the observed changes of SO, SO2 and H2S abundances with respect to
the previously measured SiO and H2CO abundances and
what this may teach us.
2. Observations
Observations of large scale maps and specific positions in-side the L1689N region were performed with the IRAM and SEST telescopes. We measured the emission of the following molecules: SO (32 → 21 and 65 → 54
tran-sitions), SO2 (51,5 → 40,4 transition) and H2S (22,0 →
21,1 and 11,0 → 10,1 transitions). We also observed the
34SO 3
2→ 21line in a few positions in order to estimate
the opacity of the main isotopic line. The coordinates (∆α, ∆δ) of all maps shown here are offsets relative to the position of the 16293B component of the binary sys-tem IRAS16293 at α(2000.0) = 16h32m22s.6, δ(2000.0) = -24028′33′′ (the 16293A component is located 4′′South
and 2′′East from the B component - Looney et al. 2000).
In June 1997 we obtained a map covering 120′′
× 100′′
in the SO2 molecular line with the IRAM-30m telescope.
In November 2001, May and September 2002 we per-formed additional IRAM observations of the SO2, 34SO
and H2S 11,0 → 10,1 lines at some specific positions in
L1689N, namely the shocked regions E1, E2, W1, W2 and HE2 (see Fig. 1 and the Introduction), the two protostars IRAS16293 and 16293E, and the molecular cloud (at the position ∆α = 120′′, ∆δ = 0′′). In the following we will
refer to these eight positions as the “key” positions. The SEST telescope was used in July 1998 to map an area cov-ering 300′′
× 200′′ in the SO molecular lines and to map
a smaller area covering 120′′
× 100′′ in the H
2S
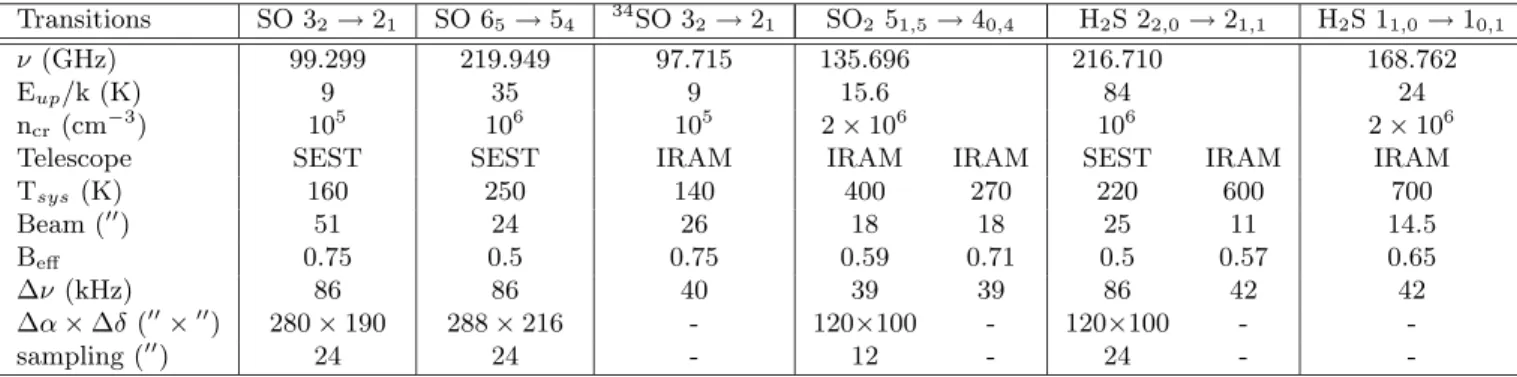
molecu-lar transition. Table 1 summarizes the different observed molecular transitions, together with their frequencies and upper level energies.
All data were obtained in the position switching mode with an OFF position located at ∆α = -180′′, ∆δ = 0′′
from the center of IRAS16293. Using the frequency switch-ing mode we checked that this position is free of any C18O
Nyquist sampled, we smoothed our data to the largest beamsize when necessary, which is accurate enough, ex-cept in the case of pathological source morphologies. Both with the IRAM and SEST telescopes, pointing and focus was checked every 2 hours, using planets, maser sources and strong extragalactic continuum sources. The point-ing corrections were found to be always smaller than 3′′
and 5′′ with the IRAM and SEST telescopes respectively.
Polynomial baselines of order 3 or less have been sub-tracted from the spectra. The observing parameters for both telescopes are listed in Table 1. In the following, all intensities will be given in main-beam brightness temper-atures. Below we give some information which are specific to the IRAM-30m and SEST observations.
IRAM Observations: The IRAM 30–meter telescope is located at an altitude of 2920 meters near the sum-mit of Pico Veleta in Southern Spain. The34SO 3
2→ 21,
SO2 and H2S molecular emissions were observed
simul-taneously with the 3, 2 and 1mm SIS receivers respec-tively, available at the IRAM-30m. The SO2 emission
ob-served in June 1997 was obob-served simultaneously with other molecular transitions not presented here. The image sideband rejections of all receivers were always higher than 10 dB. Typical system temperatures were in the range Tsys ∼ 300 − 600 K. The three receivers were connected
to units of the autocorrelator, set to provide spectral res-olutions of 40, 40, and 80 kHz at 98, 136, and 217 GHz respectively. At those frequencies, the velocity resolutions are of the order of 0.1 - 0.2 km s−1.
SEST Observations:The SEST telescope is a 15–meter single dish millimeter telescope operated jointly by ESO and a consortium of Swedish institutions. It is located at an altitude of about 2450 meters in La Silla (Chile). To obtain the SO and H2S maps shown here, we used the dual
3/1.3mm receiver. System temperatures were in the range Tsys∼ 300−500 K. This receiver was always connected to
the high resolution acousto-optical spectrometer available at SEST, which provides 2048 channel of 43 kHz width giving a 86 kHz spectral resolution. At the frequencies considered here, that corresponds to a velocity resolution of 0.1 – 0.2 km s−1, comparable to that of the IRAM data.
3. Results
Figure 2 shows the velocity-integrated intensity maps of the SO 32→ 21, SO 65→ 54 and SO2 51,5→ 40,4 lines.
The spectra (not smoothed) of the six transitions of Table 1 observed towards the “key” positions are displayed in Fig. 3, and the relevant line parameters are reported in Table 2. The SiO 2 → 1 observations, published by CCLCL01, have been added on Fig. 3 and in Table 2 for comparisons.
The main-beam brightness peak temperature TMB,
and the linewidth ∆v (FWHM) of Table 2 were estimated from a gaussian fit to the whole line profile, even in the case where profiles are double-peaked. We also estimated the width of the equivalent gaussian with the same inte-grated and peak intensity as the observed line and found
that the two methods differ by less than 30% with the ex-ception of the SO 65→ 54 line in W1 which has an
equiv-alent width of 2.5 km s−1(versus 1.3 km s−1 in Table 2).
On the contrary, the velocity-integrated intensity is the area integrated in the interval of velocities at the “zero-intensity” level. The velocity vLSR is the velocity at the
peak or at the absorption dip for double-peaked profiles. They are roughly the same for each observed transition and position, with the exception of E2(HVC), whose emis-sion is red-shifted by ∼ 6 km s−1.
The first remarkable result is that, against probably naive expectations, the shocked regions are not necessar-ily associated with evident enhancements of the emission of the observed SO, SO2 and H2S lines. For example,
the E2 region, the brightest SiO 2-1 emission peak (see CCLCL01) is undetected in SO2, and only marginally
de-tected in the lowest SO transition.
The second result is that IRAS16293 is the only site where all the molecular lines have been detected, including the high-energy transition H2S 22,0→ 21,1. Quite
interest-ingly, we find that not only the line profiles are broader than in the cloud but their widths tend to increase with the upper energy level of the transition. We will discuss in the §5 the implication of this behavior.
We now discuss in more detail the results toward the eight “key” positions.
3.1. SO emission
The SO 32→ 21 emission is relatively bright (∼ 3 K) all
over the cloud (Figs. 2 and 3). All the line profiles are relatively narrow (with linewidths ranging between 1 and 2 km s−1) and peak around the systemic cloud velocity
at vlsr = 3.9 km s−1. The absorption dip around the
sys-temic velocity seen towards IRAS16293 is probably due to the absorption by foreground material, as also seen in the H2CO transitions (Loinard et al. 2001). On the other
hand, the absorption dip seen in the 34SO towards W1
may point to a very large SO column density in that di-rection or two different kinematic components. The con-trast of the velocity-integrated SO molecular emission at the various positions in the cloud is relatively low: the emission peaks towards IRAS16293 but otherwise it is widespread in the region between W1 and E2 (Fig. 2). Remarkably, there is not a much brighter SO 32→ 21
emission towards the shocked regions with respect to the molecular cloud. The only two clear exceptions are rep-resented by E1 and E2, where a high velocity component appears in the low energy SO transition (Fig. 3). In the fol-lowing we will analyze separately the E2 low velocity com-ponent centered at 3.9 km s−1(hereinafter E2(LVC)), and
the E2 high velocity component at 10 km s−1(hereinafter
E2(HVC)), because the two components can be clearly disentangled. On the contrary, in E1 the situation is less clear and hence we didn’t pursue a separated analysis of the two components. We emphasize that the E2(HVC) component is detected at more than 3 RMS all along the
Fig. 2. Integrated intensity maps of SO 32→ 21(a), SO 65→ 54(b) and SO2 51,5→ 40,4(c). (a) and (b) : first level
is 0.5 K km s−1 with level step of 1.0 K km s−1. (c) : first level is 0.3 K km s−1 with level step of 1.0 K km s−1.
In each map, the black points represent the observed positions. The two stars symbols show the position of the two protostellar sources. The arrows point to the eight “key” positions, whose spectra are displayed in Fig. 3.
Transitions SO 32ջ21 SO 65ջ54 34SO 32ջ21 SO251,5ջ40,4 H2S 22,0ջ21,1 H2S 11,0ջ10,1 ν (GHz) 99.299 219.949 97.715 135.696 216.710 168.762 Eup/k (K) 9 35 9 15.6 84 24 ncr(cm−3) 10 5 106 105 2 · 106 106 2 · 106
Telescope SEST SEST IRAM IRAM IRAM SEST IRAM IRAM
Tsys (K) 160 250 140 400 270 220 600 700 Beam (′′) 51 24 26 18 18 25 11 14.5 Beff 0.75 0.5 0.75 0.59 0.71 0.5 0.57 0.65 ∆ν (kHz) 86 86 40 39 39 86 42 42 ∆α · ∆δ (′′·′′) 280 · 190 288 · 216 - 120·100 - 120·100 - -sampling (′′) 24 24 - 12 - 24 -
-Table 1. Observed molecules together with the observing parameters. The critical densities (ncr) are computed for
temperatures between 50 and 100 K using the collisional coefficients quoted in Sect. 4. The area mapped (∆α × ∆δ) in each transition and the sampling of the map are reported in the last two lines. Beff is the beam efficiency of the
telescope. The symbol “-” implies that only observations towards the “key” positions have been obtained.
red lobe of the outflow and it is also observed in the SiO transitions (CCLCL01). This high velocity component is not seen in SO 65→ 54 probably because of unfavorable
excitation conditions. Indeed, we will show in the next sec-tion that the gas density in E2(HVC) is lower than in the ambient gas (see Table 3). This fact, already recognized by CCLCL01, leads to the supposition that the E2(HVC) may represent the wind shock, whereas the lower velocity component, E2(LVC), may trace the so called cloud shock (Hollenbach 1998). Finally, we also see hints of red and blue wings originating from the molecular outflows driven either by IRAS16293 or 16293E in the direction of W1, E1 and HE2 whereas no wing is seen in W2.
In the higher energy line SO 65→ 54 the emission is
peaked towards IRAS16293 and W1 (cf. Fig. 2) while the emission from the cloud is, as expected, weak. Relatively strong emission is also detected around E1. Moreover, the SO 65→ 54 spectra in those positions have pronounced
red and blue wings. The same happens in HE2 where the SO 65→ 54spectrum shows clearly the presence of a blue
wing. The emitting region around IRAS16293 has a char-acteristic size of α×δ = 39′′x 16′′ namely it is not resolved
in δ. Finally, the observed SO spectra towards 16293E are similar to those in the cloud: narrow, intense in the SO 32→ 21 transition and weak in the SO 65→ 54
tran-sition, and no signs of wings are evident. Overall, 16293E does not seem to have any enhanced SO emission com-pared with the cloud.
3.2. SO
2and H
2S emission
Unlike the SO 32→ 21 , the SO2 51,5 → 40,4 emission
is limited to a few spots (see Figs. 2 and 3), specif-ically toward IRAS16293, E1 and W2, probably be-cause of the excitation conditions (the critical density of the SO2 51,5 → 40,4 transition is about 20 times the
SO 32→ 21 critical density). Unfortunately, because of
the lack of other observations around W2 we have no idea of its extent. Remarkably, no significant SO2 emission is
detected towards E2. SO2 has also been detected at the
cloud position. The linewidth (1.4 km s−1) is equivalent to
that of N2H+1 → 0 – a good tracer of extended, cold and
quiescent gas – observed at the same position (CCLCL01). Probably because of similar critical densities, the SO2 51,5 → 40,4 and SO 65→ 54emission shows up in the
same regions. In addition, with the exception of E1, the SO2 51,5 → 40,4spectra show characteristics similar to the
SO 65→ 54 spectra, like for example the linewidth, in
all “key” positions. On the contrary, in E1 the SO line profiles are characterized by a strong ambient component with blue- and redshifted wings of much lower brightness, whereas the high-velocity component appears as bright as the ambient component in the SO2line, so that the whole
SO2 51,5 → 40,4 linewidth is approximately twice that of
the SO 65→ 54 .
IRAS16293 is the only position where H2S 22,0 → 21,1
has been detected. The line is relatively bright and rather broad (∆v = 5.0 km s−1). There is no emission detected
in shocks nor in the ambient cloud. Conversely, the lower H2S transition, observed only toward IRAS16293, 16293E
and the cloud, has been detected in all these positions with a double-peaked profile towards the protostars and possibly the cloud position. The absorption dip is likely due to the optical depth of the line. In fact, Minh et al. (1991) have observed the same H2S transition towards
sev-eral star forming regions and found an opacity of ∼10 for similar column densities.
3.3. Comparison with SiO
Contrary to the sulphur bearing species, the emission of SiO 2 → 1 is stronger in the shocked regions than to-wards IRAS16293. The spectra in E1 and W1 show high velocity wings much more marked than for the SO and SO2 lines. The high velocity component of E2 seen in
SO 32→ 21 is very strong in SiO 2 → 1 and have
sim-ilar ∆v (∼ 6.5 km s−1) and v
LSR(∼ 10 km s−1) for these
SO SO 34 SO SO2 H2S H2S SiO 32ջ21 65ջ54 32ջ21 51,5ջ40,4 22,0ջ21,1 11,0ջ10,1 2 ջ 1 IRAS TM B 2.90.1 3.70.1 0.30.1 1.10.1 0.50.04 6.20.6 0.350.05 16293-2422 ∆v 2.00.1 3.90.0 2.80.5 4.20.2 5.00.2 3.00.0 5.00.4 vLSR 4.0 3.9 3.9 3.9 3.3 3.9 4.2 R TM Bδv 8.01.2 16.02.5 1.00.3 4.60.9 3.00.5 17.5 3.2 1.90.1 TM B 3.40.1 1.20.2 - - ≤0.2 1.10.1 -16293E ∆v 1.00.0 0.80.1 - - - 1.20.1 -vLSR 3.7 3.7 - - - 3.9 -R TM Bδv 3.80.6 1.00.2 - - ≤0.1 0.6 0.1 -TM B 2.90.1 2.40.2 0.50.1 0.70.1 ≤0.2 - 1.10.1 E1 ∆v 1.80.2 1.60.1 1.20.1 3.10.1 - - 2.80.1 vLSR 4.0 3.8 3.9 4.0 - - 3.6 R TM Bδv 7.31.2 5.61.0 0.80.2 2.20.4 ≤0.3 - 3.30.3 E2 TM B 2.40.2 1.10.2 0.90.04 ≤0.2 ≤0.4 - 0.530.06 LVC ∆v 1.30.1 0.90.1 0.50.02 - - - 3.20.1 vLSR 3.9 3.8 3.6 - - - 4.0 R TM Bδv 3.70.7 1.00.2 0.50.1 ≤0.1 ≤0.4 - 1.80.1 E2 TM B 0.50.15 ≤0.6 ≤0.1 ≤0.2 ≤0.4 - 0.830.06 HVC ∆v 6.60.6 - - - 6.30.2 vLSR 10.4 - - - 11 R TM Bδv 3.60.7 ≤0.5 ≤0.2 ≤0.3 ≤0.8 - 5.60.2 TM B 2.60.1 3.30.2 0.20.04 0.30.1 ≤0.2 - 0.30.1 W1 ∆v 1.80.2 1.30.03 2.20.2 1.90.3 - - 3.30.8 vLSR 4.0 3.3 3.7 3.3 - - 4.6 R TM Bδv 5.81.0 9.01.5 0.50.1 0.70.2 ≤0.4 - 1.10.2 TM B 2.40.2 1.60.2 0.300.04 0.70.1 ≤0.2 - 0.50.1 W2 ∆v 1.40.1 1.60.1 1.10.1 1.20.1 - - 2.10.3 vLSR 3.8 3.3 3.9 3.7 - - 3.5 R TM Bδv 3.80.7 2.70.5 0.30.1 0.90.2 ≤0.3 - 1.20.1 TM B 3.70.1 1.40.2 0.60.04 0.30.04 ≤0.2 - -HE2 ∆v 0.90.1 0.90.1 0.90.1 1.80.02 - - -vLSR 3.7 3.5 3.5 3.6 - - -R TM Bδv 5.30.8 2.70.5 0.60.1 0.60.1 ≤0.3 - -TM B 3.10.2 1.10.2 0.60.04 0.20.04 ≤0.3 0.80.2 -Cloud ∆v 1.00.04 0.70.1 0.50.1 1.40.2 - 1.10.4 -vLSR 3.8 3.8 3.8 3.9 - 3.4 -R TM Bδv 3.20.6 0.80.2 0.30.1 0.20.1 ≤0.3 1.00.2
-Table 2.Line parameters (TMB (K), ∆v (km s−1), vLSR(km s−1),
R
TM Bδv(K km s−1)) for the various transitions
observed at the “key” positions: the two protostars IRAS16293 and 16293E, the shocked regions E1, E2, W1, W2 and HE2, and the reference position in the cloud. The SiO observations were previously published in CCLCL01. When no signal is detected, we give an upper limit for the intensity equal to 3 RMS of the relevant spectrum. The parameters are taken from the spectra not smoothed. The symbol “-” implies that the relevant transition has not been observed or detected.
4. Column densities
In this section we estimate the column densities of the observed species, namely SO, SO2 and H2S, as well of
the SiO and H2CO previously observed by CCLCL01, in
the “key” positions. In order to do that, we first estimate the density and temperature of the gas in each position. To derive the gas temperature and density, as well as the column densities of the different species, we used the theo-retical predictions from an LVG (Large Velocity Gradient) model described in detail in the next paragraph. The next three paragraphs describe the derivation of the gas tem-perature and densities as well as the column density of the observed species in the cloud, in the shocked regions, and
in IRAS16293 respectively. Note that we did not carry out the analysis on 16293E, because the observed emission in that position seems to be dominated by the cloud emis-sion.
4.1. LVG model description
To derive the gas temperature and density, as well as the column densities, we compared the observed line intensi-ties with the theoretical predictions from a LVG model, which self-consistently accounts for the excitation condi-tions (density and temperature) as well as the line opac-ities. For the escape probability β we used the following function of the line optical depth: β = 1−exp[−3τ ]3τ , valid
Fig. 3. Spectra (not smoothed) of SO 32→ 21 SO 65→ 54 34SO 32→ 21 SO251,5→ 40,4 H2S 22,0→ 21,1 H2S
11,0 → 10,1 and SiO 2 → 1 at “key” points (see text) in the L1689N molecular cloud. The vertical dashed line
on each spectrum shows the position of the cloud systemic velocity (vLSR=3.9 km s−1).
in the case of a homogeneous and isothermal semi-infinite slab. More details can be found in Ceccarelli et al. (2002). Note that the dust emission is neglected in the present computations.
The spectroscopic data of SO, SO2, H2S, SiO
and H2CO are all taken from the JPL catalogue
(http://spec.jpl.nasa.gov/ftp/pub/catalog/catform.html; Pickett et al. 1998). The collisional coefficients are from Green (1994) for SO, Palma (1987) for SO2, Turner et al.
(1992) for SiO, and Green (1991) for H2CO respectively.
The collisional coefficients of H2S are not available in
literature, and we estimated them from the collisional coefficients of H2O, multiplied by a factor 5 (following
the discussion in Turner 1996). This is a very rough approximation, giving rise to unfortunately very rough estimates of the H2S column density. Furthermore, the
collisional coefficients used for the other molecules are not available in the full range of temperatures probed by our observations. In particular the low temperature regime is often missing. In this case we have extrapolated the coefficients at the lowest available temperature with a √Tkin law. Finally, our code considers the first 50
rotational levels of each molecule, unless the relevant collisional coefficients are available for a lower number of levels.
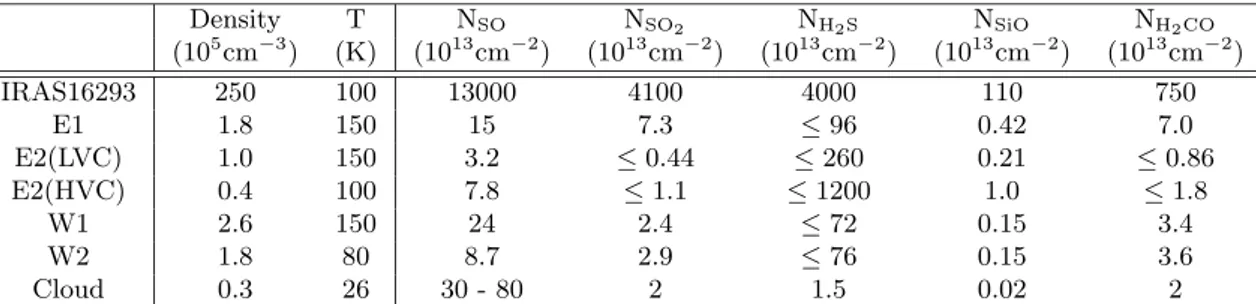
Density T NSO NSO2 NH2S NSiO NH2CO (105 cm−3) (K) (1013 cm−2) (1013 cm−2) (1013 cm−2) (1013 cm−2) (1013 cm−2) IRAS16293 250 100 13000 4100 4000 110 750 E1 1.8 150 15 7.3 ≤96 0.42 7.0 E2(LVC) 1.0 150 3.2 ≤0.44 ≤260 0.21 ≤0.86 E2(HVC) 0.4 100 7.8 ≤1.1 ≤1200 1.0 ≤1.8 W1 2.6 150 24 2.4 ≤72 0.15 3.4 W2 1.8 80 8.7 2.9 ≤76 0.15 3.6 Cloud 0.3 26 30 - 80 2 1.5 0.02 2
Table 3.Gas temperature and density, and column densities of SO, SO2, H2S, SiO and H2CO in six “key” positions.
The column densities are beam-averaged in the shocked regions (on 27′′ for SiO, 26′′ for H
2CO, 24′′ for SO, 18′′ for
SO2 and 25′′for H2S), whereas they are corrected from the beam dilution in IRAS16293. Errors on the estimates are
around 15% if considering only the statistical uncertainties. However, a factor two of uncertainty has to be considered, when the uncertainty on the density and temperature of the emitting gas is considered.
4.2. Cloud
To estimate the gas density and temperature, and the SO column density in the cloud reference position we simul-taneously best-fitted the 34SO and 32SO 3
2 → 21
obser-vations (that give a line opacity for 32SO τ ∼ 1.5), and
the32SO 3
2→ 21and 65→ 54 observations (whose ratio,
together with the 32SO 3
2 → 21 intensity, gives pairs of
gas temperature and density values). Note that we used the elemental ratio34S/32S = 22.5 (Wilson & Rood 1994;
Chin et al. 1996; Lucas & Liszt 1998), and we assumed that the emission fills up the beam, when comparing ob-servations obtained with different telescopes. The result of the modeling is shown in Fig. 4. We found that the ensemble of our observations constrains the SO column density in the cloud to be in the range 3 to 8 ×1014cm−2.
Adopting the gas temperature of 26 K, as found by Caux et al. (1999), we derive a density of 3 × 104cm−3.
The column densities of the other species, namely SO2
and H2S, have been derived assuming the same density
and temperature. The SO2 abundance was found to be
4 × 10⁻⁸, a value equivalent to the ones obtained in other
clouds (see Table 4). In the case of H2S we cross-checked
the column density derivation with LTE computations, because of the rough approximation of the collisional co-efficients. For this we assumed an excitation temperature of 5 K, as found by Swade (1989) and Hirahara et al. (1995) in similar molecular clouds (L134N and TMC-1) for several molecules whose fundamental transitions have A-coefficients similar to that for the H2S 11,0 → 10,1
tran-sition. In fact Minh et al. (1989) used an excitation tem-perature of 5 K for the H2S 11,0→ 10,1transition to
com-pute the column density of H2S in the molecular clouds
L134N and TMC-1, which have temperatures and den-sities similar to L1689N. Note that increasing the exci-tation temperature by a factor two, would decrease the H2S column density by the same amount. We assumed a
H2S ortho-to-para ratio equal to 3. Finally the SiO and
H2CO column densities are taken from the modeling by
Ceccarelli et al. (2000b) and Ceccarelli et al. (2001)
re-Fig. 4. Cloud reference position modeling. Theoretical predictions as function of the gas temperature and den-sity for two different SO column densities. The curves re-fer the values of three observed quantities taking into ac-count the uncertainties. Solid lines: observed integrated intensity ratio SO 32→ 21over SO 65→ 54 , between 3.2
and 5.2. Dashed lines: escape probability, derived from the
34SO and 32SO 3
2 → 21 line ratio, between 0.1 and 0.3.
Dot-dashed line: the minimum integrated intensity of the SO 32→ 21 transition, 2.6 K km s−1. Note that the
in-tensity increases with increasing temperature, i.e. towards the upper part of the panel. Analogously, the lower limit of the escape probability (0.1) in the left panel is not shown because it lies outside the plot.
spectively 2. The column densities derived for all species
are reported in Table 3 and the abundances in Table 4.
2 Although no SiO emission was detected towards the cloud
position, Ceccarelli et al. (2000b) modeled the observed SiO (from Jup= 1 to 8) emission towards IRAS16293, taking into
account the envelope physical structure, and found that the SiO abundance is 4.0·10−12in the outer envelope. In analogy
with other molecules for which the abundances found in the outer envelope are equal to the (measured) abundances in the surrounding molecular clouds, we assumed 4.0·10−12for the
Cloud x(SO) x(SO2) x(H2S) x(SiO) x(H2CO)
(10−9) (10−9) (10−9) (10−12) (10−8)
L1689N 6 - 16 0.4 0.3 4 0.04 L134N 0.6 - 10 0.3 - 2.5 3 ≤3.6 2 TMC-1 0.3 - 4 2 - 6 0.7 ≤2.4 7
Table 4. Abundances in molecular clouds. References: L1689N: SO, SO2 and H2S from this work, SiO from
Ceccarelli et al. (2000b) and H2CO from Ceccarelli et al.
(2001); L134N: SO and SO2 abundances from Swade
(1989), H2S from Minh et al. (1989), SiO from Ziurys
et al. (1989), H2CO from Ohishi et al. (1992); TCM-1: SO
abundances from Hirahara et al. (1995) and Pratap et al. (1997), SO2from Irvine et al. (1983), H2S from Minh et al.
(1989), SiO from Ziurys et al. (1989), H2CO from Ohishi
& Kaifu (1998).
4.3. Shocked regions
We have used the gas temperature and density derived by CCLCL01 in E1, E2(LVC), E2(HVC), W1, W23, i.e.
in the shocked regions, by comparing the SiO observed lines (J from 2 to 5) with the relevant LVG model. The uncertainty in the derived densities and temperatures is around a factor two. We did not try to derive indepen-dently the gas temperature and density for each molecule, because of the lack of enough usable transitions. In fact, of the two SO transitions, the lowest lying transition is dominated by the cloud emission so it cannot be used to probe the shocked gas, and only one transition of SO2,
H2S and H2CO respectively has been detected. We
there-fore derived the column densities of those last four species assuming the same density and temperature derived from the SiO observations. This is an approximation that does not take into account the possible structure of the shocked gas, but the results are indeed not much affected by this assumption. In principle each molecular species may orig-inate in slightly different physical conditions and hence the computed column density may be consequently mis-evaluated. In practice, though, the error associated with this approximation is lower than about a factor two. For example, Lis et al. (2002), using H2CO transitions, found
different values for the temperature (45 K) and density (2 × 106 cm−3) in E1. Even taking those values, the
de-rived column density of the four molecules listed in Table 3 wouldn’t change by more than a factor two with respect to those quoted in the table. Finally, we also assumed that all the used lines are optically thin (e.g. Blake et al. 1994). The column densities, averaged on the relevant beam, de-rived for all species in each of the four shocked sites are reported in Table 3. Unfortunately, since we don’t have
SiO abundance in L1689N. In a similar way, although weak formaldehyde emission is detected at the cloud position, we used the abundance found in the IRAS16293 outer envelope for the cloud too.
3
Since no SiO emission is detected in HE2, the density and temperature cannot be constrained in this position.
observations of the H2S lowest transitions in the shocks,
the column density of this molecule is very poorly con-strained.
4.4. IRAS16293
As mentioned in the Introduction, the envelope of IRAS16293 is formed by (at least) two components: an inner core characterized by a high temperature and an outer cold envelope with a temperature close to the cloud temperature. The hot core is a small region (∼ 2′′in
diam-eter) whose temperature is about 100 K and the density 2.5×107cm−3(Ceccarelli et al. 2000a; Sch¨oier et al. 2002).
At that temperature the grain mantles evaporate inject-ing into the gas phase their constituents (Ceccarelli et al. 2000a,b). The outer envelope is more extended (∼ 20′′)
and colder, with a temperature of 30 K (a little larger than the L1689N temperature) and a density of 2.5 × 105cm−3
(Ceccarelli et al. 2000a; Sch¨oier et al. 2002). The molecu-lar abundances in the outer envelope are simimolecu-lar to those in the molecular cloud, with the possible exception of the deuterated molecules. On the contrary, in the inner core, several molecules, those believed to be released from the grain mantles or formed from those evaporated molecu-les, undergo a jump in their abundances. In the follow-ing we focus on the abundance of the S-bearfollow-ing molecu-les in the inner hot core. Blake et al. (1994), using mul-tifrequency observations, constructed the rotational dia-grams of SO and SO2 and derived rotational
tempera-tures relatively large (∼80 K). It is therefore very likely that the bulk of the emission for both molecules origi-nates in the inner core. Furthermore, all linewidths are larger than 3 km s−1 and increase with the upper level
energy of the transition, once again arguing for an inner core origin. Pursuing this hypothesis we computed the col-umn densities using these rotational diagrams, corrected for the beam dilution, reported in Table 3. In estimating the H2S column density we assumed that the 22,0→ 21,1
line emission originates entirely in the hot core, as it is suggested by its observed relatively large linewidth. Using then the estimates of the H2 column density in Ceccarelli
et al. (2000a) (7.5 × 1022cm−2) we derive the abundances
reported in Table 5. Note that, provided that we use our volume density in the Sch¨oier et al. (2002) model, our de-rived abundance compare extremely well with their abun-dances (which, as a result, is multiplied by a factor five), supporting the validity of our method. Actually Sch¨oier et al. found abundances a factor 5 lower than ours, be-cause they used a factor five larger density than us in the inner core. The two density estimates differ because of the different diagnostics used to derive them: Sch¨oier et al. used the continuum spectral energy distribution, whereas Ceccarelli et al. used the water line spectrum. When CO lines are used instead, Sch¨oier et al. found the same density in the inner region (Sch¨oier private com-munication). We use therefore the estimate by Ceccarelli et al. (2000a), but keep in mind that we may be
overes-timating the abundances by a factor 5. Finally, the SiO and H2CO column densities are taken from the Ceccarelli
et al. (2000a,b, 2001) modeling.
5. Discussion
The abundance ratios between the observed species are reported in Table 4, 5 and 6. They show variations up to two orders of magnitude. In the following we analyze in detail the variations associated with the cloud, the shocked regions and the protostar IRAS16293 respectively.
5.1. The cloud
Adopting the H2 column density derived by Caux et al.
(1999) by means of atomic oxygen observations in L1689N, 5 × 1022cm−2, and using the column densities derived in
the previous section (Tab. 3) we obtain the abundances reported in Tab. 4. In the table we also report, for compar-ison, the abundances measured in L134N and TMC-1, two among the best studied molecular clouds. With the possi-ble exception of formaldehyde, which seems to be under-abundant, L1689N has abundances typical of other cold molecular clouds and it is therefore interesting to study how those abundances change in the region either because of the presence of shocks or the presence of a protostar (IRAS16293).
5.2. Shocked regions
In the shocked regions, with the exception of E2, it is practically impossible to derive the absolute abundances of the observed molecules, because of the difficulty to de-rive reliable estimates of the H2column densities. In fact,
usually the H2 column densities are estimated from the
CO millimeter observations converting the measured CO column densities into H2column densities. The method
re-lies on the capacity to disentangle the contribution of the cloud from the shocked gas in the CO emission. However, this is feasible when the shocked gas emits at relatively large velocities, i.e. when the two contributions can be separated based on their spectral properties (see for ex-ample Bachiller & Perez Gutierrez 1997). In the specific case of the outflows in L1689N, the projected velocity of the shocks is too small and the cloud and shocked gas cannot be disentangled, except in the E2 position, where a high velocity component is present. In order therefore to estimate the H2column density in the shocked regions
we would need high spatial resolution observations, be-cause single dish CO measurement are totally dominated by the cloud emission. For this practical reason, we com-puted only abundances ratios, as summarized in Table 6. Note that the quoted ratios have been obtained dividing column densities averaged on different beam sizes (18′′for
SO2 observations and ∼ 25′′ for the others), so that the
SO2 ratios may be off by a factor two (in the shocked
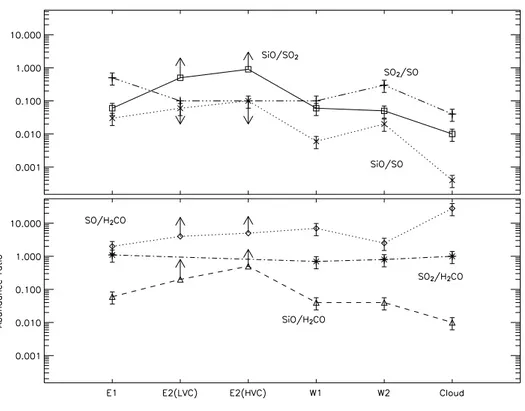
regions). Fig. 5 shows a graphic representation of the
de-rived abundances ratios in the shocked regions and in the cloud.
The first result to note is that, with the exception of the SO2/H2CO ratio, all other ratios in the shocked
re-gions differ by more than a factor two when compared to the ratios in the cloud. In particular, the largest varia-tions, by up a factor 100, are shown by the ratios with the SiO, confirming that SiO is the best molecule to trace shocks (Caselli et al. 1997; Schilke et al. 1997; Garay et al. 2002).
A second robust result is that SO2is enhanced with
re-spect to SO in the E1, W1 and W2 shocks, when compared to the cloud (by up a factor 10). This also confirms a rather general theoretical prediction that SO2 is overproduced
with respect to SO in the shocked gas, because of en-dothermic reactions that lock most of the gaseous sulphur in SO2on timescales relatively small ∼ 103yr (e.g. Pineau
Des Forˆets et al. 1993). Remarkably, SO2/SO is lowest in
the strongest SiO shock of the region, E2. CCLCL01 ar-gued that E2 is an older shock based on H2CO and SiO
observations compared with models predictions and this would agree with the low SO2/SO ratio, as SO2 is
ex-pected to be converted into atomic sulphur at late stages ≥ 3 × 10⁴yr (e.g. Hatchell et al. 1998).
The third result, is the constant SO2/H2CO ratio,
within a factor 2, in the shocked regions E1, W1 and W2, and in the cloud. Why SO2/H2CO has the same value in
these shocked regions and in the cloud seems a remark-able coincidence for which we do not have an explana-tion. On the contrary, the constant SO2/H2CO ratio in
these shocked regions may be due to the timescales in-volved in the formation and destruction of the two mo-lecules, even though the mechanisms of SO2 and H2CO
formation in shocks are expected to be different. On the one hand, formaldehyde is thought to be formed onto the grain mantles, released into the gas phase because of the mantle sputtering in the shock, and finally con-verted into more complex molecules by gas phase reac-tions on timescales larger than ∼ 3 × 10⁴ yr (Charnley
et al. 1992). SO2 follows a totally different route: it has
been proposed that sulphur is released into the gas phase mainly as H2S, following also mantle sputtering, and then
H2S is transformed into SO and SO2 via neutral-neutral
reactions on timescales of ∼ 103 yr (e.g. Charnley 1997).
Later on ∼ 3×10⁴yr, gaseous sulphur is expected to be in
atomic sulphur. Therefore, the constant SO2/H2CO ratio
in E1, W1 and W2 may tell us that these three shocks have similar ages, around 104yr if models are correct, whereas
E2 is a much older shock, ≥ 3×10⁴yr, and SO
2and H2CO
both disappear because transformed into S and complex O-bearing molecules respectively.
The overall emerging picture is that the combination of the variations in the abundance of different molecules can in first instance give an estimate of the age of the shock. Table 7 summarizes the situation. The times noted in the Table 7 are really modeled dependent and are meant to represent a sequence. The simultaneous presence of SO, SO2, H2S, H2CO, and SiO would mark relatively young
SO/H2 SO2/H2 H2S/H2 SiO/H2 H2CO/H2 IRAS16293 1.7 · 10−6 5.4 · 10−7 5.3 · 10−7 1.5 · 10−8 1.0 · 10−7 L1157-mm 5.0 · 10−9 3.0 · 10−8 1.1 · 10−8 - 4 − 6 · 10−9 Orion-KL 1.5 · 10−7 9.4 · 10−8 5.0 · 10−6 6.0 · 10−9 7.0 · 10−9 G10.47 3.0 · 10−9 1.8 · 10−8 ≥4.0 · 10−9 - -G29.96 ≥5.0 · 10−9 2.0 · 10−8 ≥1.5 · 10−8 - -G75.78 3.0 · 10−9 ≥2.0 · 10−9 ≥1.0 · 10−9 - -G9.62 ≥4.0 · 10−9 1.0 · 10−8 ≥8.0 · 10−9 - -G12.21 ≥8.0 · 10−10 ≥5.0 · 10−10 - - -G31.41 4.0 · 10−9 1.2 · 10−8 ≥3.0 · 10−9 - -G34.26 6.0 · 10−9 1.5 · 10−8 ≥2.0 · 10−9 - -BF-Class 0 3.0 · 10−9 4.0 · 10−10 2.0 · 10−9 -
-Table 5. Abundances of SO, SO2, H2S, SiO and H2CO with respect to H2 in the hot core of IRAS16293. The
abundances of SO, SO2 and H2S are estimated by the present work observations, assuming a H2 column density of
7.5 × 1022cm−2(Ceccarelli et al. 2000a). The SiO and H
2CO abundances are taken from Ceccarelli et al. (2000a) and
Ceccarelli et al. (2000b) respectively. References of the other sources: L1157-mm(IRAS 20386+6751): Bachiller & Perez Gutierrez (1997); Orion-KL: SO, SO2, SiO and H2CO from Sutton et al. (1995), H2S from Minh et al. (1990); G10.47,
G29.96, G75.78, G9.62, G12.21, G31.41 and G34.26: Hatchell et al. (1998); BF-Class 0: Buckle & Fuller (2003).
Region SO/H2CO SO2/SO SO2/H2CO H2S/SO SiO/SO SiO/SO2 SiO/H2CO
Cloud 28 ∼0.04 1 ∼0.03 ∼4 · 10−4 0.01 0.01 E1 2 0.5 1.1 ≤6 0.03 0.06 0.06 E2(LVC) ≥4 ≤0.1 - ≤80 0.06 ≥0.5 ≥0.2 E2(HVC) ≥5 ≤0.1 - ≤150 0.1 ≥0.9 ≥0.5 W1 7 0.1 0.7 ≤3 6 · 10−3 0.06 0.04 W2 2.5 0.3 0.8 ≤9 0.02 0.05 0.04 L1157-B1 0.6 - 1 0.6 - 1 0.4 - 1 0.8 - 1.3 0.2 - 0.3 0.3 0.1 - 0.3 L1157-B2 1 1 - 3 1 - 3 0.7 - 2 0.1 - 0.4 0.1 0.1 - 0.4 CB3 - ∼1 - ≤1 ≪1 ≪1 -L1448 - - - - 0.3 - -B1 - - - - 0.1 - -CepA - - - - 0.08 - -NGC 2071 - - - - 0.01 - 0.05 -
-Table 6.Abundance ratios in the shocked regions and in the cloud, as derived from the column densities of Tab. 3. References for other outflows: L1157-B1 and L1157-B2: Bachiller & Perez Gutierrez (1997); CB3: Codella & Bachiller (1999); L1448, B1 and CepA: Martin-Pintado et al. (1992); NGC 2071: Chernin & Masson (1993).
Time (yr) Formation Destruction 0a H
2S, H2CO, SiH2, SiH4
103 SO, SO2, H2S, SiO 3 · 104 SO2, H2CO 105 SiO
Table 7.Proposed schema of the formation and destruc-tion of SO, SO2, H2S, SiO and H2CO as function of time.
The times are indicative and are meant to represent a sequence. a Injection in the gas phase of the molecules
sputtered from the grain mantles.
shocks (≤ 104yr), whereas the only presence of SiO
emis-sion would point towards relatively older shocks (≥ 3×10⁴
yr).
Finally, comparison with other molecular outflows can only be very approximate, but still somewhat illustra-tive (Tab. 6). The only molecular outflow at our knowl-edge in which SO, SO2, SiO and H2CO abundances have
been measured is the L1157 outflow (Bachiller & Perez Gutierrez 1997). Looking at Table 6, L1157 B1 and B2 are rather similar to E2 with respect to the ratios involving SiO, i.e. they are relatively enriched in SiO with respect to the other shocks of L1689N and the molecular cloud. The likely interpretation is that E2, B1 and B2 are all relatively strong shocks. Yet, contrary to what happens in E2, H2CO, SO and SO2are detected in L1157 B1 and B2,
which would point towards relatively young shocks (Table 7). Note though that SO seems to be underabundant with respect to H2CO and SiO in B1 and B2 when compared
not only to E2, but also to E1, W1 and W2. At the same time, SO2is overabundant. Whether this is because of the
stronger shock in B1 and B2 that converts SO into SO2
more quickly, or because the shocks in L1157 have a dif-ferent age of E1, W1 and W2, is impossible to say at this stage. A larger statistics on a larger number of outflow system is necessary to better understand this point.
Fig. 5. The abundance ratios observed in the different shocked regions and in the molecular cloud and presented in Table 6: SO/H2CO, SO2/H2CO and SiO/H2CO on the lower panel and SO2/SO, SiO/SO2 and SiO/SO on the
upper panel. The arrows represent upper and lower limits of the SO2/SO, SiO/SO2, SO/H2CO and SiO/H2CO ratios
respectively.
5.3. IRAS16293
Table 5 quotes the absolute abundances of SO, SO2, H2S,
H2CO and SiO in the hot core of IRAS16293 and in
the molecular cloud. As evident from the table, the sul-phuretted molecule abundances exhibit a strong enhance-ment with respect to the molecular cloud abundances. The abundance of SO increases by a factor 200, SO2 by a
fac-tor 1300 and H2S by a factor 1700 (see also Sch¨oier et al.
2002).
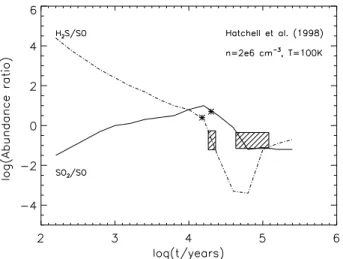
As we mentioned in the Introduction, the sulphur species are expected to be useful to evaluate the age of hot cores. We could not resist the temptation to compare the measured abundance ratios with published theoretical pre-dictions. In Fig. 6 we compare the H2S/SO and SO2/SO
ratios obtained in the IRAS16293 hot core with the theo-retical values predicted by chemical models. The observed H2S/SO and SO2/SO ratios are consistent with the
theo-retical predictions by Hatchell et al. (1998), but differ sub-stantially with those by Charnley (1997). Both models use the sulphur chemistry described in Charnley (1997) and assume that the bulk of sulphur is stored in iced H2S onto
the grain mantles. When the dust temperature exceeds 100 K, the grain mantles evaporate releasing the H2S into
the gas phase, which is slowly converted into SO and sub-sequently into SO2 by neutral-neutral reactions. The only
difference between the two models is that Hatchell et al.
use an updated rate for the reaction of H2S with atomic
hydrogen. This difference substantially changes the evolu-tion of the abundances of H2S, SO and SO2at times larger
than about 104yr. Our observations support the Hatchell
et al. (1998) model, as shown in Fig. 6. The agreement between observations and model predictions for an age of ∼ 3 × 10⁴ yr is remarkable, as independent estimates of the age of IRAS16293 converge towards the same value (Ceccarelli et al. 2000a). On the same figure we also re-port the values observed towards L1157-mm. Based on these observations and on the model predictions, L1157-mm has about the same age of IRAS16293. We caution that the error bars are indeed large enough to make the agreement between observed and predicted values just a coincidence. In this sense, this result may just mean an encouragement to pursue this kind of studies on a large sample of low mass protostars, where a statistical trend could be established. We have indeed started such a study on a sample of low mass protostars, whose we have derived the physical structure (i.e. density and temperature pro-files) and formaldehyde abundance profiles (Maret et al. 2002).
A direct comparison between the measured abun-dances in the hot cores quoted in Tab. 5 and that of IRAS16293 can only be done with respect to Orion-KL, as in the other sources the abundances are not corrected for the beam dilution (Hatchell et al. 1998; Buckle &
Fig. 6.Theoretical predictions of the evolution of SO2/SO
and H2S/SO ratios as a function of time. The curves
are adapted from the Hatchell et al. (1998) model, that assumes a gas temperature of 100 K and a density of 2 × 106cm−3. The grey squares represent the portion of
the modelling curve in agreement with observations of the hot core of IRAS16293 (this work). Analogously, the stars mark the predicted values of the ratios in agreement with what observed towards L1157-mm (Bachiller & Perez Gutierrez 1997).
Fuller 2003). With respect to Orion-KL, the hot core of IRAS16293 is enriched in SO, SO2 and H2CO, whereas it
is deficient in H2S. The most plausible explanation is that
the different abundances reflect a different composition of the ices (from which H2CO and H2S evaporate), a fact
now well documented by the study of deuterated molecu-les in high and low mass protostars (e.g. Ceccarelli 2002). However, the different gas temperature and density may also play a role. Finally, the SO2/SO and H2S/SO ratios
of IRAS16293 differ by about a factor 100 and 10 respec-tively with respect to the relevant ratios measured in the high mass protostars of the Hatchell et al. (1998) sample. Again, the difference may be attributed to both different evolutionary stages and different gas densities and tem-peratures.
Following the theoretical expectations that gaseous sulphur in the warm gas is mainly locked into SO, SO2
and H2S (e.g. Pineau Des Forˆets et al. 1993; Charnley
1997), while silicon is mainly locked into SiO (Herbst et al. 1989), the (SO+SO2+H2S)/SiO ratio gives a
mea-sure of the gas phase elemental sulphur over silicon abun-dance ratio in the IRAS16293 hot core. This value is about 300, to compare with the solar elemental sulphur over silicon abundance ratio of 0.5. It is unlikely that we overestimate the overall quantity of sulphur. Conversely, it could have been underestimated because of a possi-ble optical thickness of the sulfuretted molecular lines and/or the presence of other important sulphur-bearing molecular species not considered here. Thus, the mea-sured (SO+SO2+H2S)/SiO ratio suggests that there is
an important deficiency of silicon in the warm gas of the
IRAS16293 hot core. The likely explanation is that sil-icon is mostly depleted into the non-volatile, refractory cores grains, whereas sulphur is depleted mostly onto the volatile grain mantles. This conclusion supports the the-sis by Ruffle et al. (1999) that sulphur and silicon fol-low different routes of depletion, and specifically that sul-phur is depleted at the time of mantle formation. Another possibility to explain this deficiency of silicon is that sil-icon is mainly in another form than SiO in the warm gas such as Si, Si+ or SiO
2. The atomic silicon is
dif-ficult to observe, since it has its ground transition at 129 µm, i.e. a wavelength range obscured by the atmo-sphere. Observations obtained with the Long Wavelength Spectrometer on board ISO did not detect any signal larger than about 5×10⁻¹³erg s−1cm−2(Ceccarelli et al. 1998),
corresponding to an upper limit for the Si column density of 6 × 1017cm−2, and an abundance lower than 8 × 10⁻⁶,
i.e. about 500 times more than the SiO abundance found in IRAS16293. For Si+, it is unlikely that the UV field in
the observed regions is strong enough to ionize the silicon. Finally, the total abundance of SO, SO2 and H2S in
the IRAS16293 hot core is 2.8 × 10⁻⁶, namely more than
ten times lower than the corresponding solar abundance 3.4 × 10⁻⁵. Even adding up the OCS, whose abundance is
about that of SO (Sch¨oier et al. 2002), the overall sulphur abundance is still low. Unfortunately (Sch¨oier et al. 2002) could not estimate the CS abundance in the hot core of IRAS16293, but CS is unlikely to be the main reservoir of sulphur. The other possible reservoir of sulphur, the atomic sulphur (Charnley 1997), is extremely difficult to observe, because the ground state transition is at 25 µm, i.e. in a wavelength range obscured by the atmosphere.
6. Conclusion
We have presented a quantitative observational study of the most important S-bearing molecules, namely SO, SO2
and H2S, in the region of L1689N. We derived the column
density of these molecules plus SiO and H2CO molecules
in six regions of L1689N: the cloud, the young protostar IRAS16293, and four shocked regions.
We found that SiO is the molecule that shows the largest abundance variations in the shocked regions, whereas S-bearing molecules show more moderate vari-ations. Remarkably, the region of the brightest SiO emis-sion in L1689N, namely E2, is undetected in SO2, H2S
and H2CO and only marginally detected in SO. We
ar-gued that this is possibly due to the relatively old age (≥ 3 × 10⁴yr) of this shock.
In the other weaker SiO shocks, SO2is enhanced with
respect to SO, in agreement with theoretical expectations that predict the conversion of the gaseous sulphur mostly into SO2 on timescales of ∼ 103 yr. In the same regions,
the SO2/H2CO ratio is of order of unity. We argued that
this may point to relatively young shocks (∼ 104 yr), where SO2 has already formed and H2CO has not yet
Putting together the observed combinations of the SO, SO2, H2CO and SiO ratios, we proposed a schema in which
the different molecular ratios correspond to different ages of the shocks.
Finally, we found that SO, SO2 and H2S have
signifi-cant abundance jumps (200, 1300 and 1700 respectively) in the inner hot core of IRAS16293. We compared the mea-sured abundances with theoretical models and discussed the derived protostar age. However, we cautioned that a more detailed study is necessary to draw reliable conclu-sions. The hot core of IRAS16293 seems to be enriched in SO, SO2 and H2CO with respect to Orion-KL,
proba-bly because of a different initial composition of the ices in the two sources. Comparing the SO+SO2+H2S/SiO
ra-tio in the hot core of IRAS16293, we found that silicon is largely deficient in the warm gas (by a factor ∼ 600), supporting the thesis that silicon is depleted into the grain refractory cores whereas sulphur is depleted into the grain volatile mantles. Nonetheless, sulphur in the IRAS16293 warm gas is also deficient.
Acknowledgements. We thank the IRAM and SEST staff in Pico Veleta and La Silla for their assistance with the observa-tions, and the IRAM and ESO Program Committee for their award of observing time. We would like to thank G. Fuller, the referee, for useful comments.We are grateful to A.G.G.M. Tielens and M. Walmsley, for helpful discussions on sulphur and silicon chemistry. V. Wakelam wishes to thank F. Herpin for his help on data reduction.
References
Bachiller, R., P´erez Guti´errez, M., Kumar, M. S. N., & Tafalla, M. 2001, A&A, 372, 899
Bachiller, R. & Perez Gutierrez, M. 1997, ApJ Lett., 487, L93
Blake, G. A., van Dishoek, E. F., Jansen, D. J., Groesbeck, T. D., & Mundy, L. G. 1994, ApJ, 428, 680
Buckle, J. V. & Fuller, G. A. 2003, A&A, 399, 567 Caselli, P., Hartquist, T. W., & Havnes, O. 1997, A&A,
322, 296
Castets, A., Ceccarelli, C., Loinard, L., Caux, E., & Lefloch, B. 2001, A&A, 375, 40
Caux, E., Ceccarelli, C., Castets, A., et al. 1999, A&A, 347, L1
Ceccarelli, C. 2002, Planet. Space Sci., 50, 1267
Ceccarelli, C., Baluteau, J.-P., Walmsley, M., et al. 2002, A&A, 383, 603
Ceccarelli, C., Castets, A., Caux, E., et al. 2000a, A&A, 355, 1129
Ceccarelli, C., Caux, E., Wolfire, M., et al. 1998, A&A, 331, L17
Ceccarelli, C., Loinard, L., Castets, A., Tielens, A. G. G. M., & Caux, E. 2000b, A&A, 357, L9
Ceccarelli, C., Loinard, L., Castets, A., et al. 2001, A&A, 372, 998
Charnley, S. B. 1997, ApJ, 481, 396
Charnley, S. B., Tielens, A. G. G. M., & Millar, T. J. 1992, ApJ Lett., 399, L71
Chernin, L. & Masson, C. 1993, ApJ Lett., 403, L21 Chernin, L. M., Masson, C. R., & Fuller, G. A. 1994, ApJ,
436, 741
Chin, Y.-N., Henkel, C., Whiteoak, J. B., Langer, N., & Churchwell, E. B. 1996, A&A, 305, 960
Codella, C. & Bachiller, R. 1999, A&A, 350, 659
Fukui, Y., Sugitani, K., Takaba, H., et al. 1986, ApJ Lett., 311, L85
Garay, G., Mardones, D., Rodr´iguez, L. F., Caselli, P., & Bourke, T. L. 2002, ApJ, 567, 980
Green, S. 1991, ApJS, 76, 979 Green, S. 1994, ApJ, 434, 188
Hatchell, J., Thompson, M. A., Millar, T. J., & MacDonald, G. H. 1998, A&A, 338, 713
Herbst, E., Millar, T. J., Wlodek, S., & Bohme, D. K. 1989, A&A, 222, 205
Hirahara, Y., Masuda, A., Kawaguchi, K., et al. 1995, PASJ, 47, 845
Hirano, N., Mikami, H., Umemoto, T., Yamamoto, S., & Taniguchi, Y. 2001, ApJ, 547, 899
Hollenbach, D. J. 1998, in IAU symposium 182, Herbig-Haro flows and the birth of low mass stars, ed. B. Reipurth & Bertout, 181
Irvine, W. M., Good, J. C., & Schloerb, F. P. 1983, A&A, 127, L10
Keane, J. V., Boonman, A. M. S., Tielens, A. G. G. M., & van Dishoeck, E. F. 2001, A&A, 376, L5
Knude, J. & Hog, E. 1998, A&A, 338, 897
Lis, D. C., Gerin, M., Phillips, T. G., & Motte, F. 2002, ApJ, 569, 322
Loinard, L., Castets, A., Ceccarelli, C., Caux, E., & Tielens, A. G. G. M. 2001, ApJ Lett., 552, L163 Looney, L. W., Mundy, L. G., & Welch, W. J. 2000, ApJ,
529, 477
Lucas, R. & Liszt, H. 1998, A&A, 337, 246
Maret, S., Ceccarelli, C., Caux, E., Tielens, A. G. G. M., & Castets, A. 2002, A&A, 395, 573
Martin-Pintado, J., Bachiller, R., & Fuente, A. 1992, A&A, 254, 315
Millar, T. J. & Herbst, E. 1990, A&A, 231, 466
Minh, Y. C., Irvine, W. M., McGonagle, D., & Ziurys, L. M. 1990, ApJ, 360, 136
Minh, Y. C., Irvine, W. M., & Ziurys, L. M. 1989, ApJ Lett., 345, L63
Minh, Y. C., Ziurys, L. M., Irvine, W. M., & McGonagle, D. 1991, ApJ, 366, 192
Mizuno, A., Fukui, Y., Iwata, T., Nozawa, S., & Takano, T. 1990, ApJ, 356, 184
Narayanan, G., Walker, C. K., & Buckley, H. D. 1998, ApJ, 496, 292
Ohishi, M., Irvine, W. M., & Kaifu, N. 1992, in IAU Symp. 150: Astrochemistry of Cosmic Phenomena, Vol. 150, 171
Ohishi, M. & Kaifu, N. 1998, in Chemistry and Physics of Molecules and Grains in Space. Faraday Discussions No. 109, 205
Oppenheimer, M. & Dalgarno, A. 1974, ApJ, 187, 231 Palma, A. 1987, ApJS, 64, 565
Pickett, H. M., Poynter, R. L., Cohen, E. A., et al. 1998, J. Quant. Spectrosc. Radiat. Transfer, 60, 883
Pineau Des Forˆets, G., Roueff, E., Schilke, P., & Flower, D. R. 1993, MNRAS, 262, 915
Prasad, S. S. & Huntress, W. T. 1982, ApJ, 260, 590 Pratap, P., Dickens, J. E., Snell, R. L., et al. 1997, ApJ,
486, 862
Ruffle, D. P., Hartquist, T. W., Caselli, P., & Williams, D. A. 1999, MNRAS, 306, 691
Schilke, P., Walmsley, C. M., Pineau Des Forets, G., & Flower, D. R. 1997, A&A, 321, 293
Sch¨oier, F. L., Jorgensen, J. K., van Dishoeck, E. F., & Blake, G. A. 2002, A&A, 390, 1001
Sutton, E. C., Peng, R., Danchi, W. C., et al. 1995, ApJS, 97, 455
Swade, D. A. 1989, ApJ, 345, 828 Turner, B. E. 1996, ApJ, 468, 694
Turner, B. E., Chan, K., Green, S., & Lubowich, D. A. 1992, ApJ, 399, 114
van Dishoeck, E. F. & Blake, G. A. 1998, ARA&A, 36, 317
Walker, C. K., Lada, C. J., Young, E. T., Maloney, P. R., & Wilking, B. A. 1986, ApJ Lett., 309, L47
Wilson, T. L. & Rood, R. 1994, ARA&A, 32, 191 Wootten, A. & Loren, R. B. 1987, ApJ, 317, 220 Zhou, S. 1995, ApJ, 442, 685
Ziurys, L. M., Friberg, P., & Irvine, W. M. 1989, ApJ, 343, 201