ANTISOCIAL BEHAVIOR 1
The Expression of Genetic Risk for Aggressive and Non-Aggressive Antisocial Behavior is Moderated by Peer Group Norms
(Final draft)
Published version: Vitaro, F., Brendgen, M., Girard, A., Boivin, M., Dionne, G., & Tremblay, R. E. (2015). The expression of genetic risk for aggressive and non-aggressive antisocial behavior is moderated by peer group norms.
Abstract
Numerous studies have shown that aggressive and non-aggressive antisocial behaviors are important precursors of later adjustment problems. There is also strong empirical evidence that both types of antisocial behavior are partially influenced by genetic factors. However, despite its important theoretical and practical implications, no study has examined the question whether environmental factors differentially moderate the expression of genetic influences on the two types of antisocial behavior. Using a genetically informed design based on 266 monozygotic and dizygotic twin pairs, this study examined whether the expression of genetic risk for aggressive and non-aggressive antisocial behavior varies depending on the peer group’s injunctive norms (i.e. the degree of acceptability) of each type of antisocial behavior. Self-reported aggressive and non-aggressive antisocial behavior and classroom-based sociometric nominations were collected when participants were 10 years old. Multivariate genetic analyses revealed some common genetic factors influencing both types of antisocial behavior (i.e., general antisocial behavior) as well as genetic influences specific to non-aggressive antisocial behavior. However, genetic influences on general antisocial behavior, as well as specific genetic influences on non-aggressive antisocial behavior, vary depending on the injunctive classroom norms regarding these behaviors. These findings speak to the power of peer group norms in shaping aggressive and non-aggressive antisocial behavior. They also contribute further to understanding the distinctive development of both types of antisocial behavior. Finally, they may have important implications for prevention purposes.
Keywords: antisocial behavior, behavior genetics, twins, group norms, gene-environment interaction, pre-adolescents
Introduction
Early antisocial behavior is a well-established risk factor for later serious and persistent adjustment problems, including delinquency and school dropout (Dishion, French, & Patterson, 1995; Tremblay, Pihl, Vitaro, & Dobkin, 1994). Two types of antisocial behavior have been reported in the literature: aggressive and non-aggressive. Aggressive antisocial behavior refers to behaviors such as aggression, personal violence, and destruction of property, whereas non-aggressive antisocial behavior refers to behaviors such as theft, lying, cheating, and rule breaking. Although correlated (r between .4 and .6), the two types of antisocial behavior are associated with partly different risk factors (Barker et al., 2011; Burt, 2009; Lacourse et al., 2010). Aggressive and non-aggressive antisocial behaviors also demonstrate important developmental differences. Aggressive antisocial behavior is typically highest during early childhood and tends to decrease thereafter for most, but not all, children (Stanger, Achenbach, & Verhulst, 1997; Tremblay, 2003). In contrast, non-aggressive antisocial behavior tends to
increase from childhood to adolescence (Stanger et al., 1997). These almost opposite developmental patterns may make each type of antisocial behavior particularly sensitive to environmental influences at different periods of development: during early childhood for aggressive antisocial behavior, when it is on the decline, but during early adolescence for non-aggressive antisocial behavior, when it is on the rise.
Both types of antisocial behavior are also differently influenced by genetic factors. Summarizing 103 twin and adoption studies, Burt (2009) concluded that between 40 and 60% of the variance for aggressive antisocial behavior was explained by genetic factors, whereas non-shared environmental factors (i.e., factors that are specific to each member of a twin pair) explained the rest. Around 50% of the variance for non-aggressive antisocial behavior is also
under genetic influence according to Burt’s review. The remaining variance for non-aggressive antisocial behavior is mostly (i.e., at around 35%) explained by non-shared environmental factors, and to a smaller extent (i.e., at around 15%) by shared environmental influences (i.e., factors that are common to both members of a twin pair).
There is also evidence to suggest that the genetic and (non-shared) environmental factors associated with aggressive and non-aggressive antisocial behavior might overlap, at least
partially. For example, Burt (2013) noted that 38% of genetic influences and 10% of non-shared environmental influences are common to both types of antisocial behavior, which probably accounts for their phenotypic overlap. However, the studies that examined the overlap between genetic and environmental influences on aggressive antisocial behavior and non-aggressive antisocial behavior are scarce and they typically draw upon data that include a large age range, from preschoolers to late adolescents. In consequence, the degree of overlap between aggressive and non-aggressive antisocial behavior at any specific point in development – particularly during middle childhood when non-aggressive antisocial behavior is on the rise and aggressive
antisocial behavior tends to decline – remains unknown (Broidy et al., 2003). The first goal of this study was thus to examine the overlap in genetic and environmental influences, respectively, on aggressive and non-aggressive antisocial behavior in a sample of 10 year-old twins.
Burt (2009) also noted a moderate variability in the percentage of variance explained by genetic influences across the studies she reviewed. Some of this genetic variability may be explained by participants’ age or other methodological features such as the precise definition or measurement of aggressive antisocial behavior and non-aggressive antisocial behavior. However, a significant part of this variability might also be due to differences in participants’ social
behavior. Unfortunately, few researchers have examined the role of genetic influences on aggressive and non-aggressive antisocial behavior as a function of the acceptability of these behaviors in the peer group. Differences in the relative power of peer group norms to modulate the expression of genetic influences on aggressive antisocial behavior versus non-aggressive antisocial behavior would further support the distinction between the two types of antisocial behavior. Such differences would also help explain the variability in the genetic-environmental architecture of aggressive antisocial behavior and non-aggressive antisocial behavior across studies. Finally, such findings could open the door to prevention strategies based on group norms to curb the expression of genetic dispositions towards aggressive and non-aggressive antisocial behavior. Therefore, the second goal of this study was to test whether peer group norms
moderate the expression of the genetic and/or environmental components associated with aggressive antisocial behavior and non-aggressive antisocial behavior by middle childhood (i.e., at age 10 years).
Role of Peer Group Norms
Beyond the early childhood period, most children spend a large portion of their day in the company of peers in daycare settings or schools. By providing rules and norms for personal interactions as well as social reinforcement, peers play an important part in shaping children’s behavior from an early age (Bukowski, Brendgen, & Vitaro, 2007). Two types of norms have been discussed that may influence an individual’s behavior. According to Cialdini, Kallgren, and Reno (1991), descriptive norms refer to how most group members behave and are typically operationalized based on the overall prevalence (i.e., the mean level) of a behavior in a given group. In contrast, injunctive norms refer to what group members are expected to do, irrespective of the prevalence of this behavior, and are operationalized based on the group’s level of approval
or disapproval of the behavior. An additional important aspect refers to norm salience, i.e., the degree to which norms are made explicit to group members. Descriptive norms can be made explicit through information about the prevalence of the behavior in the group, whereas
injunctive norms can be made explicit through rewards or sanctions (e.g., by conferring a higher or lower social standing to the individuals engaging in a given behavior).Studies show that peer groups such as school classes vary considerably with respect to both descriptive norms (i.e., the mean level) of aggressive and non-aggressive antisocial behavior and with respect to the
injunctive norms (i.e., the level of acceptability) of these behaviors (e.g., Henry et al., 2000; Mercer, McMillen, & DeRosier, 2009; Rodkin, Farmer, Pearl, & Van Acker, 2006). One study investigating the unique effects of descriptive versus injunctive norms on aggressive antisocial behavior found that it is not so much the descriptive peer group norms that predict children’s aggressive behavior. Rather, aggressive behavior seems to increase most in classrooms where injunctive norms are highly salient and favorable towards aggressive behavior (Henry et al., 2000). Hence, explicit injunctive norms seem to play a more important role than descriptive norms with respect to children’s aggressive behavior.
The peer group – and especially the group’s norms in regard to aggressive and non-aggressive antisocial behavior – may significantly influence the expression of a child’s genetic disposition for such behaviors through a gene x environment interaction (GxE) process. Two types of GxE processes may be found in the current context: 1- Group norms may exacerbate the expression of a genetic liability for antisocial behavior according to a facilitation process (also known as a contextual triggering process, which is similar to a diathesis-stress model; Shanahan & Hofer, 2005); in this case a liability for (aggressive or non-aggressive) antisocial behavior would be expressed only, or more so, when peer group norms are favorable (i.e., when
environmental risk is high); 2- in contrast, favorable group norms could diminish or mitigate the expression of a genetic liability toward (aggressive or non-aggressive) antisocial behavior in accordance with a suppression process (also known as a social control process, which is similar to a bioecological model; Bronfenbrenner & Ceci, 1994; Rutter, Moffitt, & Caspi, 2006;
Shanahan & Hofer, 2005). In this case, individual differences in genetic liability would explain individual differences in antisocial behavior only when group norms generally discourage such behavior (i.e., when environmental risk is low). However, when group norms are favorable (i.e., when environmental risk is high), even non-genetically at risk children may resort to antisocial behavior. To date, the moderating role of injunctive group norms in a genetically-informed context has only been examined in regard to peer-rated physical and relational aggression, but not their possible overlap (Brendgen, Girard, Vitaro, Dionne, & Boivin, 2013). Results showed that, although no moderating effect of injunctive norms was found in regard to relational
aggression, favorable norms did foster the expression of genetic liability for physical aggression, in line with a facilitation process of GxE. Whether a similar pattern applies to injunctive norms in regard to a general tendency for antisocial behavior (as indicated by an overlap in genetic influences common to aggressive and non-aggressive antisocial behavior) or a specific
propensity toward aggressive antisocial behavior or non-aggressive antisocial behavior remains to be known.
The Present Study
Using a genetically informed design based on twins raised together but attending
different classrooms, the first goal of the present study was to examine whether, as expected, we would find common genetic influences on aggressive and non-aggressive antisocial behavior (termed general antisocial behavior), as well as specific influences on either aggressive antisocial
behavior or non-aggressive antisocial behavior. The second goal was to examine whether the genetic (or environmental) influences on aggressive and non-aggressive antisocial behavior vary depending on the peer group’s explicit injunctive norms regarding these behaviors. Based on the evidence reviewed above, we expected that genetic effects on both general antisocial behavior and specific aggressive antisocial behavior and non-aggressive antisocial behavior would be moderated by explicit injunctive peer group norms. In accordance with a facilitation process, we specifically expected that the genetic influences on both types of antisocial behavior and their common core (i.e., general antisocial behavior) would be reduced in classes where the norms are unfavorable, but exacerbated in classes with favorable norms. This hypothesis was tested with a sample of Monozygotic (MZ) and same-sex and opposite-sex Dizygotic (DZ) twins aged 10 years old. As already mentioned, this developmental period is of specific theoretical and practical interest given that children manifesting aggressive and non-aggressive antisocial behavior are at risk for later serious and persistent adjustment problems, including delinquency and dropping out of school (Dishion et al., 1995; Tremblay et al., 1994), and that age 10 has been proposed as the dividing line between early and late onset for these behaviors (Lahey et al., 1998).
Method Sample
Participants of this study were part of a population-based longitudinal sample of 662 MZ and DZ twin pairs from the greater Montreal area who were initially recruited at birth between November 1995 and July 1998 (see Boivin et al., 2013). Zygosity was assessed at 18 months based on physical resemblance via the Zygosity Questionnaire for Young Twins (Goldsmith, 1991). For a subsample of the same-sex twin pairs (n = 123), a DNA sample was evaluated with
respect to 8-10 highly polymorphous genetic markers. The comparison of zygosity based on the similarity of these genetic markers with zygosity based on physical resemblance revealed a 94% correspondence rate, which is similar to rates obtained in older twin samples (Forget-Dubois et al., 2003). Eighty-seven percent of the families were of European descent, 3% were of African descent, 3% were of Asian descent, and 1% were Native North Americans. The remaining families did not provide ethnicity information. Demographic characteristics of the twin families were comparable to those of a sample of single births representative of urban centers in the province of Quebec. At the time of their child(ren)’s birth, 95% of parents lived together; 66% of mothers and 60% of fathers were between 25 and 34 years old; 17% of mothers and 14% of fathers had not finished high school; 28% of mothers and 27% of fathers held a university degree; 83% of the parents held an employment; 10% of the families received social welfare or unemployment insurance; 30% of the families had an annual income of less than $30,000.
The sample was followed longitudinally at 5, 18, 30, 48, and 60 months focusing on child and family characteristics. New data collections were completed when the children were in kindergarten, grade 1, grade 3, and grade 4. Only grade 4 data were used for the purpose of this study, because it was the only data point when self-reports of antisocial behavior were available for participants (i.e., twins) and classmates (mean age = 10.2 years, SD = .42).Out of the initial 662 pairs, 416 twin pairs participated in grade 4. In 266 (64%) of these twin pairs, the two twins did not attend the same grade 4 class. For statistical analyses with twin samples, the same environmental variable (e.g., peer group norms) needs to be measured consistently either at the level of the individual twin, as was the case when the two twins of a pair were in different classes, or at the level of the pair, as was the case when the two twins of a pair were in the same class. Because the two twins of a pair were mostly in different classes, only these pairs were
included in the present study. The 266 twin pairs in the final study sample (108 MZ pairs and 158 same-sex and opposite-sex DZ pairs) did not differ from those who were lost through attrition in regard to mother-rated aggressive behavior at ages 18 to 48 months, family status, parental education or parents’ age, but family revenue was higher in the remaining study sample. Active written consent from the twins’ parents as well as from the parents of the twins’
classmates was obtained (see measures). Data collection took place in the spring to ensure that the children knew each other. All instruments were approved by the Institutional Review Board and the school board administrators.
Measures
Aggressive and non-aggressive antisocial behavior. Aggressive and non-aggressive
antisocial behavior of each target child (i.e., the twins) as well as of each of their respective classmates was measured using self-reports when the target children were 10 years old. Each antisocial behavior scale included six items (examples for aggressive antisocial behavior: fighting, bullying; examples for non-aggressive antisocial behavior: stealing, lying). Each item was rated on a 4-point scale: 0 (never), 1 (once or twice), 2 (often) and 3 (very often) in reference to the last 12 months. The items were part of the Self-Reported Delinquency Questionnaire for which LeBlanc and McDuff (1991) reported good temporal stability and satisfactory concurrent validity. Internal consistency in this study was also satisfactory (Cronbach alphas = .74 for aggressive antisocial behavior and .72 for non-aggressive antisocial behavior). Aggressive antisocial behavior and non-aggressive antisocial behavior were positively correlated, r = .45, p = .00. As expected, they were also not normally distributed. In consequence, a
reverse-transformation and a log-reverse-transformation, respectively, for aggressive and non-aggressive antisocial behavior was used to reduce skewness and kurtosis to acceptable levels. Means,
standard deviations and distributional properties for each type of antisocial behavior are presented in Table 1.
Peer group norms of aggressive antisocial behavior and non-aggressive antisocial behavior. As in other studies (Boardman, Saint Onge, Haberstick, Timberlake, & Hewitt, 2008;
Henry et al., 2000), classroom explicit injunctive norms were determined by correlating children’s aggressive and non-aggressive antisocial behavior scores with their level of sociometric popularity or rejection within the classroom. To this end, children were asked during a sociometric procedure to nominate up to three classmates they most liked to play with (positive nominations) and of three children they least liked to play with (negative nominations). Following widely used criteria for assessing peer acceptance and rejection (Coie, Dodge, & Coppotelli, 1982), the total number of received positive nominations was calculated for each participant and z-standardized within classroom to create a total Liked-Most-score. Similarly, the total number of received negative nominations was calculated for each participant and z-standardized within classroom to create a total Liked-Least-score. The Liked-Least-score was then subtracted from the Liked-Most-score to calculate a Peer Social Preference scale, which was again z-standardized within classroom. High levels on this scale indicate acceptance whereas low levels indicate rejection. The explicit
injunctive norm for aggressive antisocial behavior within a given classroom was indicated by the classroom-specific correlation between peer social preference and aggressive antisocial behavior. Similarly, the explicit injunctive norm for non-aggressive antisocial behavior within a given classroom was indicated by the classroom-specific correlation between peer social preference and non-aggressive antisocial behavior. The average correlation between peer social preference and each type of antisocial behavior was moderately negative, but there was considerable variability across classrooms (mean r across classrooms = -.14, range -.87 to .82, for the correlation between
peer social preference and aggressive antisocial behavior and mean r across classrooms = -.11, range -.91 to .63, for the correlation between peer social preference and non-aggressive antisocial behavior). Because only twins who were in a different classroom than their co-twin were included in the analyses, peer group norms were a ‘child-level’ variable. The aggressive antisocial behavior norms were uncorrelated with the target children’s (i.e., the twins’) aggressive antisocial behavior scores, r = .04, ns. Similarly, the non-aggressive antisocial behavior norms were uncorrelated with the target children’s non-aggressive antisocial behavior scores, r = .00, ns. However, the norms for aggressive antisocial behavior and non-aggressive antisocial behavior were correlated with each other, r = .55, p = .00.
Analyses Preliminary Analyses
Using the Mplus software package (Muthén & Muthén, 1998-2010), preliminary analyses revealed that boys scored significantly higher than girls on both aggressive and non-aggressive antisocial behavior (2 (2) = 6.20, p = .04 for aggressive antisocial behavior and 2 (2) = 62.3, p = .00 for non-aggressive antisocial behavior). No significant sex mean differences emerged in regard to peer group norms (2 (2) = 5.16, p = .08 for the aggressive antisocial behavior norm and 2 (2) = 2.61, p = .27 for the non-aggressive antisocial behavior norm). To account for the sex differences in both types of antisocial behavior, these two variables were z-standardized within sex groups for subsequent analyses.
Additional analyses were performed to test potential sex differences in the variance-covariance structure of aggressive and non-aggressive antisocial behavior and the corresponding peer group norms. These analyses, which were run as a four-group model (female MZ pairs, male MZ pairs, female DZ pairs, male DZ pairs) with equality constraints across sex groups but
with freely estimated parameters across MZ and DZ pairs, revealed no significant difference between boys and girls (χ2(12) = 8.06, p = .78). In addition, the variance-covariance matrix of the study variables for same-sex and opposite sex DZ twin pairs did not differ (2(6) = 1.88, p = .93). Data were therefore pooled combining male and female MZ pairs, on the one hand, and combining male and female DZ pairs and opposite DZ pairs, on the other hand, to maximize statistical power. Further analyses revealed no mean differences in regard to the study variables between MZ twins and DZ twins (2(2) = 4.58, p = .10).
Genetic and Environmental Influences: Univariate Analyses
In a first series of analyses, univariate models were fitted to the data to estimate the relative contribution of genetic and environmental factors to aggressive antisocial behavior and non-aggressive antisocial behavior, respectively, as well as to the injunctive peer group norms towards these two behaviors. The within-pair correlations for aggressive and non-aggressive antisocial behavior and for the respective peer group norms are depicted in the upper part of Table 1. By comparing within-pair correlations for MZ twins (who are genetically identical) and DZ twins (who on average share only half of their genes), sources of variability of a measured variable (phenotype) can be estimated in terms of latent additive genetic effects (A), latent shared environmental effects (C), and latent non-shared environmental effects (E) (Neale & Cardon, 1992). Within-twin pair correlations of the latent additive genetic factors (A) are fixed to 1.0 for MZ twins and to 0.5 for DZ twins. Within-twin pair correlations of the latent shared environmental factors (C) are fixed to 1.0 for both MZ and DZ twins. Within-twin pair
correlations of the latent non-shared environmental factors (E) are fixed to 0.0 for both MZ and DZ twins. The squared path coefficientsbetween these latent factors and the observed measures, i.e., parameters a2, c2, ande2,representpartitions of variance of each phenotype, with
measurement error included in e2. Because intra-pair correlations of DZ twins were very small (r = .06) for aggressive antisocial behavior and even negative (r = -.06) for non-aggressive
antisocial behavior, potential sibling interaction (contrast) effects were also estimated to reduce bias in the genetic effect estimates on the phenotype under study (Neale & Maes, 2004). These sibling contrast effects were added as a bidirectional effect between siblings that was constrained to be equal across twins of a pair and across MZ and DZ twin pairs (Neale & Maes, 2004). The sibling contrast effect was found to be significant and improved model fit for non-aggressive antisocial behavior and was therefore included in the subsequent multivariate models for this phenotype as well. Model fit was assessed based on the Root Mean Squared Error
Approximation (RMSEA) as well as 2 statistics. Low and non-significant 2 values and values of RMSEA below .08 indicate good model fit.
Overlap in Genetic and Environmental Influences and the Moderating Role of Peer Group Norms: Multivariate Analyses
In a second series of analyses, multivariate models were fitted to the data to examine the overlap in genetic (A) and nonshared environmental (E) influences between aggressive and non-aggressive antisocial behavior, as well as between the norms regarding these two behaviors (note: univariate analyses revealed no shared environmental effects C on either type of antisocial behavior). Given that the cross-twin cross-trait correlation (i.e., the correlation between
aggressive antisocial behavior and non-aggressive antisocial behavior within MZ and DZ pairs, respectively, was higher for MZ (r = .15), than DZ pairs (r = .07), genetic covariance between aggressive antisocial behavior and non-aggressive antisocial behavior ought to be expected. In these analyses we also examined whether explicit injunctive peer group norms moderated the effect of general and specific genetic factors associated with aggressive and non-aggressive
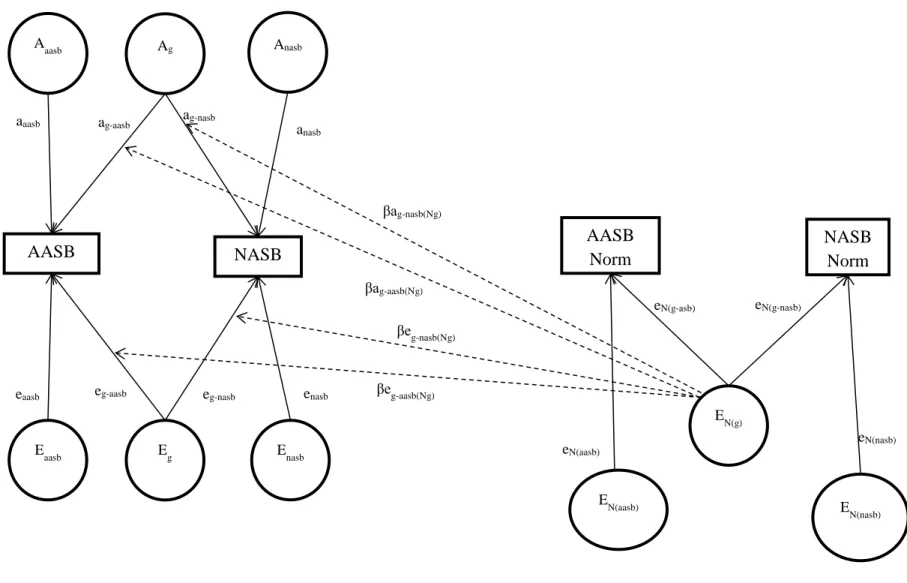
antisocial behavior. To this end, we first specified a multivariate model (Model 1) where the covariance structure of aggressive and non-aggressive antisocial behavior and of the respective peer group norm was partitioned into (1) latent factors Ag and Eg that influence general antisocial behavior (i.e., the overlap between aggressive and non-aggressive antisocial behavior), 2) latent factors Aaasb and Eaasb, as well as Anasb and Enasb, respectively, that influence each type of
antisocial behavior specifically, and (3) latent factors EN(g) as well as EN(aasb) and EN(nasb) that influence peer group norms in a general or specific manner (see Figure 1). Coefficients ag-aasb and ag-nasb represent the factor loadings of aggressive and non-aggressive antisocial behavior on the latent factor Ag. Coefficients eg-aasb and eg-nasb represent the factor loadings of aggressive and non-aggressive antisocial behavior on the latent factor Eg.Coefficients aaasb and anasb represent the factor loadings of aggressive and non-aggressive antisocial behavior on their respective specific latent factors Aaasb, and Anasb.Coefficients eaasb and enasb represent the factor loadings of aggressive and non-aggressive antisocial behavior on their respective specific latent factors Eaasb, and Enasb. Coefficients eN(g-aasb) and eN(g-nasb) represent the factor loadings of aggressive and non-aggressive antisocial behavior peer group norms on the latent factor EN(g). Coefficients eN(aasb) and eN(nasb) represent the factor loadings of aggressive and non-aggressive antisocial behavior peer group norms on their respective specific latent factors EN(aasb) and EN(nasb).
Because preliminary analyses had shown that aggressive antisocial behavior and non-aggressive antisocial behavior were uncorrelated with their respective peer group norms, no correlations were specified between the latent factors that influenced aggressive and non-aggressive antisocial behavior and the latent factors that influenced the respective peer group norms. However, it was possible thatpeer group norms moderate the effect of genetic factors on general antisocial behavior and on specific aggressive antisocial behavior or non-aggressive
antisocial behavior. These interactions were examined in separate model tests, where interaction terms were added to the previously described multivariate model. In the first model (Model 2a; see Figure 2a), we examined whether the general antisocial behavior-related peer group norm moderated the effect of the general genetic effect Ag on aggressive antisocial behavior and non-aggressive antisocial behavior respectively represented by terms ag-aasb(Ng) and ag-nasb(Ng). In addition to testing these gene-environment interactions, we also examined whether the general antisocial behavior-related peer group norm moderates the general environmental effect Eg on aggressive antisocial behavior and non-aggressive antisocial behavior, respectively, represented by the terms eg-aasb(Ng) and eg-nasb(Ng). Adding these “environment-environment interaction” terms was important to examine whether the moderating effect of the general antisocial behavior peer group norm is truly specific to the general genetic effect Ag on aggressive antisocial
behavior and non-aggressive antisocial behavior (Purcell, 2002).
In a second model (Model 2b; see Figure 2b), we examined whether the peer group norm specific to non-aggressive antisocial behavior moderates the effect of the genetic and
environmental factors Anasb and Enasb that are specific to non-aggressive antisocial behavior. These interactions are represented by terms anasb(Nnasb) and enasb(Nnasb). Because multivariate ACE modeling revealed a very weak and non-significant genetic influence specific to aggressive antisocial behavior, it was not possible to examine whether the peer group norm specific to aggressive antisocial behavior moderated the effect of the genetic factors that are specific to aggressive antisocial behavior. Finally, in a separate set of analyses, we tested whether the general peer group norms or the norms specific to aggressive antisocial behavior and-or aggressive antisocial behavior had a main effect on aggressive antisocial behavior and non-aggressive antisocial behavior.
Results
Genetic and Environmental Influences: Univariate Analyses
The results from the univariate genetic analyses are shown in the lower part of Table 2. As can be seen, additive genetic (i.e., A) factors accounted for 30% of the variance of aggressive antisocial behavior, with the remaining 70% of the variance of aggressive antisocial behavior explained by non-shared environmental factors (E). In a similar manner, additive genetic factors (A) explained half (50%) of the variance of non-aggressive antisocial behavior, with the other half again explained by non-shared environmental factors (E). In addition, a significant contrast effect between siblings (s = -.17, SE = .07, p = .02) was found for non-aggressive antisocial behavior, indicating that the more one twin engaged in non-aggressive antisocial behavior, the less the other twin engaged in such behavior. Exposure to differential peer group norms was completely explained by non-shared environmental factors, which accounted for 100% of the variance of aggressive antisocial behavior norms and for 100% of the variance of non-aggressive antisocial behavior norms.
Overlap in Genetic and Environmental Influences and the Moderating Role of Peer Group Norms: Multivariate Analyses
The results from the multivariate model without interaction terms (Model 1) are
presented in Table 3. There was a general genetic factor Ag that explained 27% of the variance of aggressive antisocial behavior and 25% of the variance of non-aggressive antisocial behavior. There was also a genetic factor Anasb specific to non-aggressive antisocial behavior, explaining 24% of the variance of non-aggressive antisocial behavior. The genetic factor Aaasb specific to aggressive antisocial behavior was very small and non-significant, explaining only 4% of the variance. There was also a general environmental factor Eg that explained 21% of the variance of
aggressive antisocial behavior and 19% of the variance of non-aggressive antisocial behavior. Moreover, there were a specific environmental factor Eaasb that explained 48% of the variance of aggressive antisocial behavior and another specific environmental factor Enasb that explained 32% of the variance of non-aggressive antisocial behavior. For antisocial behavior-related peer group norms, the results showed a general environmental factor EN(g) that explained 50% of the variance of aggressive antisocial behavior peer group norms and 50% of the variance of non-aggressive antisocial behavior peer group norms. An environmental factor EN(aasb) specific to aggressive antisocial behavior peer group norms explained the remaining 50% of aggressive antisocial behavior peer group norms and an environmental factor EN(nasb) specific to
non-aggressive antisocial behavior peer group norms explained the remaining 50% of non-non-aggressive antisocial behavior peer group norms.
Model 2a (Table 3), which tested the moderating effect of general antisocial behavior peer group norms showed that these general antisocial behavior norms significantly moderated the general genetic effect Ag on both aggressive antisocial behavior and non-aggressive antisocial behavior (ag-aasb(Ng) = -.13, p = .042; ag-nasb(Ng) = -.13, p = .042). General antisocial behavior peer group norms also moderated the general environmental effect Eg on both aggressive antisocial behavior and non-aggressive antisocial behavior (eg-aasb(Ng) = -.40, p = .000; eg-nasb(Ng) = -.40, p = .000). These findings indicate that the general genetic and general non-shared environmental influences on antisocial behavior vary significantly depending on whether the peer group norms favor or disfavor general antisocial behavior. For illustrative purposes, we plotted the magnitude of the different variance components of aggressive antisocial behavior and of non-aggressive antisocial behavior as a function of general antisocial behavior peer group norms (Figure 3a). As can be seen, the general antisocial behavior-related genetic
factor Ag explained around 50% of the variance of aggressive antisocial behavior when general antisocial behavior-related peer group norms were highly unfavorable (-1SD below the mean). However, the general antisocial behavior-related genetic factor Ag had much less influence on aggressive antisocial behavior (explaining only 20% of the variance) when general antisocial behavior-related peer group norms were highly favorable (+1SD above the mean). Of course, a reverse pattern was observed in regard to the amount of variance explained by environmental factors, as illustrated in Figure 3a: non-shared environmental factors explained 50% of the variance when norms were unfavorable (i.e., -1 SD below the mean) but 80% when norms were favorable (i.e., +1 SD above the mean). A similar pattern was observed for non-aggressive antisocial behavior (Figure 3a’). Specifically, the general antisocial behavior-related genetic factor Ag explained a considerable portion (around 60%) of the variance of non-aggressive antisocial behavior when general antisocial behavior-related peer group norms were highly unfavorable. In contrast, the general antisocial behavior-related genetic factor Ag had less influence on non-aggressive antisocial behavior (explaining around 30% of the variance) when general antisocial behavior-related peer group norms were highly favorable. Again, a reverse pattern was observed for non-shared environmental influences, with 40% of the variance between non-aggressive and aggressive antisocial behavior explained by nonshared
environmental factors common to both types when norms were unfavorable versus 70% when norms were favorable.
Model 2b (Table 3) revealed that the peer group norm specific to non-aggressive antisocial behavior also significantly moderated the effects of the genetic and environmental factors Anasb and Enasb that are specific to non-aggressive antisocial behavior (anasb(Nnasb) = .22, p = .000, and enasb(Nnasb) = .10, p = . 006). But in contrast to the pattern observed for general
antisocial behavior, plotting of these interactions (Figure 3b) showed that the genetic factor specific to non-aggressive antisocial behavior explained little (around 20%) of the variance of non-aggressive antisocial behavior when peer group norms specific to non-aggressive antisocial behavior were highly unfavorable (-1 SD below the mean). Most (i.e., 80%) of the variance specific to non-aggressive antisocial behavior was explained by non-shared environmental factors in this case. However, when peer group norms specific to non-aggressive antisocial behavior were highly favorable (+1 SD above the mean), inter-individual differences in aggressive antisocial behavior were more explained by genetic influences specific to non-aggressive antisocial behavior, accounting for around 40% of the variance. Non-shared environmental factors – while explaining less variance in this case than when the norms were unfavorable – still explained 60% of the variance, however.
Finally, we tested whether peer group norms that were general or specific to aggressive antisocial behavior and non-aggressive antisocial behavior had a main effect on the expression of the genetic or environmental components associated with specific aggressive antisocial behavior and non-aggressive antisocial behavior, respectively. No main effects were found.
Discussion
Numerous studies have shown that aggressive and non-aggressive antisocial behaviors are important precursors of later adjustment problems. There is also strong empirical evidence that both types of antisocial behavior are partially influenced by genetic factors. Genetic and environmental influences do not necessarily operate independently of each other, however (Purcell, 2002). Still, no study has examined the question whether environmental factors differentially moderate the expression of genetic influences on the two types of antisocial behavior. Using a genetically informed design based on twins, the goals of the present study
were twofold: 1) to examine the overlap in the genetic-environmental architecture of aggressive antisocial behavior and non-aggressive antisocial behavior in middle childhood (i.e., at age 10 years) and 2) to determine whether injunctive peer group norms could moderate the expression of the general or specific genetic (and environmental) components associated with aggressive antisocial behavior and non-aggressive antisocial behavior. In line with past studies (see Burt, 2009), we found that a significant portion of the variance in aggressive antisocial behavior and non-aggressive antisocial behavior was explained by genetic factors, controlling for sibling contrast effects. There was also a notable overlap in the sources of influence on aggressive antisocial behavior and non-aggressive antisocial behavior, although distinct sources of genetic and environmental influence were also detected. Most importantly, however, the expression of the genetic influences on the two types of antisocial behavior varied considerably depending on classroom injunctive norms, but not necessarily in the same direction. These results are discussed in turn.
Gene-Environment Architecture of Aggressive Antisocial Behavior and Non-aggressive Antisocial Behavior
The observed estimates of 30% of genetic variance for aggressive antisocial behavior and 50% of genetic variance for non-aggressive antisocial behavior are typical of what is found when children themselves serve as informants (see Burt, 2009). The fact that virtually all of the genetic variance of aggressive antisocial behavior overlapped with the genetic variance of
non-aggressive antisocial behavior, resulting in a general antisocial factor, is in line with the results from a small but growing number of studies (Burt, 2013). A general non-shared environmental factor also explained a moderate portion of the variance shared by the two types of antisocial behavior.
Together, the general genetic and environmental factors associated with both types of antisocial behavior might suggest a common etiology and may very well account for the
phenotypic overlap between them. However, the presence of specific sources of influence, both genetic and environmental, contributes to the notion that aggressive antisocial behavior and non-aggressive antisocial behavior also follow distinct etiological pathways due to partially specific risk factors. More specifically, there was a genetic factor specific to non-aggressive antisocial behavior, explaining a substantial part of the variance of non-aggressive antisocial behavior. There was also a specific non-shared environmental factor that explained the rest of the variance of aggressive antisocial behavior and another specific non-shared environmental factor that explained the rest of the variance of non-aggressive antisocial behavior.
A sibling contrast effect specific to non-aggressive antisocial behavior contributes to this overall picture. In line with other studies (Stevenson & Fielding, 1985), this contrast effect on non-aggressive antisocial behavior suggests that this behavior is particularly sensitive to environmental influences, including competition effects among siblings, particularly if they do not attend the same classroom and are thus exposed to different norms. However, contrast effects are notoriously difficult to disentangle from dominant (i.e., non-additive) genetic effects
(Rietveld, Hudziak, Bartels, van Beijsterveldt, & Boomsma, 2003). Therefore, contrast effects may not only reflect sibling competition but also genetic dominance effects. Whatever the explanation for the contrast effect, the present findings concur with the notion that aggressive and non-aggressive antisocial behavior should be distinguished but their overlap controlled for. This conclusion is further reinforced by the fact that the genetic and environmental factors associated with each type of antisocial behavior were not necessarily moderated in a similar direction by the injunctive classroom norms.
Injunctive Group Norms and the Expression of Genetic Risk for Aggressive and Non-aggressive Antisocial Behavior
Similar to findings from previous research (Henry et al., 2000; Rodkin et al., 2006), peer groups varied considerably in terms of the level of acceptability of both aggressive antisocial behavior and non-aggressive antisocial behavior. Whereas both types of antisocial behavior were positively associated with social acceptance in some classrooms, they were strongly frowned upon in others (Cillessen & Mayeux, 2004). Why problem behavior is a source of popularity and acceptance in some classrooms, whereas it is a source of peer rejection in others is an important question in itself (Stormshak et al., 1999) that is, however, beyond the scope of the present study. Our study nevertheless shows that this large variability in the level of acceptability of antisocial behavior is already present in early adolescence and that it applies to both aggressive antisocial behavior and non-aggressive antisocial behavior. However, in partial contrast with past findings (Henry et al., 2000), injunctive group norms were not directly related to current aggressive antisocial behavior and non-aggressive antisocial behavior. One way to reconcile these apparent contradictory findings is to suggest that there may be a developmental component in the main effect of classroom norms. Thus, Henry et al. found a main effect of injunctive norms on peer-rated aggressive behavior among age 12 students, but not among age 9 students (our participants were 10 years old). Even if classroom norms do not influence aggressive antisocial behavior and non-aggressive antisocial behavior directly in middle childhood, our findings nevertheless suggest that they have the power to modulate the expression of genetic propensity (and the influence of environmental experiences unique to each twin) towards these behaviors.
General classroom norms regarding antisocial behavior, regardless of form, moderated the expression of the genetic component related to the overlap between the two types of
antisocial behavior. The general antisocial behavior-related genetic factor explained a large portion of the variance of aggressive antisocial behavior and non-aggressive antisocial behavior (i.e., 50 and 60%, respectively) when general peer group norms were highly unfavorable. In contrast, the effect of the general antisocial behavior-related genetic factor became weaker (explaining 20% and 30% of the variance for general aggressive antisocial behavior and non-aggressive antisocial behavior, respectively) when general peer group norms were highly
favorable. This tendency for genetic risk to be expressed more readily in a low risk environment than in a high risk environment suggests a suppression GxE process and is compatible with the bio-ecological model (Bronfenbrenner & Ceci, 1994; Rutter et al., 2006). Hence, when the peer norms conspire against general antisocial behavior, the children who are genetically prone to general antisocial behavior may have difficulties controlling their aggressive tendencies or resisting the temptation to steal desired objects. In fact, the social dynamics in classrooms that condemn the use of aggression may even foster these children’s aggressive tendencies even further. A shown by Boivin, Dodge, and Coie (1995), aggressive children tend to be rejected mainly in groups where aggression is not normative. In turn, aggressive children who are rejected tend to become even more aggressive, either because they encounter frequent conflicts or because they tend to gang up in deviant cliques who encourage the use of aggression (Miller-Johnson, Coie, Maumary-Gremaud, Bierman, & Conduct Problems Prevention Research Group, 2002; Vitaro, Pedersen, & Brendgen, 2007). In contrast, nongenetically at risk children may have no problem refraining from adopting antisocial behaviors when the norms are unfavorable. However, when the peer norms towards general antisocial behavior are favorable and rewarded by social and possibly material gains, even non-genetically at risk children may be tempted to adopt a general antisocial behavior style, in line with peer contagion theory (Dishion & Tipsord,
2011). While the present findings suggest that this process of contagion is already underway by age 10 in classrooms where norms are favorable, it may further increase over the transition into adolescence when susceptibility to peer influence increases (Steinberg & Monahan, 2007). This higher susceptibility to peer norms – with consequently more non-genetically at-risk individuals adopting an antisocial style during adolescence – may, in turn, help explain the familiar age-crime curve, which tends to peak by mid-adolescence (De Lisi, 2015; Moffitt, 1993).
In contrast to the pattern observed for general antisocial behavior and in line with a facilitation GxE process, genetic dispositions specific to non-aggressive antisocial behavior tended to be expressed more readily in contexts that favored this type of behavior. The lack of punishment along with the promise of considerable advantages in classrooms with a highly permissive attitude toward non-aggressive antisocial behavior such as stealing or cheating likely provide ideal conditions for genetically at-risk children to engage in such behaviors. Unlike children with a genetic risk for general antisocial behavior, which likely is associated with a genetic vulnerability for poor impulse control and other neurocognitive deficits, children with a specific genetic risk for non-aggressive antisocial behavior that is unrelated to aggressive antisocial behavior, such as stealing or cheating, may be more sensitive to contextual
contingencies by virtue of their better neurocognitive functioning (Barker et al., 2007). These results thus contribute to the notion that non-aggressive antisocial behavior is more susceptible to environmental influence than aggressive antisocial behavior or general antisocial behavior
(Breslau, Saito, Tancredi, Nock, & Gilman, 2012). Strengths and Limitations
This is the first study to examine similarities and differences in gene-environment interaction processes – notably in regard to the role of peer group norms – between different
types of antisocial behaviors (i.e., aggressive and non-aggressive), In doing so, we were careful to examine and control for the overlap in the genetic and environmental influences between aggressive and nonaggressive antisocial behavior. The study also possesses several other
important strengths. One concerns the fact that injunctive peer group norm salience was based on the actual acceptance of each form of antisocial behavior in the peer group, based on its
correlation with peer social preference within a given class, rather than participants’ perceptions of their peer norms. Such data are rarely available in twin studies. Moreover, the age of the children who participated in the study corresponded to the proposed dividing line between early and late onset antisocial behavior (Lahey et al., 1998). Finally……
Despite these strengths, several limitations also need to be considered. The cross-sectional nature of the data, due to budgetary restrictions, is one limitation. A short-term longitudinal design within the same school year would best be employed to examine the
moderating role of peer group norms on the expression of genetic risk related to the development of aggressive antisocial behavior and non-aggressive antisocial behavior. A related limitation concerns the relatively small sample size. This was partly due to the fact that we had to exclude twin pairs where both members attended the same classroom to ensure consistency in classroom level data for the main analyses. Moreover, the small number of twin pairs with twins in the same classroom as the resulting lack of power prevented us from examining whether the pattern of results would be the same for twin dyads whose members were in the same classroom. Indeed, a power analysis with twin pairs in the same classroom (N= 59 MZ pairs and 91 DZ pairs) yielded a power of only .34 to detect an interaction between either type of antisocial behavior and classroom norms. Future studies with larger samples will need to address generalizability of results across twins in same and different classrooms. Finally, future studies with larger samples
also need to replicate the present findings in order to test whether the findings apply equally to girls and boys. More research is also needed to examine whether the results generalize to other age groups.
Conclusion
Our study adds to the growing evidence of gene-environment interactions in the etiology of aggressive antisocial behavior and non-aggressive antisocial behavior. Thus, our findings can help explain the variability in heritability estimates found in behavior genetic studies about aggressive antisocial behavior and non-aggressive antisocial behavior (Burt, 2009). They also speak to the importance of the peer group in shaping aggressive and non-aggressive antisocial behaviors already in early adolescents as even non-genetically disposed children may adopt them when peer group norms encourage antisocial behavior in general but do not do so when norms are unfavorable. By the same token, our results suggest that genetically at-risk individuals do not refrain from general antisocial behavior when the peer group norms are unfavorable towards such behavior. Based on these findings, it is thus not clear whether inclusion of antisocial individuals in a normative group is a good strategy to curb the expression of their inherent tendency for antisocial behavior. At the same time, there is clear evidence that grouping at-risk individuals in homogeneous antisocial groups may be harmful due to processes such as deviancy training (i.e., positive reinforcement and modeling of antisocial behavior) (Dishion & Piehler, 2009; Snyder et al., 2008). One way to solve this conundrum would be to create environments that prevent normative children from openly rejecting aggressive children, thus avoiding
coercive processes and formation of deviant cliques that create a supportive context for deviancy training. At the same time, however, it would be necessary to protect normative children from falling victim to the antisocial individuals or to favorable norms toward antisocial behavior they
might generate. Such “ideal” environments may resemble the one created by the prevention program “Good Behavior Game”, which values prosocial behavior and uses positive group contingencies to achieve desired goals (Kellam et al., 2011). The positive power of prosocial peers in such environments would be further increased if they enjoy a high social status
(Laursen, Hafen, Kerr, & Stattin, 2012). Indeed, there is evidence that the Good Behavior Game helps prevent peer rejection and clique formation (van Lier, Vuijk, & Crijnen, 2005). There is also evidence that exposing genetically at risk children and adolescents to prosocial peers prevents the development of antisocial behavior by mitigating the expression of genetic risk (Burt & Klump, 2013). Finally, there is evidence that a positive relationship between children may reduce aggressive behavior even in genetically at-risk children (Salvas et al., 2014). Testing the moderating role of these strategies in regard to the expression of genetic risk towards
aggressive and non-aggressive antisocial behavior may well be the next step in putting the environment to good use for curbing genetic risk for antisocial behavior.
References
Barker, E. D., Séguin, J. R., White, H. R., Bates, M. E., Lacourse, E., Carbonneau, R., & Tremblay, R. E. (2007). Developmental trajectories of male physical violence and theft: Relations to
neurocognitive performance. Archives of General Psychiatry, 64(5), 592-599. doi: 10.1001/archpsyc.64.5.592
Barker, E. D., Tremblay, R. E., van Lier, P. A. C., Vitaro, F., Nagin, D. S., Assaad, J.-M., & Séguin, J. R. (2011). The neurocognition of conduct disorder behaviors: Specificity to physical aggression and theft after controlling for ADHD symptoms. Aggressive Behavior, 37(1), 63-72.
Boardman, J. D., Saint Onge, J. M., Haberstick, B. C., Timberlake, D. S., & Hewitt, J. K. (2008). Do schools moderate the genetic determinants of smoking? Behavior Genetics, 38(3), 234-246.
Boivin, M., Brendgen, M., Dionne, G., Dubois, L., Pérusse, D., Robaey, P., . . . Vitaro, F. (2013). The Quebec Newborn Twin Study: 15 years later. Twin Research and Human Genetics, 16(1), 64-69. doi: 10.1017/thg.2012.129
Boivin, M., Dodge, K. A., & Coie, J. D. (1995). Individual-group behavioral similarity and peer status in experimental play groups: The social misfit revisited. Journal of Personality and Social Psychology, 69(2), 269-279.
Brendgen, M., Girard, A., Vitaro, F., Dionne, G., & Boivin, M. (2013). Do peer group norms moderate the expression of genetic risk for aggression? Journal of Criminal Justice, 41(5), 324-330. doi:
http://dx.doi.org/10.1016/j.jcrimjus.2013.06.004
Breslau, J., Saito, N., Tancredi, D. J., Nock, M., & Gilman, S. E. (2012). Classes of conduct disorder symptoms and their life course correlates in a US national sample. Psychological Medicine, 42(5), 1081-1089. doi: 10.1017/s003329171100198x
Broidy, L. M., Nagin, D. S., Tremblay, R. E., Bates, J. E., Brame, B., Dodge, K. A., . . . Vitaro, F. (2003). Developmental trajectories of childhood disruptive behaviors and adolescent delinquency: A six-site, cross-national study. Developmental Psychology, 39(2), 222-245. doi: 10.1037/0012-1649.39.2.222
Bronfenbrenner, U., & Ceci, S. J. (1994). Nature-nurture reconceptualized in developmental perspective - A bioecological model. Psychological Review, 101(4), 568-586. doi:
10.1037/0033-295x.101.4.568
Bukowski, W. M., Brendgen, M., & Vitaro, F. (2007). Peers and socialization: Effects on externalizing and internalizing problems. Part V: Socialization outside the family. In J. E. Grusec & P. D. Hastings (Eds.), Handbook of socialization: Theory and research (pp. 355-381). New York, NY: Guilford Press.
Burt, S. A. (2009). Are there meaningful etiological differences within antisocial behavior? Results of a meta-analysis. Clinical Psychology Review, 29(2), 163-178. doi: 10.1016/j.cpr.2008.12.004 Burt, S. A. (2013). Do etiological influences on aggression overlap with those on rule breaking? A
meta-analysis. Psychological Medicine, 43(9), 1801-1812. doi: 10.1017/s0033291712001894 Burt, S. A., & Klump, K. L. (2013). Delinquent peer affiliation as an etiological moderator of childhood
delinquency. Psychological Medicine, 43(6), 1269-1278. doi: 10.1017/s0033291712000013 Cialdini, R. B., Kallgren, C. A., & Reno, R. R. (1991). A focus theory of normative conduct: A theoretical
refinement and reevaluation of the role of norms in human-behavior. Advances in Experimental Social Psychology, 24, 201-234. doi: 10.1016/s0065-2601(08)60330-5
Cillessen, A. H. N., & Mayeux, L. (2004). From censure to reinforcement: Developmental changes in the association between aggression and social status. Child Development, 75(1), 147-163. doi: 10.1111/j.1467-8624.2004.00660.x
Coie, J. D., Dodge, K. A., & Coppotelli, H. . (1982). Dimensions and types of social status: A cross-age perspective. Developmental Psychology, 18, 557-570.
De Lisi, M. (2015). Age-crime curve and criminal career patterns. In J. Morizot & L. Kazemian (Eds.), The development of criminal and antisocial behavior (pp. 51-63). New York, NY: Springer.
Dishion, T. J., French, D. C., & Patterson, G. R. (1995). The development and ecology of antisocial behavior. In D. Cicchetti & D. J. Cohen (Eds.), Manual of Developmental Psychopathology (pp. 421-471). New York, NY: John Wiley & Sons.
Dishion, T. J., & Piehler, T. F. (2009). Deviant by design. Peer contagion in development, intervention, and schools. In K. H. Rubin, W. M. Bukowski & B. Laursen (Eds.), Handbook of peer interactions, relationships, and groups (pp. 589-602). New York, NY: Guilford Press.
Dishion, T. J., & Tipsord, J. M. (2011). Peer contagion in child and adolescent social and emotional development. Annual Review of Psychology, 62, 189-214.
Forget-Dubois, N., Pérusse, D., Turecki, G., Girard, A., Billette, J.-M., Rouleau, G., . . . Tremblay, R. E. (2003). Diagnosing zygosity in infant twins: Physical similarity, genotyping, and chorionicity. Twin Research, 6(6), 479-485. doi: 10.1375/136905203322686464
Goldsmith, H. H. (1991). A zygosity questionnaire for young twins: A research note. Behavior Genetics, 21(3), 257-269. doi: 10.1007/BF01065819
Henry, D., Guerra, N., Huesmann, R., Tolan, P., Vanacker, R., & Eron, L. (2000). Normative influences on aggression in urban elementary school classrooms. American Journal of Community Psychology, 28(1), 59-81.
Kellam, S. G., Mackenzie, A. C., Brown, C. H., Poduska, J. M., Wang, W., Petras, H., & Wilcox, H. C. (2011). The good behavior game and the future of prevention and treatment. Addiction Science & Clinical Practice, 6(1), 73-84.
Lacourse, E., Baillargeon, R., Dupéré, V., Vitaro, F., Romano, E., & Tremblay, R. (2010). Two-year
predictive validity of conduct disorder subtypes in early adolescence: A latent class analysis of a Canadian longitudinal sample. Journal of Child Psychology and Psychiatry, 51(12), 1386-1394. Lahey, B. B., Loeber, R., Quay, H. C., Applegate, B., Shaffer, D., Waldman, I., . . . Bird, H. R. (1998). Validity
of DSM-IV subtypes of conduct disorder based on age of onset. Journal of the American Academy of Child and Adolescent Psychiatry, 37(4), 435-442.
Laursen, B., Hafen, C. A., Kerr, M., & Stattin, H. (2012). Friend Influence Over Adolescent Problem Behaviors as a Function of Relative Peer Acceptance: To Be Liked Is to Be Emulated. Journal of Abnormal Psychology, 121(1), 88-94. doi: 10.1037/a0024707
LeBlanc, M., & McDuff, P. (1991). Activités délictueuses, troubles de comportement et expérience
familiale au cours de la latence [Delinquency, behavior problems and family dynamics during the latency period]. Montreal, QC: Unpublished research report, School of Psycho-Education, University of Montreal.
Mercer, S. H., McMillen, J. S., & DeRosier, M. E. (2009). Predicting change in children's aggression and victimization using classroom-level descriptive norms of aggression and pro-social behavior. Journal of School Psychology, 47(4), 267-289. doi: 10.1016/j.jsp.2009.04.001
Miller-Johnson, S., Coie, J. D., Maumary-Gremaud, A., Bierman, K., &
Conduct Problems Prevention Research Group. (2002). Peer rejection and aggression and early starter models of conduct disorder. Journal of Abnormal Child Psychology, 30, 217-230. Moffitt, T. E. (1993). Adolescence-limited and life-course-persistent antisocial behavior: A
developmental taxonomy. Psychological Review, 100(4), 674-701.
Muthén, L. K., & Muthén, B. O. (1998-2010). MPlus User's Guide (sixth ed.). Los Angeles, CA: Muthén & Muthén.
Neale, M. C., & Cardon, L. R. (1992). Methodology for genetic studies in twins and families. Boston, MA: Kluwer Academic Publishers.
Neale, M. C., & Maes, H. H. M. (2004). Methodology for Genetic Studies of Twins and Families. Dordrecht, The Netherlands: Kluwer Academic Publishing B. V.
Purcell, S. (2002). Variance components models for gene-environment interaction in twin analysis. Twin Research, 5(6), 554-571.
Rietveld, M. J. H., Hudziak, J. J., Bartels, M., van Beijsterveldt, C. E. M., & Boomsma, D. I. (2003).
Heritability of attention problems in children: I. Cross-sectional results from a study of twins, age 3-12 years. American Journal of Medical Genetics Part B-Neuropsychiatric Genetics, 117B(1), 102-113. doi: 10.1002/ajmg.b.10024
Rodkin, P. C., Farmer, T. W., Pearl, R., & Van Acker, R. (2006). They're cool: Social status and peer group supports for aggressive boys and girls. Social Development, 15(2), 175-204. doi: 10.1111/j.1467-9507.2006.00336.x
Rutter, M., Moffitt, T. E., & Caspi, A. (2006). Gene-environment interplay and psychopathology: multiple varieties but real effects. Journal of Child Psychology and Psychiatry, 47(3-4), 226-261.
Salvas, M.-C., Vitaro, F., Brendgen, M., Dionne, G., Tremblay, R. E., & Boivin, M. (2014). Friendship conflict and the development of generalized physical aggression in the early school years: A genetically informed study of potential moderators. Developmental Psychology, 50(6), 1794-1807. doi: 10.1037/a0036419
Shanahan, M. J., & Hofer, S. M. (2005). Social context in gene-environment interactions: Retrospect and prospect. Journals of Gerontology Series B-Psychological Sciences and Social Sciences, 60(Special Issue 1), 65-76.
Snyder, J., Schrepferman, L., McEachern, A., Barner, S., Johnson, K., & Provines, J. (2008). Peer deviancy training and peer coercion: Dual processes associated with early-onset conduct problems. Child Development, 79, 252-268.
Stanger, C., Achenbach, T. M., & Verhulst, F. C. (1997). Accelerated longitudinal comparisons of aggressive versus delinquent syndromes. Development and Psychopathology, 9(1), 43-58. Steinberg, L., & Monahan, K. C. (2007). Age differences in resistance to peer influence. Developmental
Psychology, 43(6), 1531-1543.
Stevenson, J., & Fielding, J. (1985). Ratings of temperament in families of young twins. British Journal of Developmental Psychology, 3(Jun), 143-152.
Stormshak, E. A., Bierman, K. L., Bruschi, C., Dodge, K. A., Cole, J. D., & CPPRG. (1999). The relation between behavior problems and peer preference in different classroom contexts. Child Development, 70(1), 169-182. doi: 10.1111/1467-8624.00013
Tremblay, R. E. (2003). Why socialization fails? The case of chronic physical aggression. In B. B. Lahey, T. E. Moffitt & A. Caspi (Eds.), Causes of conduct disorder and juvenile delinquency (pp. 182-224). New York, NY: Guilford Publications.
Tremblay, R. E., Pihl, R. O., Vitaro, F., & Dobkin, P. L. (1994). Predicting early onset of male antisocial behavior from preschool behavior. Archives of General Psychiatry, 51(9), 732-739.
van Lier, P. A. C., Vuijk, P., & Crijnen, A. A. M. (2005). Understanding mechanisms of change in the development of antisocial behavior: The impact of a universal intervention. Journal of Abnormal Child Psychology, 33(5), 521-535.
Vitaro, F., Pedersen, S., & Brendgen, M. (2007). Children's disruptiveness, peer rejection, friends' deviancy, and delinquent behaviors: A process-oriented approach. Development and Psychopathology, 19(2), 433-453.
Table 1
Means, Standard Deviation and Distributional Properties of Study Variables Mean Standard
Deviation
Skewness Kurtosis
Aggressive antisocial behavior (minimum: 0; maximum: 14)
.98a (.45)b 1.83 (.62) 3.28 (1.21) 14.34 (.68)
Non-aggressive antisocial behavior (minimum: 0; maximum: 14)
.63 (.19) 1.47 (.29) 4.85 (1.01) 31.47 (-.65)
Norms toward
Aggressive antisocial behavior (minimum: -.87; maximum: .82)
-.14 .27 .02 -.12
Norms toward
Non-aggressive antisocial behavior (minimum: -.91; maximum: .63)
-.10 .27 -.07 -.45
a, b: The first number represents values before transformation whereas the second number (in parentheses) indicates values after log-transformation.
Table 2
Within-Pair Correlations and Univariate Genetic Model Results
Within-Pair Correlations
MZ DZ
Aggressive antisocial behavior (AASB) .34** .06 Non-aggressive antisocial behavior (NASB) .17* -.07
AASB Norm -.01 .09
NASB Norm -.15 -.07
Univariate Model Results
%a2 %c2 %e2 s RMSEA χ2 (df) p AASB 30.1 (13.5; 46.6) 0 69.9 (53.4; 86.5) .00 1.38 (3) .711 NASB 50.1 (22.2; 78.0) 0 49.9 (22.0; 77.8) -.17 (-.30; -.03) .00 .53 (1) .468 AASB Norm 0 0 100 .00 1.19 (4) .880 NASB Norm 0 0 100 . 3.74 (4) .442 * = p < .05, ** = p < .01, *** = p < .001.
Table 3
Bivariate Genetic Model Results
Model 1 (without Interaction Terms)
Parameter Estimate LogLikelihood No. of parameters AIC BIC
-2849.1 16 5730.2 5787.7 ag (ag-aasb = ag-nasb) .50 (.36; .64) aaasb .19 (-.18; .59) anasb .49 (.24; .75) eg (eg-aasb = eg-nasb) .44 (.31; .57) eaasb .67 (.57; .78) enasb -.57 (-.76; -.38) eN(g) (eN(g-aasb) = eN(g-nasb)) .71 (.64; .78) eN(aasb) .70 (.64; .78) eN(nasb) .71 (.64; .78) snasb -.16 (-.28; -.03)
Model 2a (with Interaction Terms involving General Antisocial Behavior Norms)
Parameter Estimate LogLikelihood No. of parameters AIC BIC
-2848.2 18 5732.5 5797.2
ag (ag-aasb = ag-nasb) .49 (.34; .64) βag-aasb(Ng) = βag-nasb(Ng) -.13 (-.25; -.01)
aaasb .20 (-.11; .52) anasb .45 (.18; .72) eg (eg-aasb = eg-nasb) -.19 (-.43; .05) βeg-aasb(Ng) = βeg-nasb(Ng) -.40 (-.54; -.26)
eaasb -.65 (.75; -.56) enasb -.62 (-.80; -.44) eN(g) (eN(g-aasb) = eN(g-nasb)) -.69 (-.79; .62) eN(aasb) -.76 (.69; .82) eN(nasb) .70 (.63; .77) snasb -.14 (-.26; .02)
Model 2b (with Interaction Terms involving Specific non-aggressive antisocial behavior Norms)
Parameter Estimate LogLikelihood No. of parameters AIC BIC
-2848.1 18 5732.2 5796.9 ag (ag-aasb = ag-nasb) .48 (.34; .62) aaasb .31 (.11; .51) anasb .21 (.01; .40) βanasb(Nnasb) .22 (.12; .33) eg (eg-aasb = eg-nasb) .46 (.33; .59) eaasb .64 (.54; .74) enasb -.68 (-.77; .60) βenasb(Nnasb) .10 (.03; .18) eN(g (eN(g-aasb) = eN(g-nasb)) .70 (.64; .77) eN(aasb) .72 (.65; .79) eN(nasb) .70 (.63; .77) snasb -.06 (-.13; .01)
Note. Coefficients ag-aasb and ag-nasb represent the factor loadings of aggressive antisocial behavior and non-aggressive antisocial
non-aggressive antisocial behavior on the latent factor Eg.Coefficients aaasb and anasb represent the factor loadings of aggressive antisocial behavior and non-aggressive antisocial behavior on their respective specific latent factors Aaasb, and Anasb.Coefficients eaasb and enasb represent the factor loadings of aggressive antisocial behavior and non-aggressive antisocial behavior on their respective specific latent factors Eaasb, and Enasb. Coefficients eN(g-aasb) and eN(g-nasb) represent the factor loadings of aggressive antisocial behavior and non-aggressive antisocial behavior peer group norms on the latent factor EN(g). Coefficients eN(aasb) and eN(nasb) represent the factor loadings of aggressive antisocial behavior and non-aggressive antisocial behavior peer group norms on their respective specific latent factors EN(aasb) and EN(nasb). Parameters that were constrained to be equal for purposes of model identification are indicated by an = sign. AIC = Aikaike Information Criterion; BIC = Bayesian Information Criterion.
Figure 1. Conceptual Model illustrating partitioning of the covariance structure of aggressive antisocial behavior (AASB) and
non-aggressive antisocial behavior (NASB) and of the respective peer group norm (AASB and NASB Norm) into (1) latent factors Ag and Eg that influence general antisocial behavior (i.e., the overlap between aggressive antisocial behavior and non-aggressive antisocial behavior), 2) latent factors Aaasb and Eaasb, as well as Anasb and Enasb, respectively, that influence each type of antisocial behavior specifically, and (3) latent factors EN(g) as well as EN(aasb) and EN(nasb) that influence peer group norms in a general or specific manner.
AASB AASB Norm NASB Norm E N(g) EN(aasb) EN(nasb) easbeasb NASB Ag Aaasb Anasb Eg Eaasb Enasb ag-aasb a g-nasb aaasb a nasb
eg-asb eg-nasb enasb e
Figure 2a. Conceptual Model illustrating the putative moderating role of the general E component associated with both aggressive
antisocial behavior and non-aggressive antisocial behavior Norms (AASB Norm and NASB Norm, respectively) on the expression of the genetic and non-shared environmental influences general to aggressive antisocial behavior (AASB) and non-aggressive antisocial (NASB) behavior. AASB AASB Norm NASB Norm E N(g) EN(aasb) E N(nasb) eaasb NASB Ag A aasb Anasb Eg Eaasb Enasb ag-aasb ag-nasb aaasb a nasb
eg-aasb eg-nasb enasb
eN(aasb) eN(g-asb) eN(g-nasb) eN(nasb) βag-aasb(Ng) βag-nasb(Ng) βeg-aasb(Ng) βeg-nasb(Ng)
Figure 2b. Conceptual Model illustrating the putative moderating role of the specific E component linked to non-aggressive antisocial
behavior Norms (NASB Norm) on the expression of the genetic and non-shared environmental influences specific to non aggressive antisocial behavior (NASB).
AASB AASB Norm NASB Norm EN(g) E N(aas b) E N(nasb) eaasb NASB Ag A aasb Anasb E g Eaasb Enasb ag-aasb a g-nasb aaasb a nasb
eg-aasb eg-nasb enasb e
N(aasb) eN(g-aasb)
eN(g-nasb)
eN(nasb)
βenasb(Nnasb)