Subduction beneath Laurentia modified the eastern North
American cratonic edge: Evidence from P wave and S wave
tomography
A. Boyce1, I. D. Bastow1, F. A. Darbyshire2, A. G. Ellwood1, A. Gilligan1, V. Levin3, and W. Menke4
1Department of Earth Science and Engineering, Imperial College, London, UK,2Centre de Recherche GEOTOP, Université
du Québec à Montréal, Montréal, Québec, Canada,3Department of Earth and Planetary Sciences, Rutgers, State University of New Jersey, New Brunswick, New Jersey, USA,4Lamont-Doherty Earth Observatory of Columbia University, Palisades,
New York, USA
Abstract
The cratonic cores of the continents are remarkably stable and long-lived features. Their ability to resist destructive tectonic processes is associated with their thick (∼250 km), cold, chemically depleted, buoyant lithospheric keels that isolate the cratons from the convecting mantle. The formation mechanism and tectonic stability of cratonic keels remains under debate. To address this issue, we use P wave and S wave relative arrival-time tomography to constrain upper mantle structure beneath southeast Canada and the northeast USA, a region spanning three quarters of Earth’s geological history. Our models show three distinct, broad zones: Seismic wave speeds increase systematically from the Phanerozoic coastal domains, through the Proterozoic Grenville Province, and to the Archean Superior craton in central Québec. We also recover the NW-SE trending track of the Great Meteor hot spot that crosscuts the major tectonic domains. The decrease in seismic wave speed from Archean to Proterozoic domains across the Grenville Front is consistent with predictions from models of two-stage keel formation, supporting the idea that keel growth may not have been restricted to Archean times. However, while crustal structure studies suggest that Archean Superior material underlies Grenvillian age rocks up to ∼300 km SE of the Grenville Front, our tomographic models show a near-vertical boundary in mantle wave speed directly beneath the Grenville Front. We interpret this as evidence for subduction-driven metasomatic enrichment of the Laurentian cratonic margin, prior to keel stabilization. Variable chemical depletion levels across Archean-Proterozoic boundaries worldwide may thus be better explained by metasomatic enrichment than inherently less depleted Proterozoic composition at formation.1. Introduction
1.1. Overview
Cratons, the ancient cores of the continents, are the longest-lived tectonic features on Earth. They are thought to have resisted thermomechanical erosion for≥1 Ga over multiple Wilson cycles [e.g., Hoffman, 1990; Griffin et al., 2009; Lee et al., 2011]. Key to their survival are their thick (∼250 km) lithospheric keels [e.g., Lebedev and Van Der Hilst, 2008; Leki´c and Romanowicz, 2011] that possess a range of attributes that promote longevity, buoyancy, high strength and viscosity [e.g., Lenardic and Moresi, 1999; Sleep, 2003], low heat flow [Mareschal and Jaupart, 2004], and extensive chemical depletion in heavier elements such as Fe, Al, and Ca [e.g., Jordan, 1988; Griffin et al., 2003]. The combination of low temperatures and chemical depletion significantly increases seismic wave speed, consequently, cratonic keels are readily identifiable in tomographic images [e.g., Li et al., 2008; Ritsema et al., 2011].
While the mechanism for craton formation is debated [e.g., Lee et al., 2011], it is often recognized, particularly in North America, that their keels are vertically stratified [e.g., Abt et al., 2010; Yuan and Romanowicz, 2010; Darbyshire et al., 2013]. Keels are often thought to comprise a cold core of highly depleted Archean mate-rial bounded by a less-depleted, deeper layer of younger affinity [e.g., Lee et al., 2011]. Laterally, there is more disparity in observations. Thick keels often extend beneath both Archean and (less depleted) Proterozoic ter-ranes (e.g., Australia and North America [Simons et al., 2002; Yuan et al., 2011; Schaeffer and Lebedev, 2014]), but some cratonic regions show thick keels to be restricted to the highly depleted Archean provinces (e.g., southern Africa [James et al., 2001]).
RESEARCH ARTICLE
10.1002/2016JB012838
Key Points:
• Body wave tomography shows a systematic decrease in wave speed across tectonic boundaries in SE Canada
• A distinct vertical wave speed boundary is imaged directly beneath the Grenville Front • A metasomatized craton edge best
explains the vertical wave speed boundary Supporting Information: • Supporting Information S1 • Table S1 • Table S2 • Data Set S1 Correspondence to: A. Boyce, alistair.boyce10@imperial.ac.uk Citation:
Boyce, A., I. D. Bastow, F. A. Darbyshire, A. G. Ellwood, A. Gilligan, V. Levin, and W. Menke (2016), Subduction beneath Laurentia modified the eastern North American cratonic edge: Evidence fromPwave andSwave tomography,
J. Geophys. Res. Solid Earth, 121, 5013–5030,
doi:10.1002/2016JB012838.
Received 22 JAN 2016 Accepted 12 JUN 2016
Accepted article online 18 JUN 2016 Published online 2 JUL 2016
©2016. The Authors.
This is an open access article under the terms of the Creative Commons Attribution License, which permits use, distribution and reproduction in any medium, provided the original work is properly cited.
Preserving a geological record spanning over 3 billion years [Hoffman, 1990], the Laurentian core of North America has witnessed some of the largest tectonic events in Earth’s history (e.g., the Grenville orogeny). Recent studies [e.g., Eaton and Frederiksen, 2007; Frederiksen et al., 2013; Kaban et al., 2015] have suggested that the keel has been modified by tectonic processes, implying keels may not remain as stagnant features after their formation. Globally, subduction (e.g., North China craton, southern Africa, and Europe [Nolet and Zielhuis, 1994; Kusky et al., 2007; Begg et al., 2009; Santosh et al., 2010; Youssof et al., 2015]), underplating or ero-sion [e.g., Rondenay et al., 2000; Foley, 2008; Villemaire et al., 2012], rifting events [Frederiksen et al., 2013], and basal drag from viscous mantle flow [Eaton and Frederiksen, 2007; Kaban et al., 2015] have all been invoked to explain keel modification.
Combining new and existing seismograph networks in southeast Canada and the northeast USA, we present relative arrival-time P wave and S wave regional isotropic tomographic models at higher resolution than pre-viously achieved [e.g., Rondenay et al., 2000; Aktas and Eaton, 2006; Villemaire et al., 2012]. We pay particular attention to the question of whether upper mantle wave speed variations between Archean and Proterozoic domains are explained best by variations in chemical depletion, inherent to the plate formation process, or subsequent metasomatic enrichment during the Proterozoic Grenville orogeny.
1.2. Tectonic Setting
The Superior craton (Figure 1), formed between circa 2.6 and 3.0 Ga ago, mostly comprises small fragmentary subprovinces of both continental and oceanic affiliation [e.g., Hoffman, 1988; Ludden and Hynes, 2000]. To the south of the present-day Superior craton, a NW dipping, “Andean-style” subduction system [Rivers, 1997] is thought to have lasted for>300 Ma, leading to enrichment of the present-day Grenvillian mantle [Chiarenzelli et al., 2010]. However, other authors [e.g., White et al., 2000; Ludden and Hynes, 2000; Hanmer et al., 2000] sug-gest an opposing, earlier phase of subduction beneath the converging continent of Amazonia [e.g., Hoffman, 1999; Condie, 2001]. This allowed reworked Proterozoic island arcs, continental fragments, and back-arc basins [Dickin, 2000] to be accreted to the Laurentian margin above the Archean Superior basement, forming the Grenville Province. The Grenville orogeny terminated at circa 1 Ga ago, during the final assembly of the supercontinent of Rodinia.
The breakup of Rodinia (circa 620 Ma ago) produced several extensional features, notably the failed rift arms of the St. Lawrence [e.g., Kamo et al., 1995; Eaton and Frederiksen, 2007], and eventually resulted in the opening of the Iapetus Ocean. Closure of the Iapetus Ocean formed the majority of the coastal Appalachian terranes southeast of the Grenville Province [Hatcher, 2005; Van Staal, 2005] at 462–265 Ma ago. The final accretionary stage took place during the collision of Gondwana and Laurussia to form the supercontinent of Pangea [e.g., Stampfli et al., 2013]. Subsequent rifting of Pangea opened the Atlantic Ocean.
Magmatic events that have influenced SE Canada include Proterozoic dyke swarms that intruded the Superior craton [e.g., Ernst and Bleeker, 2010]. Mesozoic magmatic activity, thought to be associated with the passage of the Great Meteor hot spot (GMH; circa 190–110 Ma ago) caused a progression of kimberlite and alkaline igneous intrusions (Figure 1) from NW James Bay through the White Mountains, offshore into the New England seamount chain [Heaman and Kjarsgaard, 2000].
1.3. Previous Geophysical Work
Global tomographic models [e.g., Li et al., 2008; Ritsema et al., 2011] recover a fast wave speed anomaly (𝛿VS>4%) beneath the Canadian shield that extends to ∼250 km depth [e.g., Lebedev and Van Der Hilst, 2008].
Laterally, this feature stretches from the eastern Cordillera to the Grenville Province throughout much of the USA and Canada. Continental tomographic models, both surface wave [e.g., Van der Lee and Frederiksen, 2005; Nettles and Dziewonski, 2008; Bedle and Van der Lee, 2009; Schaeffer and Lebedev, 2014] and body wave [e.g., Burdick et al., 2014; Schmandt and Lin, 2014], also recognize this high wave speed lid to ∼250 km depth above a less anomalous, heterogeneous upper mantle. The surface wave model of Nettles and Dziewonski [2008] shows a strong correlation of seismic wave speed with surface tectonic provinces to a depth of ∼150 km. However, more recent models [Schaeffer and Lebedev, 2014; Yuan et al., 2014] show the fastest wave speeds to extend to the Appalachian Front above 150 km depth, retreating back NW of the Grenville Front at 200 km depth. The slowest wave speeds are confined to the coastal Appalachian terranes where the lithosphere is thinner [Schaeffer and Lebedev, 2014]. Within the lithosphere, Yuan and Romanowicz [2010] image a change in anisotropic fast direction at 50–160 km depth and propose a two-layered lithosphere beneath cratonic North America. The fastest wave speeds occur in the upper layer, confined to Archean terranes, with slightly
Figure 1. (left) Tectonic features and station locations in eastern Canada and northeast USA. White triangles represent broadband stations, black triangles indicate short-period stations (only used inPwave study), and inverted black triangles denote the Imperial College Maritimes SEIS-UK contribution to the QM-III array. Red triangles show the locations of the three stations highlighted in the residual analysis (Figure 2). The lilac transparent band marks the track of the Great Meteor hot spot [Heaman and Kjarsgaard, 2000], with associated magmatism: kimberlite pipes (magenta diamonds) and igneous intrusive bodies (blue circles, Monteregian Hills; green squares, White Mountains plutons). AF, Appalachian Front; CMB, Central Metasedimentary Belt; GF, Grenville Front; GL, Great Lakes; JB, James Bay; NB, New Brunswick; NE, New England; NF, Newfoundland; NS, Nova Scotia; SL, Gulf of St. Lawrence. (right) Global maps of magnitude>5.5mbearthquakes between 2007 and 2014 shown by the blue (P) and red (S) dots, recorded by 160 stations in southeast Canada with high signal-to-noise ratio used in this study. The concentric rings mark 30∘increments in epicentral distance away from the center of the seismograph network.
slower wave speeds in the lower layer that stretches beneath the Proterozoic domains as well [Yuan and Romanowicz, 2010].
Another large-scale structure, coherent across many of these models, is the region of slow wave speed [e.g., Van der Lee and Frederiksen, 2005; Schmandt and Lin, 2014] that extends inland to the NW associated with the GMH track and the New England Seamount chain. This anomaly widens with depth and decreases in strength toward the Grenville Province. This anomaly has been shown to dip to the SW, increasingly offset from the surface expression with depth through the lithosphere [Eaton and Frederiksen, 2007].
Numerous regional studies have discussed the slow wave speed “divot” [e.g., Fouch et al., 2000] in NE USA/SE Canada. Fouch et al. [2000] used shear wave splitting measurements to indicate that slower wave speeds may result from asthenospheric flow drawn into a divot in the keel; however, more recent studies [e.g., Rondenay et al., 2000; Aktas and Eaton, 2006; Villemaire et al., 2012] link the NW-SE trending slow wave speed anomalies in the region to the GMH track, which terminates at the Grenville Front. Having located slow wave speeds below the site of a Precambrian failed rift zone (associated with the breakup of Rodinia), it is hypothesized that the resulting lithospheric zone of weakness [e.g., Petit and Ebinger, 2000] would act as a stress guide and channel plume-related material in the lithosphere [Rondenay et al., 2000; Aktas and Eaton, 2006; Villemaire et al., 2012]. Thus, dipping wave speed anomalies could be a result of interaction of the plume with lithospheric basal topography and nonvertical zones of weakness within the lithosphere. A lack of lowered wave speeds in the Superior also suggests that it is more resistant to hot spot-related modification than younger terranes [Rondenay et al., 2000; Villemaire et al., 2012].
The regional studies also identify a difference in seismic wave speed on and off the shield but fail to identify any notable difference between the Archean Superior craton and Proterozoic Grenville Province, perhaps due to a
Figure 2. (top row) Distribution of relative arrival-time residuals with back azimuth for three stations (LG4Q, FRNY, and FFD, labeled in Figure 1) within the Superior, Grenville, and Appalachians for thePwave data set. Negative values are early arrivals (faster), and positive values are later arrivals (slower). (bottom row) Histogram of event distribution with (a) epicentral distance, (b) event frequency with back azimuth, and (c) frequency distribution of residuals for thePwave data set. TheSwave data set shows similar results but with more scatter.
lack of station coverage [e.g., Villemaire et al., 2012]. Additionally, Aktas and Eaton [2006] note a SE dipping, fast wave speed body (extending to ∼350 km depth) beneath the Central Metasedimentary Belt (CMB; Figure 1). This is interpreted as evidence for a SE dipping episode of subduction, prior to the continental collision during the Grenville orogeny.
At the crustal scale, the LITHOPROBE program [e.g., Clowes, 2010] has obtained seismic reflection and refrac-tion profiles, including those that cross the Grenville Front. These image listric thrust faults, dipping to the SE, beneath the Grenville Province that have since reactivated in an extensional fashion [e.g., White et al., 2000; Ludden and Hynes, 2000]. Reworked Grenvillian age accretionary material is thus thought to overlie Superior basement within the crust. The extent of the underthrusting is thought to be≥300 km laterally from the sur-face expression of the Grenville Front [White et al., 2000; Ludden and Hynes, 2000], thus reaching depths well below the Moho.
2. Method
2.1. Seismic Data and Networks
Data were sourced from the Incorporated Research Institutions for Seismology (IRIS) Data Management Cen-ter and Canadian National Data cenCen-ter from the period 2007–2014, and more recently, the Imperial College Maritimes SEIS-UK deployment of the QM-III experiment [e.g., Petrescu et al., 2016] between 2013 and 2014. Within the ∼ 3000 × 2000 km study area (Figure 1), 160 stations were used, of which 13 are short-period instruments (Teledyne-Geotech S-13); the remainder are broadband instruments: Wielandt-Streckeisen STS-1 or STS-2, Güralp CMG-3ESP, CMG-3T, CMG-3TP or CMG-40T, or Nanometrics Trillium 120PA. Data from short-period stations are only included in the P wave data set, all traces are normalized to the shortest period response to allow consistent phase picks across the network. Within the epicentral distance range 30∘ –120∘, 238 earthquakes of mb> 5.5 were used for P (Figure 1) and 166 for S yielding a total of 10,042 and 9806 rays, respectively. The P wave measurements of Villemaire et al. [2012] contribute ∼ 6000 rays to our data set. The back azimuthal coverage of earthquakes is good (Figure 2) but dominated by northwestern (Western Pacific) and southern (South America) back azimuths. The distribution in epicentral distance is also good (Figure 2).
2.2. Relative Arrival Times
Initially, data were filtered using a zero-phase, two-pole Butterworth filter (0.4–2.0 Hz for P waves, 0.04–0.2 Hz for S waves). Such filters form a trade-off between the infinite frequency approximation required for ray trac-ing and limittrac-ing high-frequency noise in the data set, an approach also used in previous studies [e.g., Bastow et al., 2005, 2008; Villemaire et al., 2012]. The manual alignment of traces is improved using the multichannel cross-correlation (MCCC) method of VanDecar and Crosson [1990] on the filtered data. This allows accurate computation of relative arrival-time residuals for both data sets. Manual first-break picks are windowed (3 s and 12 s, respectively, for P and S) to search for the cross-correlation maximum position,𝜏max
ij , between
each pair of traces. This is used to define the relative delay time, Δtij, for each station pair (i and j) for each
earthquake
Δtij= tPi − tPj −𝜏ijmax, (1) where tP
i is the preliminary arrival estimate for trace i. Noise within the waveforms causes a lack of coherency
across the traces resulting in an inconsistency in delay times, i.e., Δt12+ Δt23≠ Δt13[VanDecar and Crosson, 1990]. Therefore, a least squares minimization routine is required to compute optimized relative arrival times, ti, for each station, where the mean is forced to be zero. Errors associated with the relative arrival times can also be used to approximate error in the MCCC results.
Relative arrival times have a mean standard deviation of 0.01 s and 0.07 s for P and S waves, respectively, which appear overly optimistic given the data sampling interval of≥ 0.01 s. The relative arrival-time residuals tRESi (equation 2) are then calculated by comparison to predicted arrivals, tei, based on the IASP91 traveltime tables [Kennett and Engdahl, 1991]
tRESi= ti− (tei− ̄te), (2)
where ̄teis the mean expected traveltime for an earthquake across the network.
2.3. Analysis of Relative Arrival-Time Residuals
Inherent in multichannel cross correlation is the relative nature of the residuals. Absolute traveltime tomogra-phy allows calculation of absolute seismic wave speeds within the Earth. Relative arrival-time methods, such as that used here, allow for calculation of anomalies with respect to the regional mean of the data set. The background mean (̄tein equation (2)) is completely removed from the output model meaning fast and slow
anomalies are relative to the regional average arrival time. It is recognized on the global scale [e.g., Li et al., 2008; Ritsema et al., 2011] that the Canadian shield is particularly fast and that the coastal terranes within the Appalachians are generally slow.
Analysis of back azimuthal variation of residuals from individual stations within each tectonic domain (Figure 2) indicates a general trend of late arrivals (slower, positive residuals) from the SE and early arrivals (faster, negative residuals) from the NW. Within the Superior craton (station LG4Q), the majority of residuals are negative with the exception of the SE direction, away from the cratonic interior. The Appalachians (station FFD) show predominantly late arrivals, except to the NW, where rays pass through faster lithosphere. Across both P wave and S wave mean relative arrival-time plots (Figure 3) there is a marked trend of earlier-than-expected arrivals within the Superior craton, close to expected arrivals within the Grenville and later arrivals within the Appalachians. The shift in the peak of the residual histograms (where residuals are grouped by tectonic province) across the three domains and the steady increase in residuals along transect F-F’ (Figure 3) also confirm this trend. Coastal areas, particularly in Newfoundland, appear to suffer from scat-tered arrival times, likely due to wave noise. It is also unclear whether the lithospheric impact of the GMH affects the relative arrival times or whether the lack of ray coverage between 80∘ and 150∘ back azimuth hides any other trends.
2.4. Inversion Procedure
Using the regularized, isotropic, least squares inversion method of VanDecar et al. [1995], relative arrival-time residuals are inverted simultaneously for slowness perturbations, source terms, and station statics, account-ing for unresolvable structure, elevation, and distant heterogeneity. Both P wave and S wave models are parameterized identically with B-spline functions under tension [Cline, 1981] constrained by a regular grid of 176,715 knots spanning 35–62∘N and 42–96∘W and 0–1300 km in depth. The central portion of the model is sampled at 33.3 km intervals in depth, 0.25∘ in latitude, and 0.5∘ in longitude. Coarser spacing is used at the extremities to prevent mapping of unwanted structure into the region of interest from the deeper mantle. Ray
Figure 3. Plot of mean relative arrival-time residuals at each station for the (top left)Pwave and (top right)Swave studies. Negative values represent early arrivals (faster), and positive values represent later arrivals (slower). (a, c) Residual histograms forPandS, respectively, grouped by tectonic domain: Superior (SUP, blue), Grenville (GREN, green), Appalachians (APP, red). (b, d) Relative arrival-time residuals forPandS, respectively, for all stations plotted with distance along transect F-F’ that runs perpendicular to the tectonic boundaries (57∘N, 80∘W–41∘N, 65∘W). A linear regression through each data set is plotted in blue (P) and red (S).
tracing between nodes through interpolation allows for the generation of smoothed velocity models, which are independent of knot position.
Overinterpretation of fine-scale structure and inherent nonuniqueness of the models is addressed through the use of regularization, minimizing primary and secondary spatial gradients. These parameters control model complexity (roughness) that trades off against data fit (RMS residual reduction). The MCCC-derived error estimate acts as an optimistic lower bound on data fit, so the ideal model sits above this at the knee of the trade-off curve (supporting information), following an Occam’s razor approach. Our final models fit 95% and 89% of the RMS measured delay-time residuals for P and S, respectively.
3. Resolution Testing
We analyze the recovery of synthetic velocity anomaly models to test the resolving power of both P wave and S wave data sets. We model a cratonic core of Superior lithosphere defined by a𝛿VP=𝛿VS= −3%
veloc-ity anomaly from 50 to 250 km depth, the Grenvillian edge of the Canadian shield as𝛿VP=𝛿VS = −1.5%, 50–250 km depth, and the Phanerozoic Appalachians as a slow velocity anomaly (𝛿VP = 𝛿VS = +3%, 50–250 km depth). Each of these synthetic features extends approximately 500 km in a NE direction (Figure 4). Additionally, we input a narrower, yet longer, slow anomaly (𝛿VP = 𝛿VS = +3%, 100–200 km depth) representing a proposed thermochemical signature of the GMH track [Heaman and Kjarsgaard, 2000]. A Gaussian residual time error component with a standard deviation of 0.02 and 0.1 s for the P wave and S wave data, respectively, is added to the theoretical traveltimes. We then perform inversions using identical parameterization and regularization to our observed data. The P wave model accurately recovers the position
Figure 4. Structural resolution tests showing (left column) input anomalies, (middle column)Pwave model, and (right column)Swave model. Synthetic anomalies are defined by Gaussian functions across their widths. Station locations (white triangles), regional tectonics (magenta), and the GMH track (lilac band) are also marked. Regions with low (<3) ray hits and the top 75 km in cross section are muted due to lack of crossing rays and poor resolution.
of the synthetic anomalies with ∼50% amplitude recovery (Figure 4). The recovery increases with depth beneath the tectonic blocks but decreases beneath the GMH track. In cross section (Figure 4), the anomalies recover the vertical boundaries of the input model but are vertically smeared, particularly at the edges of the model space. The Superior and Appalachian anomalies are both smeared to 400–650 km apparent depth, so the anomalies appear to extend to ∼150% of their actual depth. The Grenvillian anomaly is smeared to a lesser extent (350–500 km apparent depth) due to higher density of crossing rays. The GMH anomaly is well constrained, with vertical smearing of only ∼100 km (Figure 4).
The S wave model also tightly constrains the anomalies spatially, with≥50% amplitude recovery. The extent of vertical smearing (Figure 4) is nearly identical to that in the P wave model with the vertical boundaries pre-served at lithospheric depths. Supporting information shows that input anomalies with dipping interfaces, for both P and S waves, could be recovered (if they existed), and that short-wavelength features are well retrieved in traditional checkerboard tests.
4. Tomographic Models
We present relative arrival-time tomographic models in which velocity perturbations are relative to the regional mean [e.g., Bastow, 2012]; however, our wide-aperture network (∼ 3000 × 2000 km) spans regions of both genuinely fast and slow mantle wave speeds [e.g., Li et al., 2008; Ritsema et al., 2011]. Relative arrival-time studies can be benchmarked on the global scale with the aid of global tomographic models [e.g., Bastow, 2012]. In the upper 400 km of the S40RTS global model [Ritsema et al., 2011] a mean fast wave speed anomaly of𝛿VS = +1.24% exists below −76∘E, 46∘N, where our stations have near-zero relative arrival-time residual.
Peak-to-peak variation within our relative arrival-time data set (Figure 3) is ±0.85 s and ±3.25 s, for P and S waves, respectively. Thus, while the mantle in SE Canada is generally fast compared to the global mean, some of the slowest anomalies in our model could also be slow compared to the global average.
4.1. P Wave Model
The P wave tomographic model (Figure 5) shows heterogeneous wave speed structure beneath SE Canada. East of James Bay, within the Superior craton, a pronounced, laterally robust (Figure 4), fast wave speed (A, 𝛿VP= 0.8%) structure extends to ∼350 km apparent depth showing a vertical southern boundary (Figure 5).
A series of faster wave speed anomalies (B,𝛿VP= 0.6%), trending approximately W-E, extends ≥300 km from the Central Metasedimentary Belt (CMB) to the Appalachian Front (Figure 5). This fast wave speed signature widens and moves to the north with depth and appears to extend to ∼450 km apparent depth. Fast wave speeds also exist beneath Nova Scotia to≥350 km apparent depth. At ≥550 km model depth, a pervasive fast wave speed structure is seen throughout the entire western portion of the study area (Figure 5). A pronounced, well-resolved (Figure 4), slow wave speed anomaly (C) stretches from the southern margin of the study area at the Appalachian coast into the Grenville Province, trending WNW-NW. This anomaly has wave speed pertur-bations of𝛿VP≤1.0% that broaden and migrate to the SW with depth (Figure 5). At model depths ≥250 km,
this transitions into a broad slow wave speed signature beneath the Appalachian terranes. The lithospheric anomalies at model depths≤150 km arguably stretch into the Superior craton, shown at approximately 50∘N, 82∘W. At model depths of 350–450 km, faster wave speeds are seen in the Superior, average in the Grenville and generally slower wave speeds in the Appalachians (Figure 5).
4.2. S wave Model
The S wave model (Figure 6) displays similar features to the P wave model, despite lower ray hits in the east-ern portion. Again, east of James Bay, within the Superior craton, a fast wave speed anomaly (A,𝛿VS ∼1.5%)
extends to≤350 km apparent depth with a vertical southern boundary (Figure 6). Within the Grenville, a strong fast wave speed structure (B) exists beneath the CMB (150–350 km apparent depth). In contrast to the Pwave model, strong fast wave speed anomalies stretching to the east, toward the Appalachian Front, are not seen in the S wave model (Figure 6). In the west, a pervasive fast wave speed (𝛿VS ∼1.5%) anomaly appears below 600 km model depth (Figure 6).
A series of slow wave speed anomalies (𝛿VS = −0.8%) is seen at ∼250 km apparent depth, within the
Supe-rior craton, at around 50∘N, 82∘W, and south of the Grenville boundary, at 46∘N, 80∘W (Figure 6) collocated with the P wave model. To the SE, especially at≤350 km model depth, a 𝛿VS = −1.0% anomaly (C)
termi-nates abruptly at the Appalachian Front but does not transition into a broad slow wave speed structure below this depth.
Figure 5.Pwave model depth slices and cross sections. Station locations are shown as white triangles and the GMH track as a lilac band. The 250 km map also shows station statics, regional tectonics (magenta), and specific anomalies (A, B, and C) discussed in the text. Regions with low (<3) ray hits and the top 75 km in cross section are muted due to lack of crossing rays and poor resolution.
5. Discussion
The North American continent has been shaped by some of the largest tectonic events seen on Earth (e.g., the Grenville orogeny). The features of our models allow us to address some fundamental questions concerning these events. We limit our interpretations to the lithospheric-scale, upper mantle above ∼400 km depth where our resolution is best (Figure 4).
5.1. Age-Progressive Lithospheric Subdivisions
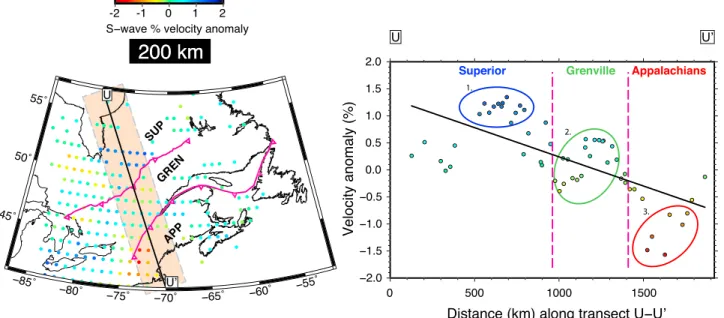
The Superior craton is broadly dominated by early arrivals, the Grenville Province by approximately average arrival times, and the Appalachian terranes by generally later arrivals when compared to the regional mean (Figure 3). The residual histograms (Figure 3), grouped by tectonic domain, also point toward this pattern as the peaks shift toward slower arrivals with decreasing age. Further evidence is provided by the plots of residual against back azimuth (Figure 2) and the increase in residuals with distance along transect F-F’ (Figure 3). In our tomographic models (Figures 5 and 6), the Superior craton is dominated by faster wave speeds, while the Grenville Province contains weaker anomalies of both positive and negative amplitudes. Beneath the Appalachians, slower wave speeds dominate, particularly in the south. Sampling the S wave model (P wave model produces similar results) at 200 km model depth along a transect U-U’ (Figure 7) also confirms an age dependence of seismic wave speed across the region.
Figure 6.Swave model depth slices and cross sections. Plotting conventions as for Figure 5.
Variations in lithospheric thickness [e.g., Bedle and Van der Lee, 2009] and strong station statics beneath Nova Scotia and New Brunswick (Figures 5 and 6), for example, may influence the seemingly clear age-wave speed trend. Furthermore, recent tectonism, largely associated with the passage of the GMH circa 120 Ma ago and the subsequent eruption of kimberlite magmas [Heaman and Kjarsgaard, 2000, Figure 1], may have altered the lithosphere’s Precambrian composition. A series of pervasive low-wave speed anomalies in the western part of the models coincides with the GMH track, crosscutting the Appalachian and Grenville Fronts (Figures 5 and 6, anomaly C). This agrees with lithospheric observations made by many previous authors [e.g., Rondenay et al., 2000; Van der Lee and Frederiksen, 2005; Aktas and Eaton, 2006; Villemaire et al., 2012].
Globally, much variation is seen in the Proterozoic domains that bound Archean lithospheric blocks. In Asia [Lebedev et al., 2009] and southern Africa [James et al., 2001; Ritsema and Van Heijst, 2000; Fouch, 2004], a clear distinction in Archean and Proterozoic lithospheric wave speeds shows a direct link to surface geologi-cal provinces. In Australia and Fennoscandia, however, Archean mantle lithosphere is thought to underlie the Proterozoic domains [Simons et al., 2002; Bruneton et al., 2004; Sandoval et al., 2004; Fishwick et al., 2005], since no systematic wave speed heterogeneity exists. In north China, extensive lithospheric modification perhaps conceals a link between lithospheric wave speed variation and surface provinces [Santosh et al., 2010]. Results from North America are variable. Villemaire et al. [2012] see no clear distinction between Precambrian terranes, whereas Nettles and Dziewonski [2008] argue for a correlation of lithospheric wave speed with sur-face geological age. Beneath Hudson Bay, Darbyshire et al. [2013] also note decreased wave speeds below
Figure 7. (left)Swave tomographic model sampled at 1∘intervals at 200 km depth showing the transect U-U’ crosscutting the Grenville and Appalachian Fronts with a 400 km wideband overlain. (right) Velocity anomaly at all points within 200 km of the transect U-U’ (within the orange band) with respect to distance from the northern end of the line. Points are grouped to aid interpretation where 1 indicates the Superior cratonic interior, 2 the mean wave speed Grenville, and 3 the divot within the lithosphere caused by hot spot-driven thermal-mechanical erosion. Black line, linear regression through the data.
the Proterozoic terranes with respect to the Archean domains at lithospheric depths. Frederiksen et al. [2013] show that the western Superior lithospheric expression is misaligned with the surficial boundary, perhaps linked to modification during the Trans-Hudson orogeny at circa 1.8 Ga ago [Hoffman, 1988]. While the large time period (∼0.8 Ga) between the Grenville and Trans-Hudson orogen means caution must be taken when drawing comparisons, both have characteristics akin to the modern-day Himalayas [e.g., St-Onge et al., 2006; Hynes and Rivers, 2010], suggesting similar processes may have operated in these two orogenies. Our obser-vation of three domains of wave speed (Figures 3 and 5–7) agrees with those seen in Asia, southern Africa, and the Trans-Hudson orogen [e.g., Lebedev et al., 2009; James et al., 2001; Darbyshire et al., 2013]. Whether this can be attributed to secular changes in plate-forming processes over time [e.g., Pearson et al., 1995] is debat-able, given the variability of worldwide observations and potential influence of postformation modification [e.g., Santosh et al., 2010; Frederiksen et al., 2013]. In the following section, we explore potential causes for the observed seismic heterogeneity further.
5.2. Causes of Seismic Heterogeneity
The long-term tectonic stability of our study region suggests that anelasticity and partial melt have little effect on seismic velocities beneath the Canadian Shield [e.g., Sobolev et al., 1996]. The most recent magmatic episode is associated with the passage of the GMH at circa 190–110 Ma ago. Eaton and Frederiksen [2007] per-formed thermal diffusion calculations for a plume head to estimate the thermal signature of the GMH within the lithosphere. A 500∘C temperature anomaly decays to a diffuse anomaly of 80∘C at 200 km depth over 120 Ma. Such a temperature anomaly could account for a significant portion (>50%) of the wave speed anoma-lies within our models (Figures 5 and 6, anomaly C). However, even mantle potential temperature anomaanoma-lies associated with large igneous provinces are generally significantly lower than 500∘C (e.g., 170∘C for the 30 Ma Ethiopian traps [e.g., Rooney et al., 2012]). We thus consider thermal anomalies to have negligible impact on our tomographic images.
Anisotropy can also play a role in wave speed variations [e.g., Babuška and Plomerová, 2006]. However, the consistency between our P wave and S wave studies with approximately perpendicular particle motions, in both the tomographic images (Figures 5 and 6) and residual histograms (Figure 2 and supporting information), and our good back azimuthal coverage of earthquakes (Figure 2), implies that our models are dominated by isotropic wave speed variations. Moreover, shear wave splitting studies in the region [e.g., Levin et al., 1999; Fouch et al., 2000; Frederiksen et al., 2006; Yuan and Levin, 2014; Darbyshire et al., 2015] calculate a mean delay
time (𝛿t) between orthogonally polarized shear waves of ≤1.0 s. This is low relative to more tectonically active areas where splitting measurements,𝛿t, are often ≥1.5 s [e.g., Martin-Short et al., 2015].
At the base of the lithosphere, variation in heat flow across the tectonic domain boundaries is negligible [Mareschal and Jaupart, 2004], so any resulting long wavelength anomalies (>1000 km) associated with the lithospheric mantle would be too large for this study to capture. Surface heat flow measurements are thought to be dominated by crustal radiogenic heat production [Jaupart and Mareschal, 2010]. Intense surface ero-sion of the cratons, and associated loss of radionuclides, means their heat flow is anomalously low (generally ≤50 mW m−2[e.g., Lévy et al., 2010]). Cold cratonic cores are thus often> 200∘C cooler than surrounding,
younger terranes [Mareschal and Jaupart, 2004]. Such thermally derived features would also be expected to be diffuse, in contrast to the abrupt lateral wave speed boundaries within our models (Figures 5 and 6). Eastern North America is thought to require iron depletion to explain the observed wave speed variations [Goes and van der Lee, 2002]. Depletion of the mantle at lithospheric depths also decreases the concentration of radionuclides, resulting in lower temperatures and increasing velocities further still [Hieronymus and Goes, 2010]. This additional compositional effect can cause wave speed variations of up to𝛿VP ≈4% over a few
kilometers and provides a better explanation for the steep gradients in our velocity models than thermal heterogeneity (Figures 5 and 6).
We suggest that the GMH slow wave speed signature is dominated by a compositional element that has decreasing impact on tectonic domains (Figures 5 and 6, anomaly C) of increasing age [Villemaire et al., 2012]. We observe a southwestward offset [cf. Eaton and Frederiksen, 2007] of the lithospheric anomaly with depth, collocated with other studies [e.g., Villemaire et al., 2012]; and thus, we favor the view that the hot spot has exploited rift-weakened lithosphere within the shield [Rondenay et al., 2000; Aktas and Eaton, 2006; Villemaire et al., 2012]. Our improved resolution over Villemaire et al. [2012] also allows us to image the low-wave speed anomaly in the Superior craton (Figures 5 and 6, anomaly C) which Frederiksen et al. [2013] attributed to cra-tonic modification by the GMH. We argue that Archean lithosphere is thus more resistant to thermochemical erosion during hot spot tectonism than younger Proterozoic and Phanerozoic lithosphere, but not completely immune to modification—mechanically strong does not mean geochemically immune. Keels may thus not be entirely stagnant features as traditionally thought. Next, we discuss these ideas in the context of keel formation and development, with emphasis on processes that occurred during the Grenville orogeny.
5.3. Formation and Evolution of Lithospheric Keels
The formation mechanism of cratonic lithosphere is debated [e.g., Lee et al., 2011], in particular the devel-opment of their deep-seated (∼250 km), long-lived keels [e.g., Bedle and Van der Lee, 2009], which may [e.g., Simons et al., 2002; Yuan et al., 2011; Schaeffer and Lebedev, 2014], or may not [e.g., James et al., 2001], extend beneath both Proterozoic and Archean terranes. Distinct wave speed anomalies beneath the Superior cra-ton and Grenville Province are separated by a vertical wave speed boundary (Figures 5 and 6) that extends to ∼400 km apparent depth. This feature is vertically smeared, however (Figure 4), so the true extent is more likely confined to the region’s ∼250 km thick lithosphere [e.g., Bedle and Van der Lee, 2009]. When consid-ered against the background of absolute wave speed models [e.g., Ritsema et al., 2011; Schaeffer and Lebedev, 2014], the lateral isotropic velocity variation (from fast to average) at the Grenville Front (Figures 2, 3, and 5–7) may arise from a change in chemical depletion between Archean and Proterozoic provinces, as suggested by Darbyshire et al. [2013] in the Trans-Hudson orogen and other authors worldwide (e.g., southern Africa [Begg et al., 2009; Youssof et al., 2015]).
While our tomographic models do not require a layered lithosphere to explain them (body wave tomogra-phy would be a poor way to constrain horizontal interfaces such as a midlithospheric discontinuity (MLD) or lithosphere-asthenosphere boundary (LAB)), they are consistent with the expectation of a lower velocity region beneath a core of highly depleted Superior cratonic lithosphere that is present at shallower depths beneath the Grenville Province [Yuan and Romanowicz, 2010]. This supports the model for two-stage forma-tion of lithospheric keels [e.g., Yuan and Romanowicz, 2010; Darbyshire et al., 2013] that predicts a fast wave speed Archean core formed, followed by the accretion of slightly slower wave speed material beneath the Archean and Proterozoic provinces. In a purely lateral sense, we may reliably sample the decrease in chemical depletion across the Grenville Front in the model of Yuan and Romanowicz [2010], suggesting that keel sta-bilization was not restricted to Archean times. However, as discussed below, this wave speed variation may also be interpreted as evidence for metasomatic enrichment of Archean material rather than a less-depleted composition derived from Proterozoic keel formation.
5.4. Implications for the Grenville Orogeny
Our observed vertical wave speed boundary between the Superior craton and Grenville Province (Figures 5 and 6) is not easily reconciled with previous studies spanning the Grenville Front. LITHOPROBE [e.g., Clowes, 2010] wide-angle seismic images [e.g., Ludden and Hynes, 2000; White et al., 2000] (Figure 8a) reveal Supe-rior material underthrusting the Grenville Province by>300 km to the SE, a feature thought to intersect the Moho and continue dipping into the mantle. This is consistent with general models for lithospheric growth at the margins of cratons [e.g., Snyder, 2002] and those specific to Grenville Province development [Rondenay et al., 2000]. Such models invoke a split incoming plate of Proterozoic age in which an upper crustal layer is thrust above the older cratonic Archean material, while the deeper layer is subducted. Furthermore, Hanmer et al. [2000] suggested SE oriented subduction occurred beneath Amazonia during the Grenvillian collision with Laurentia [Hoffman, 1999; Condie, 2001]. Alternatively, Rivers [1997] and Rivers and Corrigan [2000] advo-cate a protracted period of subduction (∼300 Ma) in the opposite direction beneath the Laurentian margin, leading to enrichment of Grenvillian mantle material [Chiarenzelli et al., 2010]. This wealth of often-conflicting research suggests that, drawing from section 5.1, our results may best be interpreted in light of lithospheric modification during, or after, the Grenville orogeny, rather than secular variation in plate formation processes. In the following sections, we explore the observational and theoretical evidence for craton edge modification, before presenting a new model for the development of the Grenville orogen (Figure 8).
5.4.1. Mechanisms for Craton Edge Modification
Growing evidence suggests that under certain conditions, cratonic lithosphere can be modified by subduc-tion zone interacsubduc-tion or hot spot tectonism [e.g., Nolet and Zielhuis, 1994; Rondenay et al., 2000]. For example, both convection in the mantle wedge [Menzies et al., 2007] and metasomatism of the overriding material by fluids derived from the downgoing slab [Kusky et al., 2007] have been used to explain destabilization of the North China craton. Such theories invoke processes related to the stagnant slab associated with the subduc-tion of the Pacific plate. In southern Africa [e.g., Youssof et al., 2015, and references therein] and Europe [Nolet and Zielhuis, 1994; Pedersen et al., 2013], authors have also argued that subduction beneath the craton edge has caused modification of the cratonic lithosphere, through metasomatism. Geodynamical modeling sup-ports the view that metasomatic enrichment of the lithospheric keel is a plausible cause of weakening or modification [e.g., Wang et al., 2015]. In central Canada, Frederiksen et al. [2013] noted that the western margin of the Superior craton at lithospheric depths does not correlate with surface geology, implying the keel was eroded or modified during the Trans-Hudson orogeny. Additionally, Eaton and Frederiksen [2007] and Kaban et al. [2015] proposed that sublithospheric mantle flow patterns have modified the keel since the opening of the Atlantic.
Viable mechanisms to produce the vertical wave speed boundary beneath the Grenville Front (Figures 5 and 6) are limited, since subvertical or shallower plate-scale processes dominate traditional collisional settings. However, craton edge modification may involve small-scale convection [e.g., Bao et al., 2014], gravitational destabilization of the lithosphere [e.g., Kusky et al., 2007], and broad-scale metasomatism [e.g., Nolet and Zielhuis, 1994; Chiarenzelli et al., 2010; Pedersen et al., 2013; Youssof et al., 2015] associated with subduction beneath the cratonic margin.
Bao et al. [2014] documented an abrupt wave speed transition from craton to Cordillera in western Canada which they attributed to lithospheric modification through subduction zone interaction. They postulated that a protostep in the lithospheric base initiated small-scale convection and thus exploited the zone of weakness between the craton and the thickened lithospheric margin. This could produce a comparable signature to that seen beneath the Archean/Proterozoic boundary in our models (Figures 5 and 6). However, it is unclear why a broadly homogeneous Superior (or Laurentian) lithosphere would have had an existing, exploitable protostep or vertical weak boundary, so this is unlikely to explain our observations. Alternatively, a vertical boundary in wave speed could result from metasomatism of the cratonic wedge above a subducting plate [e.g., Nolet and Zielhuis, 1994; Kusky et al., 2007; Chiarenzelli et al., 2010; Pedersen et al., 2013; Youssof et al., 2015]. This process can result in lithospheric gravitational destabilization [e.g., Kusky et al., 2007], whereby the vertical wave speed boundary may delineate the detachment front of the foundering lithosphere. However, a foundering lithospheric wedge may interact with the downgoing slab but would not manifest in a present-day seismological signature. We therefore suggest that broad-scale metasomatism [e.g., Nolet and Zielhuis, 1994; Chiarenzelli et al., 2010; Pedersen et al., 2013], pervasively lowering seismic wave speed [e.g., O’Reilly and Griffin, 2006], is the most likely mechanism for craton edge modification in SE Canada.
Figure 8. (c–f ) Schematic summary of the tectonic interpretation used to explain the presented (a and b) geophysical and geological data sets. The LITHOPROBE seismic profile (Figure 8a) across the Grenville Front (GF) is adapted from the interpretation of Ludden and Hynes [2000], derived from the GLIMPCE-J line, Abitibi-Grenville lines 31–33, and Lake Ontario line 71 [after White et al., 2000]. Y and R (2010) refer to Yuan and Romanowicz [2010] who proposed a midlithospheric discontinuity (MLD) beneath the craton by imaging a change in anisotropy between 50 and 160 km depth. Anomalies are labeled as in Figures 5 and 6.
5.4.2. Model for Grenville Province Development
Finally, we propose a new model for Grenville Province development (Figure 8) to reconcile our seismological observations (Figures 5 and 6) with geological constraints [Hanmer et al., 2000; Ludden and Hynes, 2000; Rivers and Corrigan, 2000; Chiarenzelli et al., 2010; Hynes and Rivers, 2010] and studies of tectonic processes at cratonic margins [e.g., Nolet and Zielhuis, 1994; Rondenay et al., 2000; Snyder, 2002; Pedersen et al., 2013]. Convergence between Laurentia and Amazonia [Condie, 2001] initiated a>300 Ma Andean-style subduction system [Rivers and Corrigan, 2000] dipping to the NW (present-day coordinates). As the slab descends, assuming the mantle wedge is sufficiently saturated and corner flow convection is weak [Iwamori, 1998; Peacock, 1990], fluids rise
approximately vertically (Figure 8c). Schmidt and Poli [1998] used experimental results to propose that under typical conditions, the majority of fluid release occurs when the slab is≤200 km deep. Thus, depending on slab dip, there is a lateral bound on this process that extends from the trench into the Laurentian margin— this is the metasomatic front.
Fluid infiltration of the cratonic wedge enriches the Grenvillian mantle [Chiarenzelli et al., 2010; Hynes and Rivers, 2010] as a result of metasomatism (Figures 8c and 8d) [e.g., Nolet and Zielhuis, 1994; Kusky et al., 2007]. This lowers the wave speed [e.g., O’Reilly and Griffin, 2006] up to the metasomatic front within the Lauren-tian margin, directly below the modern-day surface expression of the Grenville Front (Figures 5 and 6). While the collocation of the Grenville and metasomatic fronts may be slightly fortuitous (due to the inherent con-trol of slab geometry), we speculate that the Grenville Orogeny did not propagate further into the North American continent because it encountered the stronger, unmodified Superior lithosphere. This would pro-vide an explanation for the abrupt change in metamorphic grade across this tectonic boundary [e.g., Hynes and Rivers, 2010].
Initially, subduction proceeds beneath Laurentia [e.g., Rivers and Corrigan, 2000] but reverses in direction prior to the continental collision [Hynes and Rivers, 2010]. This positions Amazonia as the overriding plate, allowing the reworked material between the two continental cores to be thrust above the Archean-age, metasoma-tized Laurentian cratonic wedge or indentor (in agreement with observations of Hanmer et al. [2000], Ludden and Hynes [2000], Rondenay et al. [2000], and Snyder [2002]) (Figures 8d and 8e). Although the order of subduc-tion phases could be reversed [e.g., Snyder, 2002], due to the timescale (≥300 Ma) over which the Laurentian margin formed the overriding plate in the subduction system [e.g., Rivers, 1997] and the likelihood that clo-sure between Amazonia and Laurentia would have been initiated with oceanic subduction, it seems that our model (Figure 8) presents the most likely option.
Anomaly B in our tomographic images is consistent with a reversal in subduction polarity, although this may be at the limit of our resolution (see checkerboard tests in the supporting information). A reversal in subduc-tion polarity could be caused by buoyant material caught in the trench [Stern, 2004] of an existing subducsubduc-tion zone, feasibly provided by significant arc magmatism preceding the continental collision [Hynes and Rivers, 2010]. This is supported by the pre-Grenvillian SE dipping feature noted by Aktas and Eaton [2006] and Adetunji et al. [2014] and closure of a back arc proximal to the CMB prior to termination of the Grenville orogeny [Rivers and Corrigan, 2000]. Additionally, the collision of the two continents and the accreted arcs [Hynes and Rivers, 2010], plus the metasomatism from two subduction intervals would allow for the notable heterogeneity in wave speed within the Grenville Province (Figures 5 and 6).
After the termination of the Grenville orogeny, the reduced wave speed region of depleted Grenvillian mate-rial (and perhaps some reworked collisional remnants) begins to cool and may allow the formation of a thermal boundary layer, a common feature of typical convective systems. The lithospheric keel beneath both Superior and the Grenville is thus extended in depth (Figure 8f ) forming the lower layer in the model of Yuan and Romanowicz [2010]. Our tomographic models do not require this feature, but keel stratification is widely recognized globally [e.g., Simons et al., 2002; Griffin et al., 2003; Yuan and Romanowicz, 2010; Darbyshire et al., 2013]. Our model therefore leans toward lateral accretion of terranes as the main driver for formation of the greater Canadian Shield but implies that vertically driven processes dominate the subsequent pervasive alteration.
6. Conclusion
Using the highest resolution P wave and S wave tomographic models of southeast Canada to date, we show three broad regions of increasing wave speed, a slow Phanerozoic Appalachian terrane, an average wave speed Grenville Province, and a fast wave speed Superior cratonic interior. Differing wave speeds within the Precambrian domains could imply markedly different processes acting in the Archean. A low-wave speed series of anomalies correlates well with the Great Meteor hot spot track. The anomaly amplitudes decrease toward the cratonic interior, implying increased resistance to modification with age of tectonic domain. In a purely lateral sense, the extent of faster wave speeds within the shield matches that predicted by the two-stage formation model for lithospheric keels: the chemically depleted core formed in the Archean and the thermally accreted, less-depleted boundary layer formed in the Proterozoic. Our results, therefore, may sup-port the idea that keel formation was not restricted to Archean times. However, to explain the pronounced ver-tical wave speed boundary beneath the Grenville Front and previously published results, we instead propose
a model for modification of the Laurentian margin due to subduction beneath the continent. In this model, we invoke Paleoproterozoic metasomatic fluid release to decrease the wave speed of the material beneath the Grenville Province; consequently, a vertical wave speed boundary beneath the Grenville Front is seen today. Subduction-driven modification of the North American craton edge suggests that cratons may not neces-sarily be entirely stagnant features over geological time. Apparent variations in mantle wave speed between Archean and Proterozoic domains worldwide may thus be explained better by postformation metasomatic enrichment than by variations in iron depletion levels at the time of plate formation.
References
Abt, D., K. Fischer, S. French, H. Ford, H. Yuan, and B. Romanowicz (2010), North American lithospheric discontinuity structure imaged by Ps and Sp receiver functions, J. Geophys. Res., 115, B09301, doi:10.1029/2009JB006914.
Adetunji, A. Q., I. J. Ferguson, and A. G. Jones (2014), Crustal and lithospheric scale structures of the Precambrian Superior-Grenville margin,
Tectonophysics, 614, 146–169, doi:10.1016/j.tecto.2013.12.008.
Aktas, K., and D. W. Eaton (2006), Upper-mantle velocity structure of the lower Great Lakes region, Tectonophysics, 420(1), 267–281, doi:10.1016/j.tecto.2006.01.020.
Babuška, V., and J. Plomerová (2006), European mantle lithosphere assembled from rigid microplates with inherited seismic anisotropy,
Phys. Earth Planet. Inter., 158(2), 264–280, doi:10.1016/j.pepi.2006.01.010.
Bao, X., D. W. Eaton, and B. Guest (2014), Plateau uplift in western Canada caused by lithospheric delamination along a craton edge, Nat.
Geosci., 7(11), 830–833, doi:10.1038/ngeo2270.
Bastow, I. (2012), Relative travel-time upper-mantle tomography and the elusive background mean, Geophys. J. Int., 190(2), 1271–1278, doi:10.1111/j.1365-246X.2012.05559.x.
Bastow, I., G. Stuart, J.-M. Kendall, and C. Ebinger (2005), Upper-mantle seismic structure in a region of incipient continental breakup: Northern Ethiopian rift, Geophys. J. Int., 162(2), 479–493, doi:10.1111/j.1365-246X.2005.02666.x.
Bastow, I., A. Nyblade, G. Stuart, T. Rooney, and M. Benoit (2008), Upper mantle seismic structure beneath the Ethiopian hotspot: Rifting at the edge of the African low velocity anomaly, Geochem. Geophys. Geosyst., 9, Q12022, doi:10.1029/2008GC002107.
Bedle, H., and S. Van der Lee (2009), S velocity variations beneath North America, J. Geophys. Res., 114, B07308, doi:10.1029/2008JB005949. Begg, G., et al. (2009), The lithospheric architecture of Africa: Seismic tomography, mantle petrology, and tectonic evolution, Geosphere,
5(1), 23–50, doi:10.1130/GES00179.1.
Bruneton, M., et al. (2004), Complex lithospheric structure under the central Baltic Shield from surface wave tomography, J. Geophys. Res.,
109, B10303, doi:10.1029/2003JB002947.
Burdick, S., R. D. van der Hilst, F. L. Vernon, V. Martynov, T. Cox, J. Eakins, G. H. Karasu, J. Tylell, L. Astiz, and G. L. Pavlis (2014), Model update January 2013: Upper mantle heterogeneity beneath North America from travel-time tomography with global and USArray transportable array data, Seismol. Res. Lett., 85(1), 77–81, doi:10.1785/0220130098.
Chiarenzelli, J., M. Lupulescu, B. Cousens, E. Thern, L. Coffin, and S. Regan (2010), Enriched Grenvillian lithospheric mantle as a consequence of long-lived subduction beneath Laurentia, Geology, 38(2), 151–154, doi:10.1130/G30342.1.
Cline, A. (1981), FITPAK—Software Package for Curve and Surface Fitting Employing Splines Under Tension, Dep. of Comput. Sci., Univ. of Texas, Austin, Tex.
Clowes, R. M. (2010), Initiation, development, and benefits of Lithoprobe—Shaping the direction of Earth science research in Canada and beyond, Can. J. Earth Sci., 47(4), 291–314, doi:10.1139/E09-074.
Condie, K. (2001), Continental growth during formation of Rodinia at 1.35–0.9 Ga, Gondwana Res., 4(1), 5–16, doi:10.1016/S1342-937X(05)70650-X.
Darbyshire, F., D. Eaton, and I. Bastow (2013), Seismic imaging of the lithosphere beneath Hudson Bay: Episodic growth of the Laurentian mantle keel, Earth Planet. Sci. Lett., 373, 179–193, doi:10.1016/j.epsl.2013.05.002.
Darbyshire, F., I. Bastow, A. Forte, T. Hobbs, A. Calvel, A. Gonzalez-Monteza, and B. Schow (2015), Variability and origin of seismic anisotropy across eastern Canada: Evidence from shear wave splitting measurements, J. Geophys. Res. Solid Earth, 120, 8404–8421, doi:10.1002/2015JB012228.
Dickin, A. (2000), Crustal formation in the Grenville Province: Nd-isotope evidence, Can. J. Earth Sci., 37(2–3), 165–181, doi:10.1139/cjes-2012-0161.
Eaton, D., and A. Frederiksen (2007), Seismic evidence for convection-driven motion of the North American plate, Nature, 446(7134), 428–431, doi:10.1038/nature05675.
Ernst, R., and W. Bleeker (2010), Large igneous provinces (LIPs), giant dyke swarms, and mantle plumes: Significance for breakup events within Canada and adjacent regions from 2.5 Ga to the present, Can. J. Earth Sci., 47(5), 695–739, doi:10.1139/E10-025.
Fishwick, S., B. Kennett, and A. Reading (2005), Contrasts in lithospheric structure within the Australian craton-insights from surface wave tomography, Earth Planet. Sci. Lett., 231(3–4), 163–176, doi:10.1016/j.epsl.2005.01.009.
Foley, S. F. (2008), Rejuvenation and erosion of the cratonic lithosphere, Nat. Geosci., 1(8), 503–510, doi:10.1038/ngeo261.
Fouch, M., A. Fischer, E. Parmentier, M. Wysession, and T. Clarke (2000), Shear wave splitting, continental keels, and patterns of mantle flow,
J. Geophys. Res., 105, 6255–6276, doi:10.1029/1999JB900372.
Fouch, M. J. (2004), Mantle seismic structure beneath the Kaapvaal and Zimbabwe cratons, S. Afr. J. Geol., 107(1–2), 33–44, doi:10.2113/107.1-2.33.
Frederiksen, A., T. Bollmann, F. Darbyshire, and S. Van der Lee (2013), Modification of continental lithosphere by tectonic processes: A tomographic image of central North America, J. Geophys. Res. Solid Earth, 118, 1051–1066, doi:10.1002/jgrb.50060.
Frederiksen, A. W., I. J. Ferguson, D. Eaton, S. K. Miong, and E. Gowan (2006), Mantle fabric at multiple scales across an Archean-Proterozoic boundary, Grenville Front, Canada, Phys. Earth Planet. Inter., 158(2–4), 240–263.
Goes, S., and S. van der Lee (2002), Thermal structure of the North American uppermost mantle inferred from seismic tomography,
J. Geophys. Res., 107(B3), 2050, doi:10.1029/2000JB000049.
Griffin, W., S. O’Reilly, N. Abe, S. Aulbach, R. Davies, N. Pearson, B. Doyle, and K. Kivi (2003), The origin and evolution of Archean lithospheric mantle, Precambrian Res., 127(1), 19–41, doi:10.1016/S0301-9268(03)00180-3.
Griffin, W., S. O’Reilly, J. Afonso, and G. Begg (2009), The composition and evolution of lithospheric mantle: A re-evaluation and its tectonic implications, J. Petrol., 50(7), 1185–1204, doi:10.1093/petrology/egn033.
Acknowledgments
A.B. is funded by the NERC Doctoral Training Partnership: Science and Solutions for a Changing Planet. I.B. is funded by the Leverhulme Trust. F.D. acknowledges funding from NSERC through their Discovery grants and Canada Research Chairs pro-gram. We thank J. VanDecar for use of his tomographic inversion and MCCC codes. SAC [Helffrich et al., 2013] and GMT [Wessel and Smith, 1995] software were also used to process seismic data obtained from the IRIS DMC and from the Canadian National Data Centre (Natural Resources Canada). A digital supple-ment is also available to download containing models and the processed relative arrival-time data set, additional information is available from A.B. (email: alistair.boyce10@imperial.ac.uk). Discussing the implications of our tomographic results with S. Goes and A. Hynes provided great motivation for this manuscript. Two anony-mous reviewers helped clarify our interpretations.
Hanmer, S., D. Corrigan, S. Pehrsson, and L. Nadeau (2000), SW Grenville Province, Canada: The case against post-1.4 Ga accretionary tectonics, Tectonophysics, 319(1), 33–51, doi:10.1016/S0040-1951(99)00317-0.
Hatcher, R. (2005), Southern and central Appalachians, in Encyclopedia of Geology, edited by R. C. Selley, L. R. M. Cocks, and I. R. Plimer, pp. 72–81, Elsevier Acad. Press, Amsterdam.
Heaman, L., and B. Kjarsgaard (2000), Timing of eastern North American kimberlite magmatism: Continental extension of the Great Meteor hotspot track?, Earth Planet. Sci. Lett., 178(3), 253–268, doi:10.1016/S0012-821X(00)00079-0.
Helffrich, G., J. Wookey, and I. Bastow (2013), The Seismic Analysis Code: A Primer and User’s Guide, Cambridge Univ. Press, Cambridge, U. K. Hieronymus, C., and S. Goes (2010), Complex cratonic seismic structure from thermal models of the lithosphere: Effects of variations in deep
radiogenic heating, Geophys. J. Int., 180(3), 999–1012, doi:10.1111/j.1365-246X.2009.04478.x.
Hoffman, P. (1988), United Plates of America, the birth of a craton—Early Proterozoic assembly and growth of Laurentia, Annu. Rev. Earth
Planet. Sci., 16, 543–603, doi:10.1146/annurev.ea.16.050188.002551.
Hoffman, P. (1990), Geological constraints on the origin of the mantle root beneath the Canadian shield, Philos. Trans. R. Soc. A, 331(1620), 523–532, doi:10.1098/rsta.1990.0087.
Hoffman, P. (1999), The break-up of Rodinia, birth of Gondwana, true polar wander and the snowball Earth, J. Afr. Earth Sci., 28(1), 17–35, doi:10.1016/S0899-5362(99)00018-4.
Hynes, A., and T. Rivers (2010), Protracted continental collision—Evidence from the Grenville orogen, Can. J. Earth Sci., 47(5), 591–620, doi:10.1139/E10-003.
Iwamori, H. (1998), Transportation of H2O and melting in subduction zones, Earth Planet. Sci. Lett., 160(1–2), 65–80, doi:10.1016/S0012-821X(98)00080-6.
James, D., M. Fouch, J. VanDecar, and S. Van der Lee (2001), Tectonospheric structure beneath southern Africa, Geophys. Res. Lett., 28(13), 2485–2488, doi:10.1029/2000GL012578.
Jaupart, C., and J.-C. Mareschal (2010), Heat Generation and Transport in the Earth, Cambridge Univ. Press, New York. Jordan, T. (1988), Structure and formation of the continental tectosphere, J. Petrol., special lithosphere issue, 11–37,
doi:10.1093/petrology/Special_Volume.1.11.
Kaban, M., W. Mooney, and A. Petrunin (2015), Cratonic root beneath North America shifted by basal drag from the convecting mantle, Nat.
Geosci., 8(10), 797–800, doi:10.1038/ngeo2525.
Kamo, S. L., T. E. Krogh, and P. S. Kumarapeli (1995), Age of the Grenville dyke swarm, Ontario-Québec: Implications for the timing of Iapetan rifting, Can. J. Earth Sci., 32(3), 273–280, doi:10.1139/e95-022.
Kennett, B., and E. Engdahl (1991), Traveltimes from global earthquake location and phase identification, Geophys. J. Int., 105(2), 429–465. Kusky, T., B. Windley, and M. Zhai (2007), Tectonic evolution of the North China Block: From orogen to craton to orogen, Geol. Soc. London
Spec. Pub., 280(1), 1–34, doi:10.1144/SP280.1.
Lebedev, S., and R. Van Der Hilst (2008), Global upper-mantle tomography with the automated multimode inversion of surface and S-wave forms, Geophys. J. Int., 173(2), 505–518, doi:10.1111/j.1365-246X.2008.03721.x.
Lebedev, S., J. Boonen, and J. Trampert (2009), Seismic structure of Precambrian lithosphere: New constraints from broad-band surface-wave dispersion, Lithos, 109(1–2), 96–111, doi:10.1016/j.lithos.2008.06.010.
Lee, C., P. Luffi, and E. Chin (2011), Building and destroying continental mantle, Annu. Rev. Earth Planet. Sci., 39, 59–90, doi:10.1146/annurev-earth-040610-133505.
Leki´c, V., and B. Romanowicz (2011), Inferring upper-mantle structure by full waveform tomography with the spectral element method,
Geophys. J. Int., 185(2), 799–831, doi:10.1111/j.1365-246X.2011.04969.x.
Lenardic, A., and L. Moresi (1999), Some thoughts on the stability of cratonic lithosphere: Effects of buoyancy and viscosity, J. Geophys. Res.,
104(B6), 12,747–12,758, doi:10.1029/1999JB900035.
Levin, V., W. Menke, and J. Park (1999), Shear wave splitting in the Appalachians and the Urals: A case for multilayered anisotropy, J. Geophys.
Res., 104(B8), 17,975–17,993, doi:10.1029/1999JB900168.
Lévy, F., C. Jaupart, J. Mareschal, G. Bienfait, and A. Limare (2010), Low heat flux and large variations of lithospheric thickness in the Canadian Shield, J. Geophys. Res., 115, B06404, doi:10.1029/2009JB006470.
Li, C., R. Van der Hilst, R. Engdahl, and S. Burdick (2008), A new global model forPwave speed variations in Earth’s mantle, Geochem.
Geophys. Geosyst., 9, Q05018, doi:10.1029/2007GC001806.
Ludden, J., and A. Hynes (2000), The Lithoprobe Abitibi-Grenville transect: Two billion years of crust formation and recycling in the Precambrian Shield of Canada, Can. J. Earth Sci., 37(2–3), 459–476, doi:10.1139/e99-120.
Mareschal, J., and C. Jaupart (2004), Variations of surface heat flow and lithospheric thermal structure beneath the North American craton,
Earth Planet. Sci. Lett., 223(1–2), 65–77, doi:10.1016/j.epsl.2004.04.002.
Martin-Short, R., R. M. Allen, I. D. Bastow, E. Totten, and M. A. Richards (2015), Mantle flow geometry from ridge to trench beneath the Gorda-Juan de Fuca plate system, Nat. Geosci., 8, 965–968, doi:10.1038/ngeo2569.
Menzies, M., Y. Xu, H. Zhang, and W. Fan (2007), Integration of geology, geophysics and geochemistry: A key to understanding the North China Craton, Lithos, 96(1–2), 1–21, doi:10.1016/j.lithos.2006.09.008.
Nettles, M., and A. Dziewonski (2008), Radially anisotropic shear velocity structure of the upper mantle globally and beneath North America,
J. Geophys. Res., 113, B02303, doi:10.1029/2006JB004819.
Nolet, G., and A. Zielhuis (1994), Low S velocities under the Tornquist-Teisseyre zone: Evidence for water injection into the transition zone by subduction, J. Geophys. Res., 99(B8), 15,813–15,820, doi:10.1029/94JB00083.
O’Reilly, S., and W. Griffin (2006), Imaging global chemical and thermal heterogeneity in the subcontinental lithospheric mantle with garnets and xenoliths: Geophysical implications, Tectonophysics, 416(1–4), 289–309, doi:10.1016/j.tecto.2005.11.014.
Peacock, S. (1990), Fluid processes in subduction zones, Science, 248(4953), 329–337, doi:10.1126/science.248.4953.329.
Pearson, D., R. Carlson, S. Shirey, and F. Boyd (1995), Stabilisation of Archaean lithospheric mantle: A Re-Os isotope study of peridotite xenoliths from the Kaapvaal craton, Earth Planet. Sci. Lett., 134(3), 341–357, doi:10.1016/0012-821X(95)00125-V.
Pedersen, H., E. Debayle, and V. Maupin (2013), Strong lateral variations of lithospheric mantle beneath cratons—Example from the Baltic Shield, Earth Planet. Sci. Lett., 383, 164–172, doi:10.1016/j.epsl.2013.09.024.
Petit, C., and C. Ebinger (2000), Flexure and mechanical behavior of cratonic lithosphere: Gravity models of the East African and Baikal rifts,
J. Geophys. Res., 105(B8), 19,151–19,162, doi:10.1029/2000JB900101.
Petrescu, L., I. D. Bastow, F. A. Darbyshire, A. Gilligan, T. Bodin, W. Menke, and V. Levin (2016), Three billion years of crustal evolution in eastern Canada: Constraints from receiver functions, J. Geophys. Res. Solid Earth, 121, 788–811, doi:10.1002/2015JB012348. Ritsema, J., and H. Van Heijst (2000), New seismic model of the upper mantle beneath Africa, Geology, 28(1), 63–66,