Simple liquid
chromatography‑electrospray
ionization ion trap mass
spectrometry method
for the quantification
of galacto‑oxylipin arabidopsides
in plant samples
Manon Genva
1*, Mats X. Andersson
2& Marie‑Laure fauconnier
1A simple and sensitive method to quantify five different arabidopsides by HPLC—ion trap mass spectrometry in complex plant samples was developed and validated. Arabidopsides are oxidized galactolipids first described in Arabidopsis thaliana but also produced by other plant species under stress conditions. External calibration was performed using arabidopsides purified from freeze-thawed Arabidopsis leaves. Lipids were extracted and pre-purified on an SPE silica column before HPLC–MS analysis. Arabidopsides were separated on a C18 column using a gradient of mQ water and acetonitrile:mQ water (85:15) supplemented with formic acid (0.2%) and ammonium formate (12 mM). The method was validated according to European commission decision 2002/657/CE. LOD, LOQ, linearity, intra-day and inter-day precision and accuracy, selectivity, matrix effects and recoveries were determined for the five metabolites. The established method is highly selective in a complex plant matrix. LOD and LOQ were, respectively, in the range 0.098–0.78 and 0.64–1.56 µM, allowing the arabidopside quantification from 25.6–62.4 nmol/g fresh weight. Calibration curve correlation coefficients were higher than 0.997. Matrix effects ranged from -2.09% to 6.10% and recoveries between 70.7% and 109%. The method was successfully applied to complex plant matrixes: Arabidopsis thaliana and Nasturtium officinale.
Oxylipins are structurally diverse plant metabolites produced following the oxidation of unsaturated fatty acids and include aldehydes, divinyl ethers, oxo-, keto-, hydroxyl- and hydroperoxy acids1–3. These molecules play
crucial roles in plants, as they are involved in developmental processes and defence responses4. Among the
differ-ent families of plant oxylipins, jasmonates comprise all molecules formed after α-linolenic and hexadecatrienoic acids enzymatic transformation into jasmonic acid and its wide range of derivatives. Indeed, jasmonic acid can be converted by many metabolic pathways into different active, inactive or partially active compounds, showing the high complexity of the jasmonate pathways. Those ubiquitous plant metabolites have been studied for many years, as both jasmonic acid derivatives and some of its precursors modulate plant gene expression, leading in crucial modifications in plant developmental, physiological and defence processes5. As examples, jasmonic acid
derivatives and its precursors are directly implicated in flower development, leaf senescence, seed maturation, the attraction of insects for pollination and defence against herbivores3–5. Besides functions as signals in planta,
in vitro experiments showed high antimicrobial activities of various oxylipins against diverse pathogens: bacteria,
open
1Laboratory of Chemistry of Natural Molecules, Gembloux Agro‐Bio Tech, University of Liège, Passage des
Déportés 2, 5030 Gembloux, Belgium. 2Department of Biological and Environmental Sciences, University of
fungi and oomycetes6–9. These experiments have also shown that different oxylipins and their stereoisomers have
distinct biological activities against pathogens4. Moreover, it was recently reported that some oxylipin-like fatty
acid hydroperoxides interact with plant plasma membrane lipids in vitro and can modify the plasma membrane organization10. All these reported insights highlight the crucial functions of plant oxylipins in defence responses
and the likely role of these compounds in plant–pathogen interactions4.
While free oxylipins have been well studied and characterized, the biological properties of esterified glyc-erolipids like arabidopsides are still understudied. These oxylipins are produced following the enzymatic oxida-tion of chloroplast monogalactosyldiacylglycerols (MGDG) and digalactosyldiacylglycerols (DGDG), under a wide range of stress conditions (mechanical wounding, bacterial infection, low-temperature treatment etc.)6,9,11–14.
Arabidopsides were initially described in Arabidopsis thaliana (L.) Heynh (hereafter Arabidopsis)15,16 but were
subsequently also found in other plant species and families17–22. A wide range of different arabidopsides has now
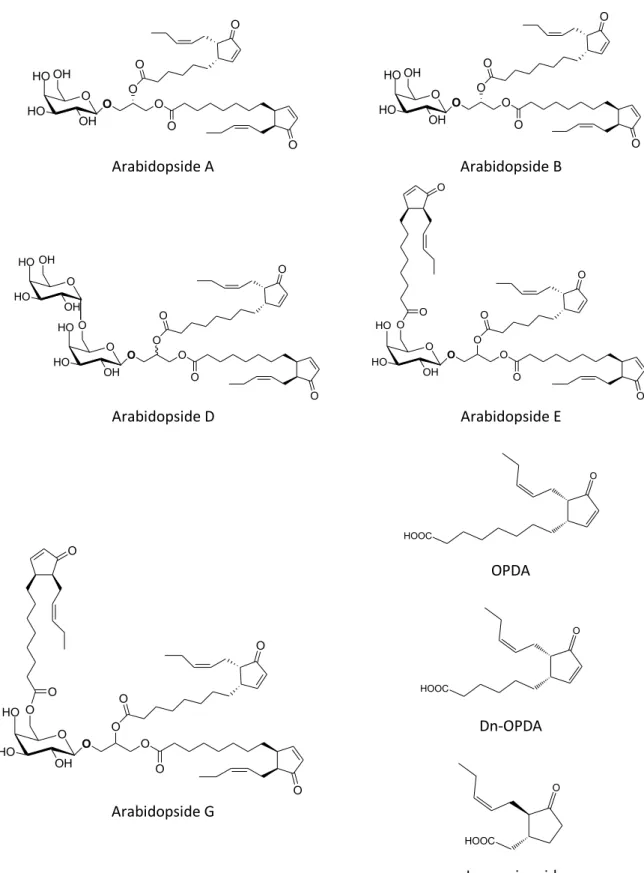
been described, all of them containing at least one galactose and one esterified 12-oxo-phytodienoic acid (OPDA) or its 16C analogue, 12-dinor-oxo-phytodienoic acid (dn-OPDA). Free OPDA and dn-OPDA are both involved in jasmonic acid synthesis. Some typical arabidopside structures3 are gathered in Fig. 1. Arabidopsides A, B, D,
E and G are the major arabidopside molecules found in plant species. Other arabidopsides, such as arabidopside C, have also already been found in some plant species, but in much lower quantities11.
The true function of arabidopsides in planta remains unclear, but it has been suggested that these compounds may play important roles in defence responses and developmental processes. Some arabidopsides can induce growth inhibition of cress roots16,23, and arabidopsides can accumulate in high proportions (up to ± 10% of total
esterified fatty acids) under stress conditions6,9,11,12. However, it is not known whether or not arabidopsides play a
direct role or if they are a source of free (dn)OPDA. The latter proposition is supported by the finding that arabi-dopsides can be a substrate for acyl lipases, allowing the release of free OPDA24,25. Released (dn)OPDA could be
used for jasmonic acid synthesis but could also directly modulate gene expression as free OPDA is directly able to activate jasmonic acid-independent responses involved in the inhibition of seed germination26 and drought
stress responses27, for instance. Moreover, in vitro studies have shown that some arabidopsides have antibacterial
and antifungal properties6,9,19 indicating a direct biological effect. Arabidopsides are also able to induce plant
senescence, which highlights a possible direct role of these molecules in plant developmental processes3. To better
understand the functions of those molecules, the main difficulty is to be able to quantify precisely arabidopsides in plant tissues as low concentration modifications may induce crucial physiological changes.
As arabidopsides are not commercially available as pure standards, these compounds need to be first extracted and purified from plants, which makes their study challenging. Moreover, analytical methods did not allow direct analysis of esterified oxylipins until the last two decades. Usually, the fatty acid moieties of complex lipids are first released by hydrolysis before analysis. The main disadvantage of this technique is that the whole esterified oxylipin structure cannot be elucidated, as only the oxylipin part of the molecule is analysed28,29.
Contempo-rary analysis methods for arabidopsides utilize HPLC–MS–MS17,30,31 or direct infusion MS–MS11,12 to quantify
these molecules in plant samples. However, most of those methods use internal calibration with non-oxidized galactolipids6,32 which structurally differ from arabidopsides and might display very different analytical responses.
There is thus a significant need in the development of analytical methods allowing precise quantifications of those molecules with important roles in plant defence and development. In this study, we report the first HPLC—ion trap mass spectrometry (HPLC-IT-MS) validated method for the determination of the five major arabidopsides using external calibration with highly purified arabidopside standards. Plant sample preparation was straightfor-ward, as a simple SPE procedure was applied. An ion trap mass analyser was used for arabidopside quantification, as it allows the quantification of low abundance ions that are trapped and concentrated in the mass spectrometer before detection, allowing the quantification of low molecule levels19,32,33. The established method was successfully
applied to the quantification of arabidopsides in Arabidopsis and Nasturtium officinale R. Brown.
Results and discussion
Arabidopside purification.
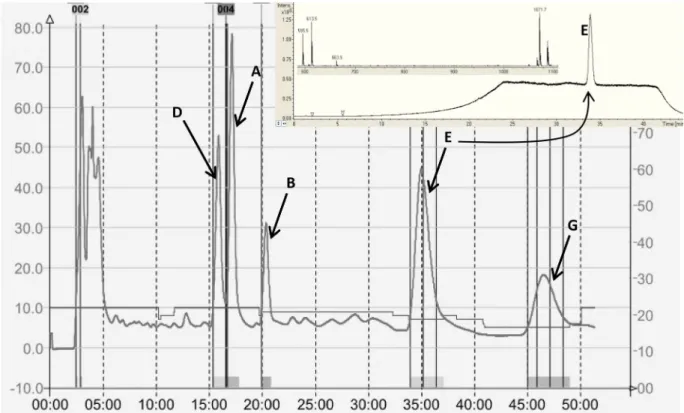
As arabidopsides are as yet not commercially available, the five major arabi-dopsides were extracted and purified from freeze-thawed Arabidopsis leaves. After sample clean-up on a silica column (see the “Experimental” section), preparative-HPLC was carried-out. As shown in Fig. 2, the optimized gradient allowed a performant separation of all five arabidopsides, which were then analysed by HPLC–MS to confirm their identity (Supplemental Fig. 1). The identities were also confirmed by 2D-NMR (HSQC, COSY and HMBC), UV–visible and infrared spectroscopy (see all spectra for arabidopside A in supplementary data, supplemental Figs. 2–6). Arabidopside purities were evaluated from HPLC–MS-total ion chromatograms (Sup-plemental Fig. 1). HPLC–MS results showed that the five arabidopsides were recovered with the following puri-ties: 99.4% for arabidopside A, 95.7% for arabidopside B, 92.4% for arabidopside D, 99.5% for arabidopside E and 90.8% for arabidopside G.Method development.
A method was developed to separate, detect and quantify arabidopsides in com-plex plant samples. A gradient of acetonitrile and water was chosen, giving the best peak resolution for elution of arabidopsides A, B, D, E and G with high specificity as no peaks in complex plant samples were eluted at the same arabidopside retention times. Ammonium formate and formic acid were added to the solvents to enhance electrospray ionization in positive mode. Results also highlighted that each class of arabidopsides needs spe-cifically optimized parameters for its enhanced detection (Fig. 3). Ion trap parameters were then optimized for each different arabidopside species by direct infusion of the different molecules. The optimal parameters are summarized in Supplemental Table 1. The HPLC–IT–MS identification of each molecule was performed based on its retention time, the mass of its chosen adduct and the mass of a selected confirmation ion. The latter ones corresponded to the loss of one (for arabidopsides A and B) or two (for arabidopside D) sugar moieties and ofO HO HO OH OH O O O O O O O O HO HO OH OH O O O O O O O
Arabidopside A
Arabidopside B
O HO HO O OH O O O O O O O O HO HO OH OH O HO HO O OH O O O O O O O O OArabidopside D
Arabidopside E
O HO HO O OH O O O O O O O O OArabidopside G
O HOOCOPDA
O HOOCDn-OPDA
O HOOCJasmonic acid
Figure 1. Structure of the five major arabidopside species (A, B, D, E and G), OPDA, dn-OPDA and jasmonic acid. Adapted from Genva, M. et al. (2019)3 with authorization. Arabidopsides A and B are (dn)OPDA
containing MGDGs, arabidopside D is an OPDA containing DGDG, arabidopsides E and G are head group acylated derivatives of these.
one sugar moiety and one OPDA acyl-chain for arabidopsides E and G. For all arabidopsides, the selected con-firmation ions were the same as those previously described34.
The area of a selected molecular ion adduct was used for each arabidopside quantification. The ratios between the different arabidopside adducts were compared for standard molecules and arabidopsides in extracted plant samples. Those ratios were constants in both standard molecules and complex plant samples, allowing the choice of the major adduct for each arabidopside molecule to increase the method sensitivity. The areas of the arabi-dopside A and B ammonium (M + 18 amu) adduct peaks were used for their quantification. For arabiarabi-dopsides D, E and G, sodium adducts that dominated the mass spectrum (Fig. 4) were chosen for quantification purposes. Additionally, arabidopside G was eluted during a decrease in acetonitrile content where the baseline was not flat. Quantification of this molecule based on its adduct allowed enhanced precision in peak area determination.
Validation of the established method.
External calibration with authentic standards purified from disrupted plants was used for arabidopsides quantification. For arabidopsides A, B and D, linear calibration was observed whereas arabidopsides E and G required a second-degree polynomial calibration curve. Each calibration curve was the mean of three distinct curves and each point consisted of triplicate injections. For all studied arabidopsides, the coefficient of determination (R2) was higher than 0.997, showing that the data fittedwell with the suggested regression models over the calibration range. The LOD was between 0.098 and 0.78 µM, Figure 2. Preparative HPLC chromatogram obtained during arabidopside purification with UV detection at 220 nm. All arabidopsides were then analysed by HPLC–MS. Insert shows HPLC–MS TIC of arabidopside E and spectrum of the main peak. See Supplemental Fig. 1 for HPLC–MS TIC of all arabidopside standards.
Figure 3. Total ion chromatogram (TIC) of arabidopside E detected with ion trap parameters optimized for oxidized acyl-MGDG detection (in black) and oxidized MGDG detection (in grey).
while LOQ was from 0.64 to 1.56 µM for all tested analytes (Table 1). As this method was performed from approximatively 0.4 g of fresh plant material, it allowed the quantification of arabidopsides in plant samples from 25.6–62.4 nmol/g fresh weight.
The specificity of the established method was evaluated by verifying the absence of interfering peaks coming from plant samples. Representative total ion chromatograms and extracted ion chromatograms of plant sample containing arabidopsides are shown in Fig. 5, and they illustrate the good specificity of the established method as no interfering peak was found for all five arabidopsides.
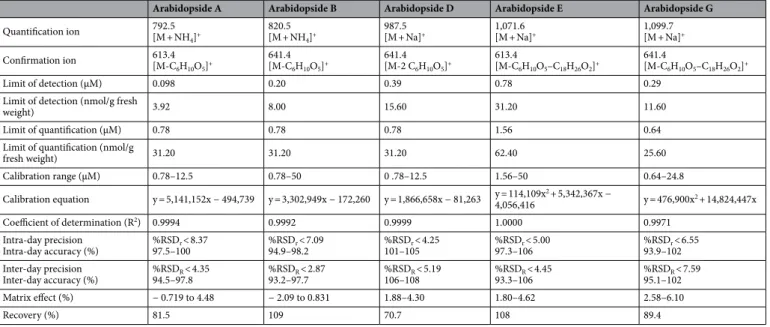
Intra-day (n = 6) and inter-day (n = 3) variations were tested to define the precision and accuracy of the method (Table 2). The established method showed low relative standard deviation (RSD) and high accuracy Table 1. Analytical method validation performance for the quantification of arabidopsides A, B, D, E and G by HPLC-IT-MS.
Arabidopside A Arabidopside B Arabidopside D Arabidopside E Arabidopside G
Quantification ion 792.5[M + NH
4]+
820.5
[M + NH4]+
987.5
[M + Na]+ 1,071.6[M + Na]+ 1,099.7[M + Na]+
Confirmation ion 613.4[M-C 6H10O5]+ 641.4 [M-C6H10O5]+ 641.4 [M-2 C6H10O5]+ 613.4 [M-C6H10O5–C18H26O2]+ 641.4 [M-C6H10O5–C18H26O2]+ Limit of detection (µM) 0.098 0.20 0.39 0.78 0.29
Limit of detection (nmol/g fresh
weight) 3.92 8.00 15.60 31.20 11.60
Limit of quantification (µM) 0.78 0.78 0.78 1.56 0.64
Limit of quantification (nmol/g
fresh weight) 31.20 31.20 31.20 62.40 25.60 Calibration range (µM) 0.78–12.5 0.78–50 0 .78–12.5 1.56–50 0.64–24.8 Calibration equation y = 5,141,152x − 494,739 y = 3,302,949x − 172,260 y = 1,866,658x − 81,263 y = 114,109x4,056,416 2 + 5,342,367x − y = 476,900x2 + 14,824,447x Coefficient of determination (R2) 0.9994 0.9992 0.9999 1.0000 0.9971 Intra-day precision Intra-day accuracy (%) 97.5–100%RSDr < 8.37 %RSD94.9–98.2r < 7.09 101–105%RSDr < 4.25 %RSD97.3–106r < 5.00 %RSD93.9–102r < 6.55 Inter-day precision Inter-day accuracy (%) 94.5–97.8%RSDR < 4.35 %RSD93.2–97.7R < 2.87 106–108%RSDR < 5.19 %RSD93.3–106R < 4.45 %RSD95.1–102R < 7.59 Matrix effect (%) − 0.719 to 4.48 − 2.09 to 0.831 1.88–4.30 1.80–4.62 2.58–6.10 Recovery (%) 81.5 109 70.7 108 89.4
Figure 4. Major adducts and fragments during HPLC–MS analysis of arabidopsides A, B, D, E and G. for arabidopsides A and B, ammonium adducts were the most abundant and were then chosen for their quantification. For arabidopsides D, E and G, the sodium adducts that dominated were used for the
quantification of those species. For all arabidopsides, the major detected fragments corresponded to sugar losses with or without the loss of an additional water molecule.
for all studied analytes with intra-day relative standard deviation percentages (%RSDr) between 4.25 and 8.37%
and inter-day relative standard deviation percentages (%RSDR) between 2.87 and 7.59%. Intra-day and
inter-day accuracy were, respectively 93.9–106% and 93.2–108%, showing the high precision and accuracy of the established method.
Signal suppression or enhancement due to matrix effects were evaluated by performing arabidopside dilutions of purified molecules in acetonitrile:water (30:70) in triplicate and by spiking unstressed Arabidopsis samples with the purified arabidopsides in triplicate at three different concentration levels (10, 5 and 2.5 µM) inside the calibration range for each molecule. As arabidopsides are highly induced under stress conditions and are only present in low amounts under physiological conditions, arabidopsides were only detected in trace amounts in unstressed plant extracts. The matrix effect (%) corresponded to the peak area in the arabidopside dilution subtracted by the peak area in plant sample, which was then divided by the peak area in the arabidopside dilu-tion and multiplied by 100. Results showed almost no matrix effects for the quantificadilu-tion of the five arabidop-side species in plant extracts at the three tested concentrations, showing the good precision of the established method. Calculated matrix effects were respectively between − 0.719% and 4.48% for arabidopside A, − 2.09% and − 0.831% for arabidopside B, 1.88% and 4.30% for arabidopside D, 1.80% and 4.62% for arabidopside E, 2.58% and 6.10% for arabidopside G (Table 3).
Recoveries of the extraction method were also determined by analysing two spiked unstressed Arabidopsis extracts with the five arabidopsides at 2.5 µM. One sample was directly analysed while the other was resubmitted to the extraction and purification process. The manipulation was performed in triplicate. Acceptable recoveries between 81.5 and 109% were determined for all arabidopsides species, except for arabidopside D, which had Figure 5. (a) Representative TIC of A. thaliana sample containing arabidopsides analysed with the method optimized for acyl-MGDG species. (b) Representative extracted ion chromatograms of arabidopsides A, B, D, E and G.
recoveries of 70.7%. Calculated recoveries were 81.5% for arabidopside A, 109% for arabidopside B, 70.7% for arabidopside D, 108% for arabidopside E and 89.4% for arabidopside G.
Method application to plant samples.
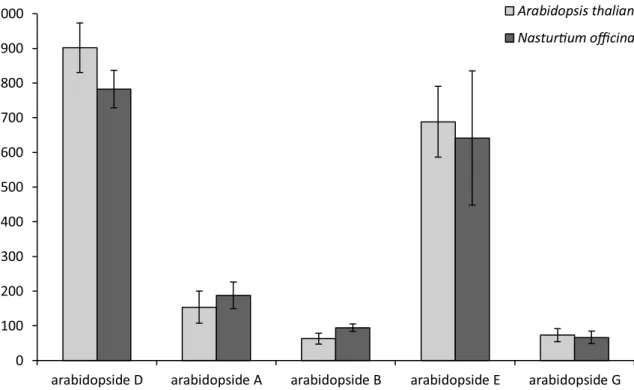
The validated method was finally applied to the quantification of the five major arabidopside molecules in two different plant species: Arabidopsis thaliana and Nasturtiumofficinale. Results (Fig. 6) showed that arabidopsides D and E are the major species produced by Arabidopsis 30 min after freeze-thawing. As arabidopsides A and D have been previously reported in Nasturtium officinale leaves19, the present method was also applied for the quantification of arabidopsides in that species. Surprisingly,
results showed that 30 min after freeze-thawing, arabidopside levels in Nasturtium officinale are similar to those of Arabidopsis thaliana and that all five major arabidopsides species were produced in concentrations ranging from 63.0 to 902 nmol/g FW. This highlights the importance of those plant metabolites in both plant species, and perhaps in other plants in which arabidopside production has not yet been investigated.
Besides from the detection and quantification of the five major arabidopsides, the described method also allowed detecting other polar lipids in Arabidopsis plant extracts. For example, arabidopside C, an oxidized DGDG containing one OPDA and one dnOPDA chain, was also detected with the method as characteristic adduct (959.6, [M + Na]+) and fragment (613.4, [M-2 C
6H10O5]+) were detected for this molecule at a retention
time of 14.4 min. However, as this molecule was not purified due to its low level in freeze-thawed A. thaliana extracts, its quantification was not performed.
conclusion
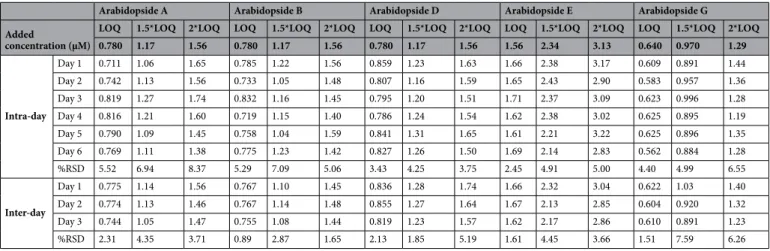
Arabidopsides are plant metabolites that were first described in Arabidopsis but that are now increasingly found in numerous other plant species. Functions of those molecules remain unclear but seem to be crucial for plant defence mechanisms. As low variations in metabolite concentrations can lead to high physiological responses Table 2. The precision of the method. The precision of the developed method was evaluated by spiking blank samples with three concentrations of each arabidopside: LOQ, 1,5*LOQ and 2LOQ. For intra-day precision evaluation, six repetitions of each concentration were prepared and injected the same day. For the determination of inter-day precision of the method, six repetitions of each arabidopside concentration were prepared and injected the same day, and the manipulation was repeated three times within the same week. Arabidopside A Arabidopside B Arabidopside D Arabidopside E Arabidopside G Added
concentration (µM)
LOQ 1.5*LOQ 2*LOQ LOQ 1.5*LOQ 2*LOQ LOQ 1.5*LOQ 2*LOQ LOQ 1.5*LOQ 2*LOQ LOQ 1.5*LOQ 2*LOQ 0.780 1.17 1.56 0.780 1.17 1.56 0.780 1.17 1.56 1.56 2.34 3.13 0.640 0.970 1.29 Intra-day Day 1 0.711 1.06 1.65 0.785 1.22 1.56 0.859 1.23 1.63 1.66 2.38 3.17 0.609 0.891 1.44 Day 2 0.742 1.13 1.56 0.733 1.05 1.48 0.807 1.16 1.59 1.65 2.43 2.90 0.583 0.957 1.36 Day 3 0.819 1.27 1.74 0.832 1.16 1.45 0.795 1.20 1.51 1.71 2.37 3.09 0.623 0.996 1.28 Day 4 0.816 1.21 1.60 0.719 1.15 1.40 0.786 1.24 1.54 1.62 2.38 3.02 0.625 0.895 1.19 Day 5 0.790 1.09 1.45 0.758 1.04 1.59 0.841 1.31 1.65 1.61 2.21 3.22 0.625 0.896 1.35 Day 6 0.769 1.11 1.38 0.775 1.23 1.42 0.827 1.26 1.50 1.69 2.14 2.83 0.562 0.884 1.28 %RSD 5.52 6.94 8.37 5.29 7.09 5.06 3.43 4.25 3.75 2.45 4.91 5.00 4.40 4.99 6.55 Inter-day Day 1 0.775 1.14 1.56 0.767 1.10 1.45 0.836 1.28 1.74 1.66 2.32 3.04 0.622 1.03 1.40 Day 2 0.774 1.13 1.46 0.767 1.14 1.48 0.855 1.27 1.64 1.67 2.13 2.85 0.604 0.920 1.32 Day 3 0.744 1.05 1.47 0.755 1.08 1.44 0.819 1.23 1.57 1.62 2.17 2.86 0.610 0.891 1.23 %RSD 2.31 4.35 3.71 0.89 2.87 1.65 2.13 1.85 5.19 1.61 4.45 3.66 1.51 7.59 6.26
Table 3. Matrix effects of the established method. Matrix effects were evaluated by spiking unstressed plant samples with three different arabidopside concentrations (2.5, 5 and 10 µM). Arabidopside dilutions in acetonitrile:water (30:70) were also realized at the same concentrations. The manipulation was repeated three times with three different unstressed plant samples extracted independently from different Arabidopsis plants. Matrix effect (%) corresponded to (arabidopside peak area in the arabidopside dilution subtracted by peak area in the plant sample) divided by peak area in the arabidopside dilution and multiplied by 100.
Arabidopside A Arabidopside B Arabidopside D Arabidopside E Arabidopside G
Added concentration (µM) 2.5 5 10 2.5 5 10 2.5 5 10 2.5 5 10 2.5 5 10 Matrix effect (%) 1 3.59 1.66 6.71 − 0.299 − 7.82 − 4.57 − 0.541 2.81 5.79 1.99 − 1.54 − 3.12 5.02 − 5.71 8.23 2 2.06 − 5.27 − 1.43 1.95 4.36 − 3.46 4.43 0.910 3.10 3.55 5.11 8.24 8.88 7.00 − 0.0468 3 − 1.57 1.46 8.17 − 4.14 − 2.81 3.87 2.10 1.92 4.01 − 0.134 10.3 5.48 4.40 6.46 2.07 Mean 1.36 − 0.719 4.48 − 0.831 − 2.09 − 1.39 2.00 1.88 4.30 1.80 4.62 3.53 6.10 2.58 3.42 Standard deviation 2.65 3.94 5.17 3.08 6.12 4.59 2.49 0.950 1.37 1.85 5.94 5.92 2.43 7.19 4.30
in plants, precise methods are needed for the monitoring of arabidopside formation under specific conditions and in diverse plant species.
Existing methods for arabidopside analysis usually use HPLC–MS/MS or direct infusion MS/MS, with quan-tification based on an internal calibration with non-oxidized galacto- or phospho-lipids, which largely differ structurally from arabidopsides. As we showed here that even different arabidopside species (oxidized MGDG, oxidized DGDG and oxidized head group acylated MGDG) have distinct analytical responses, there was a high need for new methods allowing precise monitoring of those species in plants. The present HPLC–IT–MS method has been successfully developed and validated for the quantification of five major arabidopsides in plant samples using external calibration with purified authentic arabidopsides. The proposed sample preparation is straightforward, as it requires only extraction, a simple SPE purification procedure and no derivatization before analysis. The high sensitivity, as well as its high accuracy and precision and the low matrix effects, allow the precise quantification of the five arabidopsides in complex plant samples. The present method could be used for the precise monitoring of arabidopside formation under specific conditions, which is key to the understanding of plant defence mechanisms.
experimental
chemicals and reagents.
Ultra-pure deionized water (18 MΩ) was produced using a Q-OPD apparatus. Acetonitrile for LC–MS and glacial acetic acid were purchased from VWR. Methanol, ethyl acetate, isopropanol, chloroform HPLC grade and acetone HPLC grade were obtained from Scharlau. Butan-1-ol, formic acid for LC–MS and ammonium formate for mass spectrometry were purchased from Merck. Heptane was obtained from Biosolve.plant culture.
Arabidopsis thaliana Columbia 0 (col-0) was cultivated from 6 to 8 weeks with thefollow-ing photoperiod: 8 h day and 16 h night; as previously described 9. The established method was applied to the
quantification of arabidopsides in Arabidopsis and Nasturtium officinale R. Brown. The latter was obtained from the local market.
Arabidopsides biosynthesis induction, extraction and large scale purification.
For large scale purification of arabidopsides, approximatively 100 g of fresh leaves of A. thaliana col-0 were frozen in liquid N2for 30 s and left to thaw at room temperature for 30 min as previously described13. Thereafter, the leaves were
homogenized three times for 10 s using a grinder in cold butan-1-ol:methanol (3:1) with 0.05% (w/v) butylated hydroxytoluene as an antioxidant. The homogenate was agitated for 30 min at 4 °C. After transfer to a separating funnel, phase separation was induced by the addition of 200 mL of heptane:ethyl acetate (3:1) and 200 mL of 2% acetic acid in water. The organic phase was recovered and the aqueous phase re-extracted once again with 300 mL heptane:ethyl acetate (3:1). Organic phases were then pooled and evaporated under vacuum in a roto-evaporator (40 °C). The residue was re-suspended in 25 mL chloroform and kept at − 20 °C before purification.
0
100
200
300
400
500
600
700
800
900
1,000
arabidopside D
arabidopside A
arabidopside B
arabidopside E
arabidopside G
th
gie
w
hs
erf
g
/
el
o
mn
Arabidopsis thaliana
Nastur um officinale
Figure 6. Arabidopside quantification in Arabidopsis thaliana and Nasturtium officinale 30 min after freeze-thawing (n = 3). Plant lipids were extracted from approximatively 0.4 g of fresh leaves, purified on a SPE silica column and subsequently analysed by HPLC–IT–MS.
For that purpose, a silica column Si-60 15–25 µm (4.5 cm height; diameter of 2 cm) was prepared. Undesired apolar lipids were eluted using chloroform:acetone (9:1 v/v) and glycolipids were eluted with acetone:methanol (9:1 v/v). The glycolipid fraction was dried under vacuum in a rotoevaporator at 40 °C, re-suspended in metha-nol and kept at − 20 °C. Arabidopsides were then purified using preparative HPLC (Puriflash 430, Interchim) with UV detection at 220 nm on a C18 column (uptisphere C18-2 15 µm, 12.2 × 250 mm) (Fig. 2). A gradient of acetonitrile and water was used at a flow of 20 mL min-1. After 1 min at 45% acetonitrile, the proportion in
acetonitrile was increased to 85% in 17 min and then stabilized for 32 min. Purified arabidopsides were identified by HPLC–MS (Figs. 3 and 4; Supplemental Fig. 1) 2D-NMR (HSQC, COSY, HMBC), UV–visible spectroscopy and infrared spectroscopy (see all spectra for arabidopside A in supplementary data). Arabidopsides were stored at − 20 °C before analysis. Purified arabidopsides were also analysed before and after 2 weeks storage at 25 °C, with no degradation of any of the five molecules.
HPLC–MS analysis.
Sample preparation. Extraction. Lipids were extracted according to Kourtchenkoet al.9. Briefly, approximatively 0.4 g of fresh leaves were submerged for 5 min in boiling isopropanol and then
dried under a gentle stream of nitrogen. Then, 2 mL of CHCl3:methanol:water (1:2:0.8, v:v:v) containing 0.025%
of butylated hydroxytoluene were then added, followed by 30 min of sonication and 30 min at 4 °C. Then, 0.5 mL of CHCl3 and 0.5 mL of K2SO4 380 mM were added to induce phase separation. The organic phase was recovered
and the aqueous phase was re-extracted twice with CHCL3. All chloroformic extracts were pooled and
concen-trated under a gentle stream of nitrogen.
Clean-up. Raw lipids were dissolved in 500 µL chloroform and separated on a silica column (SiOH, 3 mL/500 mg, Chromabond) before HPLC analysis to improve method specificity and to decrease matrix effects. Volumes of eluting solvents were optimized so that the pre-purification method allows the recovery of all five arabidopsides in the second fraction. Neutral and polar lipids were eluted with 2 mL chloroform:acetone (9:1) and 8 mL acetone:methanol (9:1), respectively. The column was finally washed with 3 mL of methanol to be sure that all molecules of interest were eluted in the previous fraction. Lipid fractions were solubilized in 800 µL acetonitrile:water (30:70 v/v) and diluted 20 times before LC–MS analysis.
Chromatographic conditions. Arabidopsides were separated using an HPLC (Agilent 1100) equipped with a
C18 column (Inertsil ODS-3 3 µm, 3 × 100 mm, GL Sciences) at a flow of 0.25 mL min-1 with a gradient of water
(solvent A) and acetonitrile:water (85:15 v/v, solvent B). Solvents contained 0.2% formic acid and 12 mM ammo-nium formate. The gradient started by a 1-min isocratic elution with 53% B and then linearly programmed to 100% B in 17 min and maintained isocratic for 18 min. The gradient was then reversed in 6 min and stabilized for 3 min. A post time of 2 min was used between each injection. The column temperature was fixed at 40 °C.
Mass spectrometric conditions. An Esquire HCT ion trap mass spectrometer (Brüker) was used in
electro-spray + mode. Mass spectrometer conditions were optimized independently for oxidized MGDGs (arabidop-sides A and B), oxidized DGDG (arabidopside D) and oxidized acyl-MGDG (arabidop(arabidop-sides E and G). The capillary voltage was set at − 4500 V, endplate offset at − 500 V, nebulizer pressure at 50 psi and the flow rate of the dry gas at 10 L min-1. Mass spectrometer optimized parameters that differed for the analysis of each
arabi-dopside class are presented in Supplemental Table 1. The mass resolution was calculated for each arabiarabi-dopside as the ration between the mass of the quantification ion and the width of that peak at 50% peak height. Mass resolutions were, respectively, of 1,585 for arabidopside A, 2,051 for arabidopside B, 1,975 for arabidopside D, 2,143 for arabidopside E and 2,199 for arabidopside G. Data treatment was performed using Brüker Daltonics esquire DataAnalysis software.
Method validation.
The method was validated according to European commission recommendation 2002/657/CE. The LOD, LOQ, linearity, precision, accuracy, specificity, matrix effect and recoveries were evalu-ated. For LOD and LOQ, pure standards of arabidopsides were solubilized in acetonitrile:water (30:70) at dif-ferent concentrations. The LOD and LOQ corresponded to the concentration giving signal-to-noise ratios of 3 and 10, respectively. Precision (intra-day repeatability and inter-day repeatability, respectively in % RSDr andRSDR) and accuracy of the established method were evaluated using dilutions of arabidopsides at three
con-centrations (LOQ, 1.5*LOQ and 2*LOQ, n = 6). For inter-day repeatability, analyses were repeated three times within the same week. The specificity of the method was assessed by the ability to discriminate arabidopsides from interfering peaks in extracted plant samples. Matrix effects were evaluated by performing arabidopside dilutions in triplicate and by spiking unstressed Arabidopsis samples in triplicate at three different arabidopside concentrations (10, 5 and 2.5 µM). Three different unstressed Arabidopsis extracts were used as a blank matrix, as arabidopsides are only found in trace amounts in those samples in plant physiological conditions. Matrix effect (%) corresponded to the peak area in the arabidopside dilution subtracted by the peak area in the plant sample, which was then divided by the peak area in the arabidopside dilution and multiplied by 100. Recoveries were also evaluated with unstressed Arabidopsis extracts, which went through the whole method process, spiked at one concentration inside the calibration range (2.5 µM). One sample was directly analysed while the other was resubmitted to the whole process before analysis. For each extract, three replicates were performed. Recoveries (%) corresponded to arabidopside peak areas in the extracted sample divided by arabidopside peak area in the non-extracted sample and multiplied by 100.
Data availability
The datasets generated during and/or analysed during the current study are available from the corresponding author on reasonable request.
Received: 2 April 2020; Accepted: 29 June 2020
References
1. Fauconnier, M.-L., Williams, T. D., Marlier, M. & Welti, R. Potato tuber phospholipids contain colneleic acid in the 2-position. FEBS Lett. 538, 155–158 (2003).
2. Mariutto, M. et al. Reprogramming of fatty acid and oxylipin synthesis in rhizobacteria-induced systemic resistance in tomato. Plant Mol. Biol. 84, 455–467 (2014).
3. Genva, M. et al. New insights into the biosynthesis of esterified oxylipins and their involvement in plant defense and developmental mechanisms. Phytochem. Rev. 18, 343–358 (2019).
4. Deboever, E., Deleu, M., Mongrand, S., Lins, L. & Fauconnier, M.-L. Plant-pathogen interactions: Underestimated roles of phyto-oxylipins. Trends Plant Sci. 25, 22–34 (2020).
5. Wasternack, C. & Strnad, M. Jasmonates: News on occurrence, biosynthesis, metabolism and action of an ancient group of signal-ing compounds. Int. J. Mol. Sci. 19, 2539 (2018).
6. Andersson, M. X. et al. Oxylipin profiling of the hypersensitive response in Arabidopsis thaliana: Formation of a novel oxo-phytodienoic acid-containing galactolipid, arabidopside E. J. Biol. Chem. 281, 31528–31537 (2006).
7. Granér, G., Hamberg, M. & Meijer, J. Screening of oxylipins for control of oilseed rape (Brassica napus) fungal pathogens. Phyto-chemistry 63, 89–95 (2003).
8. Prost, I. et al. Evaluation of the antimicrobial activities of plant oxylipins supports their involvement in defense against pathogens. Plant Physiol. 139, 1902–1913 (2005).
9. Kourtchenko, O. et al. Oxo-phytodienoic acid-containing galactolipids in Arabidopsis: Jasmonate signaling dependence. Plant Physiol. 145, 1658–1669 (2007).
10. Deleu, M. et al. Linoleic and linolenic acid hydroperoxides interact differentially with biomimetic plant membranes in a lipid specific manner. Colloids Surf. B Biointerfaces 175, 384–391 (2019).
11. Vu, H. S. et al. Direct infusion mass spectrometry of oxylipin-containing Arabidopsis membrane lipids reveals varied patterns in different stress responses. Plant Physiol. 158, 324–339 (2012).
12. Buseman, C. M. et al. Wounding stimulates the accumulation of glycerolipids containing oxophytodienoic acid and dinor-oxo-phytodienoic acid in Arabidopsis leaves. Plant Physiol. 142, 28–39 (2006).
13. Nilsson, A. K., Fahlberg, P., Ellerström, M. & Andersson, M. X. Oxo-phytodienoic acid (OPDA) is formed on fatty acids esterified to galactolipids after tissue disruption in Arabidopsis thaliana. FEBS Lett. 586, 2483–2487 (2012).
14. Boudière, L. et al. Glycerolipids in photosynthesis: Composition, synthesis and trafficking. Biochim. Biophys. Acta Bioenerg. 1837, 470–480 (2014).
15. Hisamatsu, Y., Goto, N., Hasegawa, K. & Shigemori, H. Arabidopsides A and B, two new oxylipins from Arabidopsis thaliana. Tetrahedron Lett. 44, 5553–5556 (2003).
16. Hisamatsu, Y., Goto, N., Sekiguchi, M., Hasegawa, K. & Shigemori, H. Oxylipins arabidopsides C and D from Arabidopsis thaliana. J. Nat. Prod. 68, 600–603 (2005).
17. Böttcher, C. & Weiler, E. W. Cyclo-oxylipin-galactolipids in plants: Occurrence and dynamics. Planta 226, 629–637 (2007). 18. Nilsson, A. K. et al. Acylated monogalactosyl diacylglycerol: Prevalence in the plant kingdom and identification of an enzyme
catalyzing galactolipid head group acylation in Arabidopsis thaliana. Plant J. 84, 1152–1166 (2015).
19. Pedras, M. S. C. & To, Q. H. Defense and signalling metabolites of the crucifer Erucastrum canariense: Synchronized abiotic induc-tion of phytoalexins and galacto-oxylipins. Phytochemistry 139, 18–24 (2017).
20. Zábranská, M., Vrkoslav, V., Sobotníková, J. & Cvačka, J. Analysis of plant galactolipids by reversed-phase high-performance liquid chromatography/mass spectrometry with accurate mass measurement. Chem. Phys. Lipids 165, 601–607 (2012).
21. Ohashi, T., Ito, Y., Okada, M. & Sakagami, Y. Isolation and stomatal opening activity of two oxylipins from Ipomoea tricolor. Bioorgan. Med. Chem. Lett. 15, 263–265 (2005).
22. Hartley, S. E., Eschen, R., Horwood, J. M., Gange, A. C. & Hill, E. M. Infection by a foliar endophyte elicits novel arabidopside-based plant defence reactions in its host, Cirsium arvense. New Phytol. 205, 816–827 (2015).
23. Shigemori, H. et al. Arabidopside F, a new oxylipin from Arabidopsis thaliana. Heterocycles 69, 295–302 (2006).
24. Yang, W.-Y. et al. The patatin-containing phospholipase A pPLAIIα modulates oxylipin formation and water loss in Arabidopsis thaliana. Mol. Plant 5, 452–460 (2012).
25. Yang, W. et al. AtPLAI is an acyl hydrolase involved in basal jasmonic acid production and Arabidopsis resistance to Botrytis cinerea. J. Biol. Chem. 282, 18116–18128 (2007).
26. Dave, A. & Graham, I. A. Oxylipin signaling: A distinct role for the jasmonic acid precursor cis-(+)-12-oxo-phytodienoic acid (cis-OPDA). Front. Plant Sci. 3 (2012).
27. Savchenko, T. et al. Functional convergence of oxylipin and abscisic acid pathways controls stomatal closure in response to drought. Plant Physiol. 164, 1151–1160 (2014).
28. Grun, C., Karg, K., Farmer, E. E., Mueller, M. J. & Me, L. Oxylipin analysis methods. Plant J. 45, 472–489 (2006).
29. Fauconnier, M.-L. et al. Changes in oxylipin synthesis after Phytophthora infestans infection of potato leaves do not correlate with resistance. Plant Physiol. Biochem. 46, 823–831 (2008).
30. Stelmach, B. A. et al. A novel class of oxylipins, sn 1-O-(12-oxophytodienoyl)-sn 2-O-(hexadecatrienoyl)-monogalactosyl diglyc-eride, from Arabidopsis thaliana. J. Biol. Chem. 276, 12832–12838 (2001).
31. Glauser, G., Grata, E., Rudaz, S. & Wolfender, J.-L. High-resolution profiling of oxylipin-containing galactolipids in Arabidopsis extracts by ultra-performance liquid chromatography/time-of-flight mass spectrometry. Rapid Commun. Mass Spectrom. 22, 3154–3160 (2008).
32. Ibrahim, A. et al. The alphabet of galactolipids in Arabidopsis thaliana. Front. Plant Sci. 2 (2011).
33. Stanoeva, J. P. & Stefova, M. Evaluation of the ion trap MS performance for quantification of flavonoids and comparison to UV detection. J. Mass Spectrom. 47, 1395–1406 (2012).
34. Nilsson, A. K. et al. Formation of oxidized phosphatidylinositol and 12-oxo-phytodienoic acid containing acylated phosphatidyl-glycerol during the hypersensitive response in Arabidopsis. Phytochemistry 101, 65–75 (2014).
Acknowledgements
The authors are grateful to Prof. em. Georges Lognay (University of Liege, Belgium) for its beneficial analytical advices and for article review. The authors thank Danny Trisman, Thomas Bertrand and Saskia Sergeant for their
efficient technical help and for their interesting advices throughout the work. This work was supported by the Fonds de la Recherche Scientifique from Belgium (FRS-FNRS) (Grant number 2016/V 3/5/141-IB/JN-3049).
Author contributions
M.G. and M.A.: extraction and purification of arabidopsides from plant samples; M.G. and M-L.F.: HPLC-MS method establishment and validation; M.G.: interpretation of the data; M.G. and M-L.F.: conception and design of the study. All authors contributed to the manuscript writing.
competing interests
The authors declare no competing interests.
Additional information
Supplementary information is available for this paper at https ://doi.org/10.1038/s4159 8-020-68757 -x. Correspondence and requests for materials should be addressed to M.G.
Reprints and permissions information is available at www.nature.com/reprints.
Publisher’s note Springer Nature remains neutral with regard to jurisdictional claims in published maps and institutional affiliations.
Open Access This article is licensed under a Creative Commons Attribution 4.0 International License, which permits use, sharing, adaptation, distribution and reproduction in any medium or format, as long as you give appropriate credit to the original author(s) and the source, provide a link to the Creative Commons license, and indicate if changes were made. The images or other third party material in this article are included in the article’s Creative Commons license, unless indicated otherwise in a credit line to the material. If material is not included in the article’s Creative Commons license and your intended use is not permitted by statutory regulation or exceeds the permitted use, you will need to obtain permission directly from the copyright holder. To view a copy of this license, visit http://creat iveco mmons .org/licen ses/by/4.0/.