1997 J Dairy Sci 80:2563–2571 2563 Received December 26, 1996.
Accepted April 9, 1997.
1Reprint requests.
Application of Canonical Transformation with Missing Values
to Multitrait Evaluation of Jersey Type
N. GENGLER,* G. R. WIGGANS,†,1 J. R. WRIGHT,† H. D. NORMAN,† and C. W. WOLFE‡ *Fonds National Belge de la Recherche Scientifique, Unite´ de Zootechnie, Faculte´ Universitaire des Sciences Agronomiques, B-5030 Gembloux, Belgium †Animal Improvement Programs Laboratory, Agricultural Research Service, USDA, Beltsville, MD 20705-2350 ‡American Jersey Cattle Association, Reynoldsburg, OH 43068-2362
ABSTRACT
A multitrait animal model was used to calculate predicted transmitting ability and reliabilities for final score and 15 linear type traits of 225,632 US Jersey cows. Records were adjusted for age and stage of lactation before analysis. The model contained ef-fects for interactions of herd and date scored; year scored, parity, and age; and herd and sire; effects of permanent environment and additive genetics were also included. Of the 381,511 records included, some observations were missing for final score (8%), body depth (43%), and teat length (33%). The evaluation system used a canonical transformation, included several random effects, and estimated missing values with each iteration. Inbreeding was considered in the computations. Convergence was achieved in approxi-mately 50 rounds of iteration. Correlations between animal and sire model predicted transmitting ability ranged from 0.56 to 0.95 and generally were higher for bulls than for cows and for more recent birth years. Genetic trend was strongly positive for dairy form, final score, and rear udder traits (height and width) and negative for udder depth. For other traits, genetic trend was small. This methodology should improve the accuracy of genetic evaluations for type traits of US Jerseys.
( Key words: Jersey, type traits, genetic evaluation, canonical transformation)
Abbreviation key: AJCA = American Jersey Cattle
Association.
INTRODUCTION
The American Jersey Cattle Association ( AJCA) scores 15 linear type traits: stature, strength, dairy form, foot angle, rear legs (side view), body depth,
rump angle, thurl width, fore udder attachment, rear udder height, rear udder width, udder depth, udder cleft, front teat placement, and teat length. A final score is calculated for all scored cattle, but breeders can request that an appraiser also assign final scores for all scored cows. Genetic evaluations for type traits have used single-trait sire models (13). Because the linear scoring system used by AJCA allows for repeated scoring of cattle, a repeatability model has been used. The current evaluation system uses all scores but gives a low weight (0.1) to scores after second lactation because those are optional. The PTA for cows are derived from the sire model using the approach described by Weller et al. (17).
Recent advances in genetic evaluations for type have included multitrait analysis and use of animal models (10). Computational requirements can be greatly reduced with canonical transformation, the most common approach for simultaneous genetic evaluation of more than one trait ( 6 ) . This method transforms the initial, correlated traits to uncor-related, canonical traits. Recent enhancements in this transformation method have been multiple diagonali-zation (generalidiagonali-zation of canonical transformation to several random effects rather than only additive genetic effects) (3, 7, 11) and an expectation-maximization algorithm that permits the use of this approach even if observations for some traits are missing for some cows ( 2 ) . Inbreeding coefficients now can be calculated and used in genetic evaluations for large populations (16, 20). The objective of this study was to use these advanced methods to evaluate US Jersey cows for genetic merit of type traits.
MATERIALS AND METHODS Data
Scores for type traits were provided by AJCA. Linear type scoring began on January 1, 1980, and only data since then were included. Final score
as-TABLE 1. Distribution of type records of US Jersey cows by scoring year and trait. Records with trait
Scoring Total Final Body Teat
year records score depth length
(no.) 1980 7965 7965 0 0 1981 7808 7808 0 0 1982 11,153 11,153 0 0 1983 11,553 11,553 0 0 1984 23,353 23,353 0 0 1985 26,545 26,545 0 0 1986 24,289 24,289 0 0 1987 27,615 27,611 0 13,330 1988 25,624 25,065 33 25,620 1989 30,341 23,624 30,341 30,341 1990 31,945 26,239 31,945 31,945 1991 28,492 24,046 28,492 28,492 1992 31,264 28,167 31,264 31,264 1993 29,416 25,345 29,416 29,416 1994 32,264 28,173 32,264 32,264 1995 31,884 29,639 31,884 31,884 All years 381,511 350,575 215,639 254,556
TABLE 2. Means and standard deviations of type traits of US Jersey cows adjusted for age and lactation stage.
Trait Records X SD (no.) Final score 350,575 78.0 6.8 Stature 381,511 26.1 6.9 Strength 381,511 28.2 6.9 Dairy form 381,511 30.8 7.5 Foot angle 381,511 21.3 6.6
Rear legs (side view) 381,511 28.5 6.8
Body depth 215,639 28.9 6.5
Rump angle 381,511 26.7 6.5
Thurl width 381,511 27.6 6.2
Fore udder attachment 381,511 27.1 7.9
Rear udder height 381,511 30.9 6.5
Rear udder width 381,511 29.9 6.3
Udder depth 381,511 27.9 7.6
Udder cleft 381,511 28.6 6.2
Front teat placement 381,511 22.8 6.8
Teat length 254,556 22.0 6.2
signed by the appraiser was used instead of final score calculated by AJCA. Calculated final score was not included as a trait because it would not add information to a multitrait model that included the linear traits on which the final score was based. At least one score during first lactation (age <39 mo at first calving) was required. Scores after second lacta-tion (age between 29 and 45 mo at second calving) were excluded; 381,511 records for 225,632 cows re-mained. Not all of the 16 traits were assigned for every record. Table 1 shows the distribution of obser-vations across years and traits. Scoring started in 1988 for body depth and in 1987 for teat length. Final score assigned by the appraiser became optional in 1987 and has been missing from about 10 to 15% of records since then. Overall, observations were miss-ing from 8% of records for final score, 43% for body depth, and 33% for teat length. There were 14,812 combinations of herd and date scored.
Type scores were adjusted for age and lactation stage with USDA multiplicative adjustment factors. Table 2 presents the means and standard deviations for the 16 traits after adjustment. Final score is ex-pressed on a scale between 50 and 99; linear type traits are expressed on a scale between 1 and 50. Means for adjusted scores ranged from 22.0 for teat length to 30.9 for rear udder height; standard devia-tions ranged from 6.2 for teat length and thurl width to 7.9 for fore udder attachment.
Pedigrees were extracted from the USDA national database of lactation records. After elimination of animals without a type score and not related to at
least two other animals with type scores, 463,787 animals remained.
Model
A multitrait animal model for missing data was applied:
y = Xh + Hc + Ss + Zp + Z*u + e
where y = vector of type records; h = vector of fixed effects of the interaction of herd and date scored (herd-date effect); c = vector of fixed effects of the
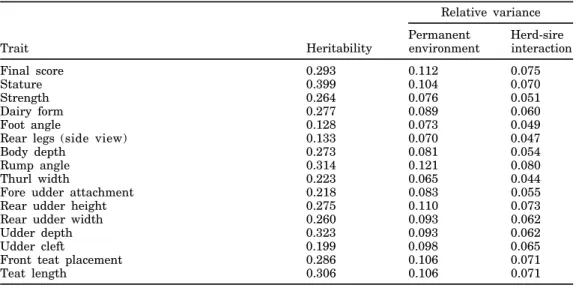
TABLE 3. Estimated heritabilities and assumed variances for permanent environment and interaction of herd and sire relative to total variance for US Jersey type traits.
Relative variance Permanent Herd-sire
Trait Heritability environment interaction
Final score 0.293 0.112 0.075
Stature 0.399 0.104 0.070
Strength 0.264 0.076 0.051
Dairy form 0.277 0.089 0.060
Foot angle 0.128 0.073 0.049
Rear legs (side view) 0.133 0.070 0.047
Body depth 0.273 0.081 0.054
Rump angle 0.314 0.121 0.080
Thurl width 0.223 0.065 0.044
Fore udder attachment 0.218 0.083 0.055
Rear udder height 0.275 0.110 0.073
Rear udder width 0.260 0.093 0.062
Udder depth 0.323 0.093 0.062
Udder cleft 0.199 0.098 0.065
Front teat placement 0.286 0.106 0.071
Teat length 0.306 0.106 0.071
interaction of year scored, parity, and age (year-parity-age effect); s = vector of random effects of interaction of herd and sire (herd-sire effect); p = vector of random effects of permanent environment; u = vector of random additive genetic effects of animals and genetic groups; X, H, S, Z, and Z* = incidence matrices associating h, c, s, p, and u, respectively, with y; and e = vector of random residual effects.
Year-parity-age effect c was included in the model because of concerns in recent years about the ac-curacy of estimates of genetic trend ( 1 ) that are related to problems with age adjustment and changes in maturity rates (19). Records were divided into 24 groups based on year scored (prior to 1983, 1983 through 1987, 1988 through 1992, and after 1992), parity (first or second lactation), and age within parity (<27 mo, 27 to 31 mo, and >31 mo for first lactation; <39 mo, 39 to 43 mo, and >43 mo for second lactation). Age adjustments had been changed on January 1, 1988; therefore, 1988 was chosen as a boundary for grouping of years scored. This approach is similar to the method used for US yield evaluations (19).
Herd-sire effect s was included in the model to limit the effect of a single herd on a bull evaluation. A total of 70,281 groups were created to account for the interaction of herd and sire.
Genetic effects were defined as u = a + Qg, where a = vector of random additive genetic effects of animals expressed as deviations from group means, g = vector of fixed effects of genetic group, and Q = incidence matrix that links g with u. To account for differences in mean genetic merit of unknown ancestors as pro-posed by Westell et al. (18), 18 genetic groups were defined based on birth year (prior to 1961, 1961 to 1962, ..., 1991 to 1992, and after 1992).
(Co)variance Components
(Co)variance components were estimated by Gen-gler et al. ( 5 ) from a subset of the data with recent scores and no missing values by multiple diagonaliza-tion using a similar multitrait model but without a herd-sire effect. Of the estimated (co)variance matrix for permanent environment from their analysis, 40% was assigned to herd-sire interaction and the re-mainder to permanent environmental (co)variance matrix. This approach generated a herd-sire variance that was somewhat less than the 10% of total vari-ance used with the previous sire model ( 1 3 ) and the 9% of total variance used by Holstein Association USA (Brattleboro, VT) with its current animal model for type traits (10). Table 3 shows the heritabilities and relative variances for permanent environment and interaction of herd and sire.
Computation of Solutions and Reliability
Solutions using a multitrait model and data with missing values were obtained with a canonical trans-formation that had been adapted to include several random effects (2, 4). Multiple diagonalization was used to diagonalize the four (co)variance matrices simultaneously. Using this transformation, the 16 correlated traits were transformed to 16 uncorrelated traits. Missing values were estimated during the iter-ation on the data ( 2 ) without backtransformiter-ation. When missing values for a transformed trait were updated, the most recently available solutions for other traits were used. Within a trait, second-order
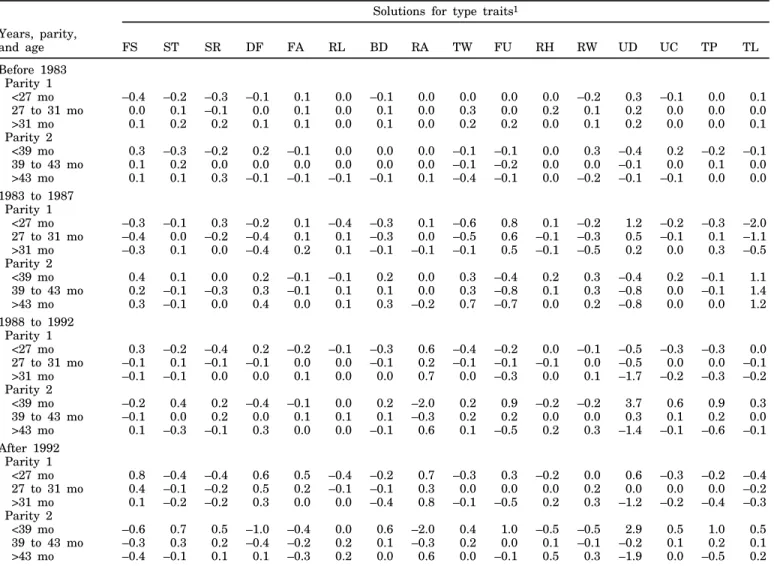
TABLE 4. Solutions for effect of interaction of year scored, parity, and age for US Jersey type traits expressed as deviations from mean solutions for effect of parity and age within time period.
1FS = Final score, ST = stature, SR = strength, DF = dairy form, FA = foot angle, RL = rear legs (side view), BD = body depth, RA =
rump angle, TW = thurl width, FU = fore udder attachment, RH = rear udder height, RW = rear udder width, UD = udder depth, UC = udder cleft, TP = front teat placement, and TL = teat length.
Solutions for type traits1
Years, parity, and age FS ST SR DF FA RL BD RA TW FU RH RW UD UC TP TL Before 1983 Parity 1 <27 mo –0.4 –0.2 –0.3 –0.1 0.1 0.0 –0.1 0.0 0.0 0.0 0.0 –0.2 0.3 –0.1 0.0 0.1 27 to 31 mo 0.0 0.1 –0.1 0.0 0.1 0.0 0.1 0.0 0.3 0.0 0.2 0.1 0.2 0.0 0.0 0.0 >31 mo 0.1 0.2 0.2 0.1 0.1 0.0 0.1 0.0 0.2 0.2 0.0 0.1 0.2 0.0 0.0 0.1 Parity 2 <39 mo 0.3 –0.3 –0.2 0.2 –0.1 0.0 0.0 0.0 –0.1 –0.1 0.0 0.3 –0.4 0.2 –0.2 –0.1 39 to 43 mo 0.1 0.2 0.0 0.0 0.0 0.0 0.0 0.0 –0.1 –0.2 0.0 0.0 –0.1 0.0 0.1 0.0 >43 mo 0.1 0.1 0.3 –0.1 –0.1 –0.1 –0.1 0.1 –0.4 –0.1 0.0 –0.2 –0.1 –0.1 0.0 0.0 1983 to 1987 Parity 1 <27 mo –0.3 –0.1 0.3 –0.2 0.1 –0.4 –0.3 0.1 –0.6 0.8 0.1 –0.2 1.2 –0.2 –0.3 –2.0 27 to 31 mo –0.4 0.0 –0.2 –0.4 0.1 0.1 –0.3 0.0 –0.5 0.6 –0.1 –0.3 0.5 –0.1 0.1 –1.1 >31 mo –0.3 0.1 0.0 –0.4 0.2 0.1 –0.1 –0.1 –0.1 0.5 –0.1 –0.5 0.2 0.0 0.3 –0.5 Parity 2 <39 mo 0.4 0.1 0.0 0.2 –0.1 –0.1 0.2 0.0 0.3 –0.4 0.2 0.3 –0.4 0.2 –0.1 1.1 39 to 43 mo 0.2 –0.1 –0.3 0.3 –0.1 0.1 0.1 0.0 0.3 –0.8 0.1 0.3 –0.8 0.0 –0.1 1.4 >43 mo 0.3 –0.1 0.0 0.4 0.0 0.1 0.3 –0.2 0.7 –0.7 0.0 0.2 –0.8 0.0 0.0 1.2 1988 to 1992 Parity 1 <27 mo 0.3 –0.2 –0.4 0.2 –0.2 –0.1 –0.3 0.6 –0.4 –0.2 0.0 –0.1 –0.5 –0.3 –0.3 0.0 27 to 31 mo –0.1 0.1 –0.1 –0.1 0.0 0.0 –0.1 0.2 –0.1 –0.1 –0.1 0.0 –0.5 0.0 0.0 –0.1 >31 mo –0.1 –0.1 0.0 0.0 0.1 0.0 0.0 0.7 0.0 –0.3 0.0 0.1 –1.7 –0.2 –0.3 –0.2 Parity 2 <39 mo –0.2 0.4 0.2 –0.4 –0.1 0.0 0.2 –2.0 0.2 0.9 –0.2 –0.2 3.7 0.6 0.9 0.3 39 to 43 mo –0.1 0.0 0.2 0.0 0.1 0.1 0.1 –0.3 0.2 0.2 0.0 0.0 0.3 0.1 0.2 0.0 >43 mo 0.1 –0.3 –0.1 0.3 0.0 0.0 –0.1 0.6 0.1 –0.5 0.2 0.3 –1.4 –0.1 –0.6 –0.1 After 1992 Parity 1 <27 mo 0.8 –0.4 –0.4 0.6 0.5 –0.4 –0.2 0.7 –0.3 0.3 –0.2 0.0 0.6 –0.3 –0.2 –0.4 27 to 31 mo 0.4 –0.1 –0.2 0.5 0.2 –0.1 –0.1 0.3 0.0 0.0 0.0 0.2 0.0 0.0 0.0 –0.2 >31 mo 0.1 –0.2 –0.2 0.3 0.0 0.0 –0.4 0.8 –0.1 –0.5 0.2 0.3 –1.2 –0.2 –0.4 –0.3 Parity 2 <39 mo –0.6 0.7 0.5 –1.0 –0.4 0.0 0.6 –2.0 0.4 1.0 –0.5 –0.5 2.9 0.5 1.0 0.5 39 to 43 mo –0.3 0.3 0.2 –0.4 –0.2 0.2 0.1 –0.3 0.2 0.0 0.1 –0.1 –0.2 0.1 0.2 0.1 >43 mo –0.4 –0.1 0.1 0.1 –0.3 0.2 0.0 0.6 0.0 –0.1 0.5 0.3 –1.9 0.0 –0.5 0.2
Jacobi iteration (8, 9 ) was used because it does not require several sorted files as does Gauss-Seidel itera-tion (15). Inbreeding was included in the construc-tion of the inverse of the relaconstruc-tionship matrix using the method for US yield evaluations (20). If known, prior solutions were used to speed convergence. Squared relative change across the 16 transformed traits was the convergence criterion. Solutions on the original scale were obtained by backtransformation. To account for missing values when reliability was computed, single-trait prediction error variances were computed for transformed traits (10, 12) using the reduction of information for missing values in original traits ( 4 ) . Multitrait reliabilities were obtained through backtransformation (10).
Genetic Base
Solutions for additive genetic effects were ex-pressed as PTA (half the estimates of u) relative to the mean PTA for all cows born in 1990. This base was chosen because it was similar to the base used for yield traits in the US and in several other countries.
RESULTS AND DISCUSSION Computational Environment
Computations were done on an IBM RISC System 6000 (Model 560; IBM Corp., Armonk, NY) work-station with 512 MB of memory. One round of
itera-TABLE 5. Means, standard deviations, minimums, and maximums for multitrait animal model PTA1and reliabilities for type traits of 363,145 US Jersey cows born since 1971.
1Genetic base was all cows born in 1990.
PTA Reliability
Trait X SD Minimum Maximum X SD Maximum
Final score –0.93 1.19 –6.4 4.8 0.46 0.15 0.89
Stature 0.00 1.31 –7.1 6.7 0.51 0.17 0.91
Strength 0.06 0.92 –5.5 4.9 0.47 0.15 0.89
Dairy form –1.37 1.49 –7.9 6.3 0.47 0.15 0.89
Foot angle 0.15 0.63 –3.4 3.1 0.38 0.12 0.85
Rear legs (side view) –0.25 0.69 –4.0 3.8 0.36 0.11 0.85
Body depth –0.09 0.92 –6.1 4.7 0.47 0.15 0.89
Rump angle –0.10 1.06 –5.6 5.5 0.46 0.15 0.90
Thurl width –0.15 0.79 –4.7 3.7 0.46 0.15 0.89
Fore udder attachment –0.02 1.01 –6.2 4.7 0.45 0.14 0.88
Rear udder height –0.86 1.07 –6.8 4.9 0.44 0.14 0.89
Rear udder width –0.93 1.07 –5.7 4.4 0.45 0.15 0.89
Udder depth 0.37 1.23 –7.5 7.1 0.49 0.16 0.90
Udder cleft –0.23 0.76 –4.6 4.4 0.41 0.13 0.87
Front teat placement –0.19 1.05 –5.8 5.7 0.44 0.14 0.89
Teat length 0.18 0.93 –5.1 7.2 0.46 0.15 0.89
TABLE 6. Means, standard deviations, minimums, and maximums for multitrait animal model PTA1and reliabilities for type traits of
11,982 US Jersey bulls born since 1971.
1Genetic base was all cows born in 1990.
PTA Reliability
Trait X SD Minimum Maximum X SD Maximum
Final score –1.01 1.11 –5.3 4.2 0.45 0.20 0.99
Stature 0.01 1.22 –4.8 5.3 0.48 0.21 0.99
Strength 0.04 0.83 –4.0 3.4 0.46 0.20 0.99
Dairy form –1.65 1.50 –6.7 5.9 0.46 0.20 0.99
Foot angle 0.21 0.60 –2.5 3.1 0.39 0.18 0.99
Rear legs (side view) –0.31 0.69 –3.2 3.6 0.38 0.18 0.99
Body depth –0.14 0.83 –4.4 3.4 0.46 0.20 0.99
Rump angle –0.32 1.01 –4.5 4.4 0.45 0.20 0.99
Thurl width –0.16 0.71 –3.6 2.8 0.45 0.20 0.99
Fore udder attachment 0.23 1.00 –5.3 5.0 0.44 0.20 0.99
Rear udder height –0.94 0.99 –5.8 3.9 0.44 0.20 0.99
Rear udder width –1.06 1.02 –5.0 4.0 0.45 0.20 0.99
Udder depth 0.68 1.16 –7.0 6.3 0.47 0.20 0.99
Udder cleft –0.30 0.71 –3.2 2.6 0.42 0.19 0.99
Front teat placement –0.06 0.96 –4.0 5.2 0.44 0.20 0.99
Teat length 0.14 0.87 –4.3 6.7 0.45 0.20 0.99
tion (16 × 774,554 estimations) required approxi-mately 23 min. The exact number of rounds that were needed to obtain convergence was not available be-cause solutions from a preliminary analysis were used as starting values. Theoretically, slightly over 50 rounds of iteration would have been needed to obtain a relative squared difference of approximately 10–8.
Use of prior solutions reduced the number of rounds of iteration required by about 15. After diagonaliza-tion, the low relative off-diagonals (ratio of squared off-diagonals to the product of diagonals) of 0.036% for herd-sire and permanent environment and 0.012%
for genetic covariance matrices indicated the success of the multiple diagonalization.
Effects of Year Scored, Parity, and Age
To allow comparison across time periods, solutions for year-parity-age effect (Table 4 ) were expressed as deviations from mean solutions for parity-age within a time period. Solutions for more recent time periods would have been inflated because of confounding with herd-date effect. Range of solutions was >1.0 for final score, stature, dairy form, rump angle, fore udder
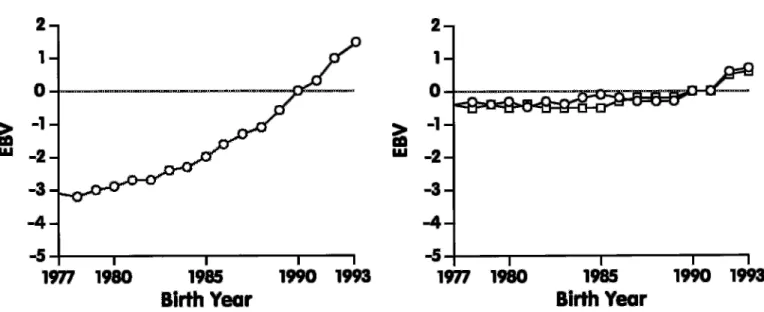
Figure 1. Genetic trend for final score of US Jersey cows born during 1977 through 1993.
Figure 2. Genetic trend for body form traits of US Jersey cows born during 1977 through 1993: stature ( o) , strength ( ◊) , dairy form ( ∫) , and body depth (◊) .
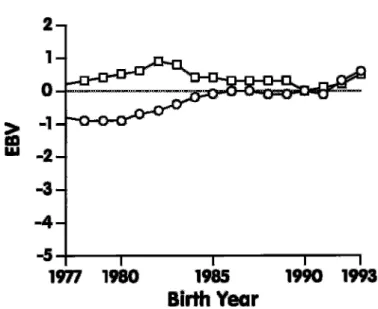
Figure 3. Genetic trend for rump traits of US Jersey cows born during 1977 through 1993: rump angle ( o) and thurl width ( ◊) .
attachment, udder depth, and front teat placement for scores after 1992; for rump angle, fore udder attach-ment, and front teat placement for scores from 1988 through 1992; and for thurl width, udder depth, and teat length for scores from 1983 through 1987. The most extreme ranges were observed for udder depth after 1987 (5.4 for scores from 1988 through 1992 and 4.8 for scores after 1992). These differences reflect lack of fit of current age adjustments. Importance of this effect could be reduced somewhat by changing
the herd-date effect to a herd-date-parity effect. Be-cause an age effect was included in the analysis, the evaluations were not biased by age differences.
PTA
Means, standard deviations, minimums, and maxi-mums for multitrait animal model PTA and their reliabilities are shown in Table 5 for cows and in Table 6 for bulls. For 363,145 cows born since 1971 (Table 5), final score had a mean PTA of –0.93 (standard deviation of 1.19) and a mean reliability of 0.46 (standard deviation of 0.15). For linear type traits of cows, mean PTA ranged from –1.37 for dairy form to 0.37 for udder depth; standard deviations for PTA ranged from 0.63 for foot angle to 1.49 for dairy form. Mean reliabilities for cow PTA ranged from 0.36 for rear legs to 0.51 for stature (standard deviations from 0.11 for rear legs to 0.17 for stature). These results reflected the different heritabilities of the traits. For 11,982 bulls born since 1971 (Table 6), mean PTA and reliability and their standard devia-tions for final score were similar to those for cows. For linear type traits, mean PTA of bulls ranged from –1.65 for dairy form to 0.68 for udder depth; mean reliabilities ranged from 0.38 for rear legs to 0.48 for stature. For bulls, standard deviations for both PTA and reliability were somewhat lower than those for cows. No minimum number of daughters was imposed for bulls.
Correlations between PTA with and without in-breeding considered were high (>0.99). However, when inbreeding was considered, some PTA changed by up to 0.2, which caused some rerankings.
TABLE 7. Correlations between PTA from multitrait animal and sire models for US Jersey type traits by birth year of animal. Birth year
Cows Bulls with >40 progeny
1975 to 1980 to After 1970 to 1975 to 1980 to After 1979 1984 1984 1974 1979 1984 1984 Trait ( n = 30,739) ( n = 70,923) ( n = 147,856) ( n = 181) ( n = 188) ( n = 231) ( n = 192) Final score 0.56 0.76 0.88 0.67 0.82 0.91 0.88 Stature 0.67 0.86 0.92 0.83 0.90 0.93 0.95 Strength 0.62 0.81 0.87 0.79 0.83 0.91 0.91 Dairy form 0.59 0.79 0.90 0.74 0.83 0.93 0.90 Foot angle 0.65 0.82 0.88 0.73 0.81 0.85 0.88
Rear legs (side view) 0.65 0.86 0.89 0.82 0.81 0.88 0.90
Body depth . . . 0.50 0.63 0.82 0.92
Rump angle 0.69 0.83 0.91 0.85 0.91 0.93 0.93
Thurl width 0.56 0.77 0.84 0.76 0.84 0.91 0.90
Fore udder attachment 0.64 0.77 0.83 0.76 0.86 0.91 0.88
Rear udder height 0.61 0.80 0.91 0.74 0.86 0.91 0.91
Rear udder width 0.58 0.78 0.90 0.71 0.84 0.89 0.90
Udder depth 0.61 0.71 0.83 0.79 0.83 0.89 0.86
Udder cleft 0.66 0.84 0.88 0.81 0.87 0.88 0.89
Front teat placement 0.63 0.85 0.91 0.81 0.87 0.92 0.92
Teat length . . . 0.78 0.80 0.77 0.75
Figure 4. Genetic trend for feet and leg traits of US Jersey cows born during 1977 through 1993: foot angle ( o) and rear legs (side view) ( ◊) .
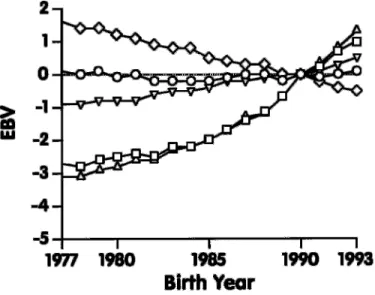
Figure 5. Genetic trend for udder traits of US Jersey cows born during 1977 through 1993: fore udder attachment ( o) , rear udder height ( ◊) , rear udder width ( ∫) , udder depth (◊) , and udder cleft ( ») .
Comparison of Multitrait Animal and Sire Models
Correlations of multitrait animal model and sire model PTA were calculated by birth year (Table 7 ) for US Jersey cows and bulls with >40 progeny. For cows, no correlations were computed for body depth and teat length because sire model PTA were not available for those traits. Correlations increased over time and were higher for bulls with >40 progeny than
for cows born during the same years. Traits with missing values generally had lower correlations than did other traits; correlations for final score decreased slightly for bulls born after 1984, and correlations for body depth and teat length were lower for bulls born before 1980.
Differences between solutions from multitrait
animal and sire models could have been caused by differences in 1 ) data included, 2 ) use of information
Figure 6. Genetic trend for teat traits of US Jersey cows born during 1977 through 1993: front teat placement ( o) and teat length ( ◊) .
TABLE 8. Differences between EBV of cows born in 1992 and 1993 (trend) from linear or quadratic fit of mean EBV by birth year for type traits of 302,219 US Jersey cows born during 1977 through 1993.
1Mean EBV of cows born during 1993 minus mean EBV of cows
born during 1992.
2Nonsignificant ( P = 0.09).
Trait Trend1 Equation R2
Final score 0.55 Quadratic 99.8
Stature 0.18 Quadratic 67.8
Strength 0.10 Quadratic 59.7
Dairy form 0.77 Quadratic 99.7
Foot angle 0.06 Quadratic 75.3
Rear legs (side view) 0.02 Quadratic 96.5
Body depth 0.21 Quadratic 85.7
Rump angle 0.16 Quadratic 74.4
Thurl width 0.17 Quadratic 93.7
Fore udder attachment 0.05 Quadratic 36.1
Rear udder height 0.50 Quadratic 99.1
Rear udder width 0.52 Quadratic 99.6
Udder depth –0.13 Linear 99.3
Udder cleft 0.12 Quadratic 97.3
Front teat placement 0.08 Linear 85.0
Teat length –0.022 Linear 12.9
from relatives, 3 ) effect of one trait on correlated traits, 4 ) genetic parameters, 5 ) use of unknown-parent groups, or 6 ) consideration of inbreeding. For the multitrait animal model, no appraisals before 1980 or after second lactation were included, and a score during first lactation was required. In addition, no calculated final scores were included in animal model evaluations; for cows with missing final scores, PTA were based on pedigree and correlated traits. All relatives affected animal model evaluations; sons and dams contributed to bulls, and progeny contributed to cows. Because animal model PTA resulted from a multitrait analysis, information from one trait af-fected PTA of all correlated traits. Heritabilities were higher, and repeatabilities were lower, for the animal model ( 5 ) than for the sire model. The animal model included unknown-parent groups, which were as-signed by birth year and should enable better estima-tion of genetic trend. The inverse of the relaestima-tionship matrix for the animal model was constructed with inbreeding considered. Even though the overall effect of including inbreeding was low, some animals with high inbreeding coefficients were reranked.
Genetic Trend
Genetic trends were computed from EBV ( 2 ×
PTA) for 302,219 cows born between 1977 and 1993. The EBV rather than PTA was used because EBV is the total estimated genetic merit of an animal, not just the half that is transmitted to a descendant. Earlier birth years were not considered because cow records were not available. Figures 1 through 6 show
the genetic trend for type traits of US Jersey cows. For final score (Figure 1), genetic trend was greatest during the most recent years. For type traits related to body form (Figure 2), genetic trend was observed only for dairy form, but no trend was observed for the other traits (stature, strength, and body depth), ex-cept for a slight increase during 1992 and 1993. Also, no change in genetic merit, except during 1992 and 1993, was apparent for rump traits (Figure 3). For feet and leg traits (Figure 4), EBV for foot angle decreased until 1990 and then began to increase slightly. The EBV for rear legs increased slightly over time; rear legs tended to become more sickled. Genetic trends for udder traits (Figure 5 ) generally were larger than for other traits. Rear udder traits showed an important positive genetic trend, and ud-der cleft showed a moud-derate, positive trend. Udud-der depth EBV decreased steadily, which is an unfavora-ble trend. Because udder depth receives the most weight in the functional type trait index of AJCA, its negative trend probably reflects its negative genetic correlation of –0.59 with milk yield (14). Fore udder attachment showed no genetic trend. For teat traits (Figure 6), a modest trend toward closer teats was found for front teat placement, but no genetic trend was found for teat length.
Quadratic regression equations were fit for mean EBV by birth year. If the quadratic effect was nonsig-nificant ( P < 0.05), a linear equation was used. The difference between the mean EBV of cows born during 1992 and 1993 indicates recent genetic trend (Table 8), and results are similar to the trend shown in
Figures 1 through 6. Genetic trend was greater for dairy form than for final score or rear udder traits. Almost no trend was evident for feet and leg traits and for fore udder attachment; the trend for udder depth was negative. The regression equations ex-plained ≥60% of total variance for all traits except fore udder attachment (36%) and teat length (13%), which were traits that showed no trend.
CONCLUSIONS
For linear type traits, canonical transformation can be used to transform correlated traits to uncorrelated traits to reduce computational requirements. This study showed that the extension of this approach to multiple random effects and missing values and to account for inbreeding in the inverse of the relation-ship matrix can be done at reasonable computer costs. An effect for stage of lactation could be included in the model to replace adjustment of records for stage of lactation but would complicate the model; addition of such an effect is being considered as a future en-hancement to the model.
Comparison of animal and sire model evaluations showed large differences, especially for traits for which scoring was recently introduced. Correlations between animal and sire model PTA were higher for bulls than for cows and generally increased with later birth year. However, for teat length, which has miss-ing values for earlier years, correlations generally decreased with later birth year.
Genetic trends were strongly positive for dairy form, final score, and rear udder traits. For most other traits, genetic trend was small, and a slight positive increase occurred during 1992 and 1993. The most important negative trend was for udder depth, which clearly tended toward deeper udders.
The methodology developed in this study for cal-culating PTA for type traits of dairy cattle should give US Jersey breeders the advanced tools they need to make more accurate genetic selections for final score and linear type traits.
ACKNOWLEDGMENTS
The authors acknowledge the financial support of AJCA and information from T. J. Lawlor, Holstein Association USA, and I. Misztal, University of Georgia. Manuscript review by R. E. Pearson, Vir-ginia Polytechnic Institute and State University; G. W. Rogers, The Pennsylvania State University;
and S. M. Hubbard, Animal Improvement Programs Laboratory, ARS, USDA, is appreciated.
REFERENCES
1 Bonaı¨ti, B., D. Boichard, A. Barbat, and S. Mattalia. 1993. Problems arising with genetic trend estimation in dairy cattle. Proc. Open Session INTERBULL Annu. Mtg., Aarhus, Den-mark, August 19–20, 1993. Int. Bull Eval. Serv. Bull. No. 8, Dep. Anim. Breed. Genet., SLU, Uppsala, Sweden.
2 Ducrocq, V., and B. Besbes. 1993. Solution of multiple trait animal models with missing data on some traits. J. Anim. Breed. Genet. 110:81.
3 Flury, B. N., and G. Constantine. 1985. Algorithm AS211: the F-G diagonalization algorithm. Appl. Stat. 34:177.
4 Gengler, N., and I. Misztal. 1996. Approximation of reliability for multiple-trait animal models with missing data by canonical transformation. J. Dairy Sci. 79:317.
5 Gengler, N., G. R. Wiggans, J. R. Wright, H. D. Norman, and C. W. Wolfe. 1997. Estimation of (co)variance components for Jersey type traits using a repeatability model. J. Dairy Sci. 80: 1801.
6 Jensen, J., and I. L. Mao. 1988. Transformation algorithms in analysis of single trait and of multitrait models with equal design matrices and one random factor by trait: a review. J. Anim. Sci. 66:2750.
7 Lin, C. Y., and S. P. Smith. 1990. Transformation of multitrait to unitrait mixed model analysis of data with multiple random effects. J. Dairy Sci. 73:2494.
8 Misztal, I., and D. Gianola. 1987. Indirect solution of mixed model equations. J. Dairy Sci. 70:716.
9 Misztal, I., D. Gianola, and L. R. Schaeffer. 1987. Extrapolation and convergence criteria with Jacobi and Gauss-Seidel iteration in animal models. J. Dairy Sci. 70:2577.
10 Misztal, I., T. J. Lawlor, and T. H. Short. 1993. Implementation of single- and multiple-trait animal models for genetic evalua-tion of Holstein type traits. J. Dairy Sci. 76:1421.
11 Misztal, I., K. Weigel, and T. J. Lawlor. 1995. Approximation of estimates of (co)variance components with multiple trait res-tricted maximum likelihood by multiple diagonalization for more than one random effect. J. Dairy. Sci. 78:1862. 12 Misztal, I., and G. R. Wiggans. 1988. Approximation of
predic-tion error variance in large-scale animal models. J. Dairy Sci. 71(Suppl. 2):27.
13 Norman, H. D., B. G. Cassell, G. J. King, R. L. Powell, and E. E. Wright. 1979. Sire evaluation for conformation of Jersey cows. J. Dairy Sci. 62:1914.
14 Norman, H. D., R. L. Powell, J. R. Wright, and B. G. Cassell. 1988. Phenotypic and genetic relationship between linear func-tional type traits and milk yield for five breeds. J. Dairy Sci. 71: 1880.
15 Schaeffer, L. R., and B. W. Kennedy. 1986. Computing strate-gies for solving mixed model equations. J. Dairy Sci. 69:575. 16 VanRaden, P. M. 1992. Accounting for inbreeding and cross-breeding in genetic evaluation of large populations. J. Dairy Sci. 75:3136.
17 Weller, J. I., G. R. Wiggans, and T. J. Lawlor, Jr. 1987. Genetic evaluation of dairy goat does for milk and fat as an extension of buck evaluation. J. Dairy Sci. 70:681.
18 Westell, R. A., R. L. Quaas, and L. D. Van Vleck. 1988. Genetic groups in an animal model. J. Dairy Sci. 71:1310.
19 Wiggans, G. R., and P. M. VanRaden. 1994. Effect of including parity-age classes on estimated genetic trend for milk and component yields. J. Dairy Sci. 77(Suppl. 1):267.(Abstr.) 20 Wiggans, G. R., P. M. VanRaden, and J. Zuurbier. 1995.
Calcu-lation and use of inbreeding coefficients for genetic evaluation of United States dairy cattle. J. Dairy Sci. 78:1584.