ASSESSING THE IMPACT OF PUBLIC HOLIDAYS ON TRAVEL TIME EXPENDITURE:
DIFFERENTIATION BY TRIP MOTIVE
Mario Cools, Elke Moons, Geert Wets* Transportation Research Institute
Hasselt University Wetenschapspark 5 bus 6 BE-3590 Diepenbeek Belgium Fax: +32 11 26 91 99 Tel.: +32 11 26 91 {31, 26, 58}
Email: {mario.cools, elke.moons, geert.wets}@uhasselt.be
* Corresponding author
Number of words = 5479 Number of Tables = 6
Words counted: 5479 + 6*250 = 6979 words Revised paper submitted: March 2, 2010
ABSTRACT
The impact of public holidays on the underlying reasons of travel behavior, namely the activities people perform and the trips made, is seldom investigated. Therefore, in this paper the impact of public holidays on travel time expenditure in Flanders, differentiated by trip motive, is examined. The data used for the analysis stem from a household travel survey that was carried out in 2000. The main modeling approach that is employed is the zero-inflated Poisson regression approach, which explicitly takes into account the inherent contrast between travelers and non-travelers. The zero-inflated Poisson regression models yield findings that are harmonious with international literature: socio-demographic variables, temporal effects and transportation preferences contribute significantly in unraveling the variability of travel behavior. In particular it is shown that public holidays have a non-ignorable impact on daily travel behavior. Triangulation of both quantitative and qualitative techniques seems a solid roadway for further illumination of the underpinnings of travel behavior.
KEYWORDS: public holidays, travel time expenditure, trip motive, zero-inflated Poisson
1 INTRODUCTION
1.1 Relevance of Investigating Holiday Effects on Travel Time Expenditure
The importance of a thorough examination of the effect of public holidays on travel time expenditure is underlined by Liu and Sharma (1) and Cools et al. (2,3) stressing the need to incorporate holiday effects in travel behavior models. First, public holidays can influence both the demand for activities (e.g. during regular days the demand for work activities is much larger than during periods were most people plan their holiday) and the supply of activity opportunities in space and time (e.g. opening hours of amusement parks are often prolonged during holiday periods). Second, holidays can affect the supply of available transport options (e.g. during summer holidays, extra trains/plains are scheduled to transfer people to popular holiday destinations). Finally, they can influence the supply of infrastructure and their associated management systems (e.g. during the summer holiday period, the police often enforces driving in groups in order to limit traffic congestion).
State-of-the art literature concerning holiday effects mainly focused on two items, namely on the effects of holidays on traffic counts (e.g. 4,5) and on traffic safety (e.g. 6,7). The impact on the underlying reasons of travel behavior, namely the activities people perform and the trips made, is seldom investigated. Therefore, this study discusses the effect of public holidays on the trips made, and in particular the focus is devoted to the attribute travel time.
1.2 Importance of Examining Travel Time Expenditure Differentiated by Trip Motive
When travel time expenditure is investigated, it is necessary to acknowledge the importance of differentiating travel time expenditure by trip motive. First, commuting (which is defined as work and school related trips), although being the main reason for performing trips, only accounts for 26.8% of all trips (8). Thus, solely focusing on commuting trips would neglect almost three quarters of all trips reported. By analogy with this argument also the concentration of the analysis solely on shopping (defined as both daily and non-daily shopping; 20.5% of all trips) or leisure trips (14.2% of all trips) is to be avoided.
In addition, the differentiation by trip motive can trigger a refinement of the underlying relationships between travel behavior and explanatory factors. By dividing the travel time expenditure into trip motive dependant subparts, more complex relationships can be implicitly modeled: differentiation makes it feasible to incorporate explanatory factors that have an increasing/decreasing effect on a particular subpart, and have an opposite effect, a substitution effect or no effect at all on other subparts.
2 OVERVIEW OF THE DATA
2.1 Sample Correspondence to the Population
The data that are used for the analysis stem from a household travel survey in Flanders that was carried out in 2000 (8). The focus of this survey was to investigate the travel behavior of the people living in the Flanders area. Using stratified clustered sampling, 3,028 households were queried about their travel behavior. All household members older than 6 (in total 7,625 persons)
had to report the trips they made during a particular day, yielding information on about 21,031 trips.
In order to guarantee an optimal correspondence between the survey sample composition and the population the observations in the sample are weighted. The weights were calculated by matching the marginal distributions of the sample with the marginal distributions of the population. Age, gender and civil state were the basis for this matching process.
2.2 Dependent Variables: Travel Time Expenditure by Purpose
The daily travel time expenditure for each trip motive is calculated by adding up the time spent on the trips related with the specific motive. Both the trips to the activity locations and the trips back home were considered.
2.3 Explanatory Variables
2.3.1 Temporal Effects
The first category of explanatory variables that is used in the analysis are temporal effects. The first temporal effect that is considered is the day-of-week effect. Agarwal (9) showed that there exists a significant difference between travel behavior on a weekday and travel behavior on a weekend day. This difference is even further unraveled by Sall and Bhat (10) and Schwanen (11) demonstrating a significant day-of-week effect. In the analysis the day-of-week effect is represented by a categorical variable with seven categories; the first category corresponding to a Monday, the last to a Sunday.
The focus in this study lies on the second temporal effect, namely the holiday effect. To evaluate the significance of public holidays on daily commuting time a special holiday variable is created, consisting of three categories: “normal days”, “holidays” and “summer holidays”. The following holidays are taken into account: Christmas vacation, spring half-term, Easter vacation, Labor Day, Ascension Day, Whit Sunday, Whit Monday, vacation of the construction industry (three weeks, starting the second Monday of July), Our Blessed Lady Ascension, fall break (including All Saints’ Day and All Souls’ Day), and finally Remembrance Day. Note that for all these holidays, the adjacent weekends, were considered to be a holiday too. For holidays
occurring on a Tuesday or on a Thursday, respectively the Monday and weekend before, and the Friday and weekend after, were also defined as a holiday, because often people have a day-off on those days, and thus have a leave of several days, which might be used to go on a long weekend or on a short holiday (2). The days in July and August that were not in the above holiday list were labeled as “summer holidays”.
2.3.2 Socio-Demographics
Next to the temporal effects, also socio-demographic variables are considered for the analysis, as they are commonly used in models that predict travel time (12-14). The following variables are considered for the analyses presented in this paper: age, gender, employment status, living conditions and degree of urbanization.
2.3.3 Transportation Preferences
The final group of variables that is used for the analysis is the frequency of using different transport modes. The following transport modes were considered: the use of the scheduled service bus and tramway service, categorized in people who never, occasionally (a few times a year or month) and frequently (weekly or more often) use this service, the use of the railroad system (same categorization), the daily use of a bicycle (dummy variable which equals one if the respondent uses the bicycle daily) and the daily use of a motorcycle (cf. daily bicycle use). Reports concerning the Flemish travel survey (8) revealed that more than half of the respondents never use busses or trams. The use of trains seemed to be slightly more popular. In addition to the different transportation uses also the possession of a driving license is considered for the analysis. For an interpretation of the impact of transportation preferences the reader is referred to Section 5.
3 DESCRIPTIVE ANALYSIS
Before elaborating on the modeling methodology in Section 4, in this section some descriptive statistics are provided to gain a first insight into the data. First, information about the distributions of the different dependent variables (travel time expenditures by purpose) is displayed. Afterwards, the mean travel time expenditure by purpose is tabulated for the different categories of the explanatory variables.
3.1 Dependent Variables: Travel Time Expenditure by Purpose
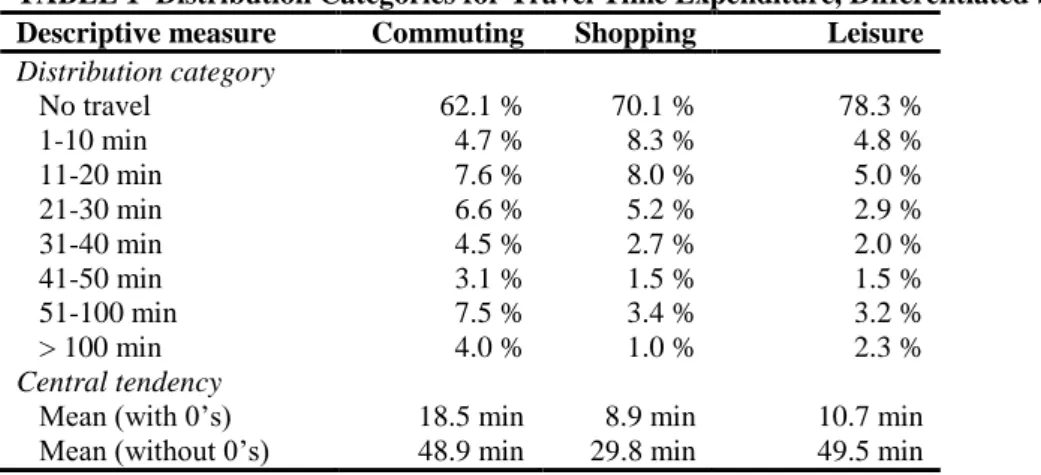
The distribution categories for the travel time expenditure, differentiated by trip motive are displayed in Table 1. From this table one can observe that commuting is the most performed travel activity (it has the smallest percentage of no travel), followed by shopping and leisure trips. In addition to the overall means, also the means excluding zeros are tabulated. Marked are the large discrepancies between these two measures of central tendency, suggesting the need for a modeling approach that explicitly takes into account the excess of zeros.
< Insert Table 1 about here >
3.2 Explanatory Variables
3.2.1 Temporal Effects
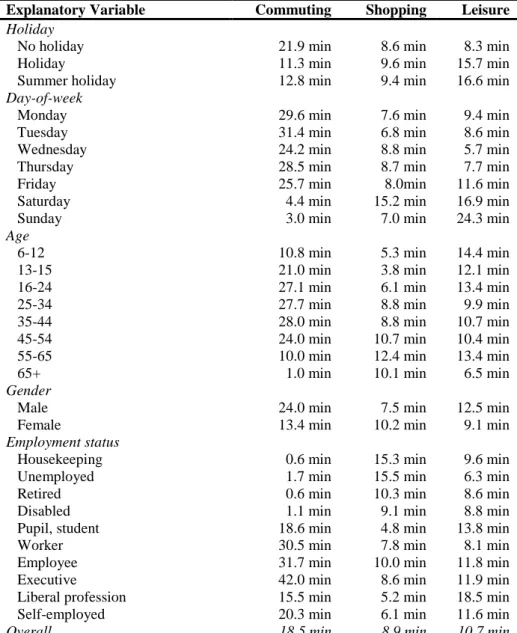
The mean travel time expenditures according to trip motive are displayed for the different categories of the temporal effects in Table 2. From this table one can descry that the time spent on commuting is considerably lower during holidays when compared to regular days, while travel time expenditure on leisure trips is portentously higher during holiday periods. Concerning shopping trips, less pronounced differences can be observed. Besides, one can note the large discrepancy between weekdays and weekend days for commuting travel times, and to a lesser extent for leisure travel times. Shopping related travel times appear to peak on Saturdays.
3.2.2 Socio-Demographics
An exploratory analysis of the most dominant socio-demographical variables, shown in Table 2, reveals that the daily time spent on commuting first increases with age, reaches its maximum at age category 35-44 and declines after people reach their retirement age. The daily commuting time seems to be higher for males than for females and obviously the professionally active population spends more time on commuting compared to the inactive population. Table 2 provides also preliminary insight into the travel time spent on shopping trips; the travel time increases with age and females spend more travel time on shopping trips than males. When employment status is considered, one could notice that the inactive population spends more travel time on shopping then the active one. The overall picture for travel time spent on leisure trips is less striking. Though, one could notice that travel time spent on leisure trips is higher for males than for females, and is remarkably lower for the oldest age category (65+).
4 METHODOLOGY
4.1 Zero-Inflated Poisson Regression
The main modeling approach that is used for the analysis is the zero-inflated Poisson (ZIP) regression approach. This modeling framework uses a zero-inflated Poisson distribution to deal with the excess of zeros. The approach assumes that the population consists of two types of individuals. The first type gives a Poisson-distributed count, which may be zero, whereas the second type always gives a zero count. This assumption can be supported by the inherent contrast between travelers and non-travelers, which could explain the discrepancies between the means incorporating and disregarding zeros, as identified in Section 3.1. The choice for the ZIP regression approach implies that the three types of travel time expenditures will be treated as count variables. The comparison of a linear regression and Poisson regression model for predicting commuting times revealed that the Poison regression model explained more of the variability in travel time expenditure on commuting (15). Therefore, the accommodation of a Poisson model that takes into account the inherent contrast between travelers and non-travelers certainly is a defensible approach. Although travel time expenditures are traditionally analyzed using Tobit models and hazard-based duration models (16), in this paper the suitability of the ZIP regression as an alternative modeling framework is illustrated.
The zero-inflated Poisson distribution has two parameters; the mean of the Poisson distribution i and the proportion of the individuals that are of the second type (the
non-travelers), i. Formally, the zero-inflated Poisson distribution can be represented in the
following way (17): 1 for 0 Pr 1 for 0 ! i i i i k i i i e k Y k e k k ,
where both the probability i and the mean number i depend on covariates. For the covariate
matrices B and G of the models discussed in this paper, the parameters and satisfy the following equations:
log
logit log 1
λ Bβ
ω ω ω Gγ.
Estimates for the unknown parameters are obtained by maximizing the log likelihood using a ridge-stabilized Newton-Raphson algorithm (18). The log-likelihood function for the zero-inflated Poisson distribution is given by:
1
log 1 0
,
log 1 log log ! 0
i n i i i i i i i i i i w e k l with l w k k k ,
where n is the number of observations and where wi are the weights calculated by matching the
marginal distributions of the sample with the marginal distributions of the population. Note that in contrast to the ordinary Poisson regression model, no scale parameter can be included in the ZIP regression model to accommodate for over-dispersion (18).
4.2 Model Performance Assessment
To assess the appropriateness of the zero-inflated Poisson distribution, the Van den Broek score test for testing zero inflation relative to a Poisson distribution (19) will be performed. The statistic is based on a comparison of the actual zeros to those predicted by the model:
2 0 1 0 0 1 0 0 1 n i i i i n i i i I y p p S p ny p ,
where S is the score, I(yi = 0) is an indicator function that is one if a given observation equals
zero, and zero otherwise; p0i the probability of a zero for observation i under the null distribution
(regular Poisson distribution), y the mean of the observations and n the number of observations. Note that the probability is allowed to vary by observation. The S score is assumed to follow a chi-squared distribution with one degree of freedom.
Next to computing the score test, also two model selection criteria, that balance model fit against model parsimony, will be tabulated. The first measure is the corrected Akaike information criterion (AICC), given by:
2 2
1
n
AICC LL p
n p ,
where p is the number of parameters estimated in the model, n the number of observations and LL the log likelihood evaluated at the value of the estimated parameters (SAS Institute Inc. 2004). A second, yet similar measure is the Bayesian information criterion (BIC) defined by:
2 log
BIC LL p n .
The AICC and BIC are useful criteria in selecting among different models, with smaller values representing better models. For an extensive discussing about the use of AICC and BIC with generalized linear models the reader is referred to Simonoff (20).
5 RESULTS 5.1 Overall Results
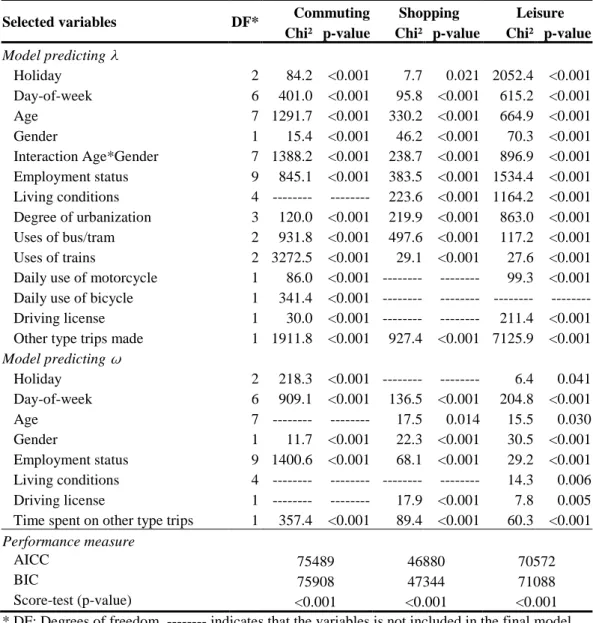
The variables that were used in the final zero-inflated Poisson regression models, together with their likelihood ratio (LR) statistics are displayed in Table 3. From this table, it can be seen that all three categories of variables (socio-demographic variables, temporal effects and transportation preferences) are contributing significantly in the unraveling of daily travel time. The final models also take into account interdependencies between trips, as the travel time spent on a certain type of trip, significantly influences the likelihood of performing other trips, as well as the travel time of these other trips, especially in the case of commuting trips.
< Insert Table 3 about here >
Concerning the covariates in the Poisson regression part of the model, one could note that the holiday effect, the day-of-week effect, age, gender, employment status, degree of urbanization, the use of buses and trams, the use of the trains, and the indicator of making other type trips play a significant role in all three models. With respect to the explanatory variables in the zero-inflation part of the model, one could observe that the day-of-week effect, gender, employment status, and the time spent on other type trips are the covariates that are significant in all three models. The degree of urbanization did not contribute significantly to any of the zero-inflation parts. Except for the covariate driving license, all other explanatory variables representing transportation preferences were left out of the zero-inflation part in order to prevent convergence problems in the estimation procedure.
For the three different types of trips considered, each time the best model was chosen using the AICC and BIC criteria. The corresponding values for these criteria are displayed in the lower part of Table 3. The necessity of using a zero-inflated Poisson model rather than a regular Poisson model is formally tested using the Van den Broek score test. For all three models the corresponding p-value is smaller than 0.001 indicating that a zero-inflated Poisson distribution seriously outperforms a regular Poisson distribution for these models.
5.2 Commuting Time
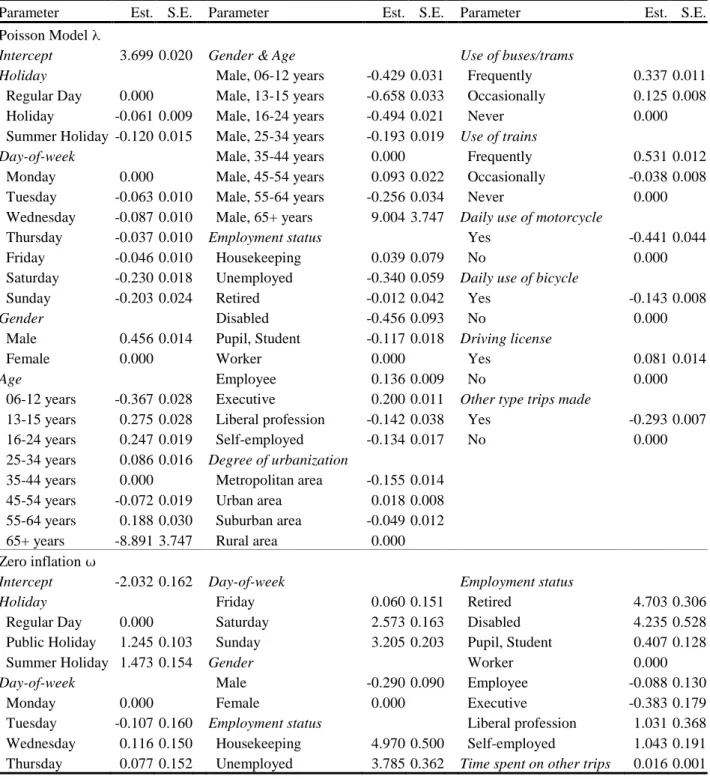
The parameter estimates of the zero-inflated Poisson regression model for predicting the travel time expenditure on commuting are shown in Table 4. A distinction has to be made between the parameters in the model predicting the mean response and the parameters for estimating the probability of the zero-inflation . The parameters of the Poisson part of the zero-inflated Poisson model () should be interpreted as multiplicative effects. Take as an example the parameter estimates for daily users of a motorcycle. The multiplicative effect of being a daily motorcycle user instead of a non-(daily) motorcycle user can then be calculated in the following way: exp(-0.441 – 0) = exp(-0.441) = 0.643. This means that the commuting time of daily motorcycle users is only 64.3% of the commuting of non-(daily) motorcycle users, given that they share the same characteristics for all the other variables. The parameters of the logistic part of the zero-inflated Poisson model () could be seen as log odds ratio multiplicative effects. Take as an example the parameter of the time spent on other type trips: an increase of one minute travel time spent on other type trips has as a consequence that the odds of
non-commuting (a zero for travel time expenditure on non-commuting trips) equals exp(0.016) = 1.02 times the odds of commuting.
When certain covariates are used for modeling both the mean response and the probability of zero-inflation , the assessment of the overall effect is not straightforward. When both parameters support the same conclusion, the multiplicative effect of the Poisson parameter is elevated by the zero-inflation parameter. Take as an example the comparison between regular days and days within the summer holiday period: the parameters of the Poisson parameter indicate that the average commuting time on a regular day is 1.13 (=exp(0+0.120) times the commuting time during a day within the summer holiday period, and this effect is enlarged by the zero-inflation part indication that the odds of commuting are 4.33 for regular days compared to summer holidays. On the other hand, when both parameters support opposite effects, the assessment of the overall effect remains inclusive. Consider for instance the difference between Saturdays and Sundays: while the Poisson parameters indicate that the commuting time on Sundays is 1.03 (=exp(-0.203+0.230) times the commuting time on Saturdays, the zero-inflation parameters, on the other hand, indicate that the odds of commuting on a Saturday versus a Sunday are 1.87 (=exp(3.205-2.573)).
Examination of the temporal effects provides the insight that the traditional organization of the modern society in 5-day workweeks predominates the travel time expenditure on commuting: the likelihood of commuting and the average time spent on commuting are considerably larger during weekdays than during weekend days. This finding is consistent with the results reported by Bhat and Misra (21) and Sall and Bhat (10), who indicated the importance of incorporating day-of-week effects to account for variability in travel times. Furthermore, the travel time expenditure is significantly lower during holidays and summer holidays.
< Insert Table 4 about here >
Investigation of the socio-demographic effects points out that males have a higher propensity to commute than females. Note that to calculate the overall effect of age and gender, the main effects of age and gender, as well as the interaction effects have to be added up. Furthermore, males (25+) commute longer than their female counterparts. This can be explained by persistence of the traditional role patterns: taking care of children still is most frequently done by females, and correspondingly females gear home and work locations better to one another. When the employment status is considered, it can be seen that the occupationally active population quite logically has a higher likelihood to commute and spends more time on commuting than occupationally inactive people. Interesting is the fact that the higher the position people hold within a company, the more daily time they spend on commuting and the higher the probability of commuting. Consequently, executives spend the most time on commuting.
Final conclusions that can be drawn from exploring the parameter estimates are the fact that frequent users of public transport (bus, train) commute up to 1.7 times longer than people who seldom or never use public transport. Daily users of a motorcycle spent on average 35.7% less time on commuting than non-(daily) users. Also noteworthy is the significant interdependency of travel time expenditure on the remainder of the travel time budget: people making other kinds of trips commute on average 25.4% less than people who only make commuting trips, and moreover the chance of commuting decreases when other type of trips are made. This is a consequence of the substitution effect caused by the travel time frontier, the intrinsic maximum amount of time that people are willing to allocate to travel (22,23).
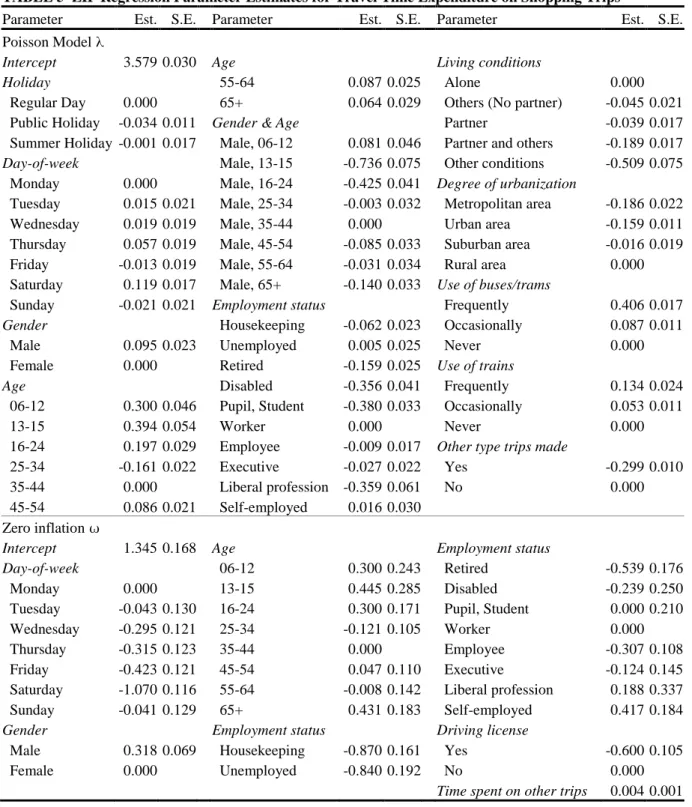
5.3 Time Spent on Shopping Trips
The parameter estimates of the zero-inflated Poisson regression model for predicting the travel time expenditure on shopping trips are displayed in Table 5. Recall the distinction between the parameters in the model predicting the mean response and the parameters for estimating the probability of the zero-inflation . For the analysis there was no distinction made between daily and non-daily shopping, as only one-day trip diary data were available. The analysis of the temporal effects yields the conclusion that in general the time spent on shopping trips is lower during holidays than during regular days. Saturday appears to be the most preferred day for performing shopping trips: both the likelihood for performing shopping trips and the travel time expenditure exceed those of other days. This can be accounted for by the fact that on Saturdays there are fewer work-related obligations, and more available time to perform non-work related activities. The importance of incorporating temporal effects to account for differences in travel
time variability is also acknowledged by Srinivasan and Guo (24) and Habib and Miller (25). Exploration of the socio-demographic effects reveals that females have a much larger
propensity to perform shopping trips than males (odds ratio equals 1.37), which can be explained by the fact that household related activities are primarily performed by females (26). The assessment of the effect of age is not that straightforward. Notwithstanding, adults in the age category 25-64 have the largest probability of performing shopping trips. When the effect of the employment status is evaluated, it can be seen that the finding of Gould and Golob (12), indicating that the occupationally active population spends less travel time on shopping than occupationally inactive people, is more variegated in this study: on the one hand occupationally active people have a decreased likelihood of performing shopping trips, on the other hand - when they do make the trip - they spent more time than occupationally inactive people. Although the overall effect remains inconclusive, an important finding is that people performing a liberal profession have a lower verisimilitude to perform shopping trips (irrespective of self-employed people) and a clearly lower travel time (28% less than executives) than other occupationally active people.
< Insert Table 5 about here >
Other conclusions that can be formulated are the fact that people living in non-traditional living conditions spend considerable less time on shopping trips. This can be explicated by the fact that shopping trips for people living in ‘other’ living conditions such as rest homes and institutions are performed by personnel of these organizations instead of by the individuals themselves. Next, one can infer that the degree of urbanization has a decreasing impact on travel time expenditure on shopping trips. A possible reason is the increased number of shopping locations in a more urban context. Furthermore, one could ascertain the interdependence of shopping trips and other kind of trips. This is again a consequence of the travel time frontier. Note that the interdependency of shopping trips and work trips was also incorporated by Lee and Timmermans (27).
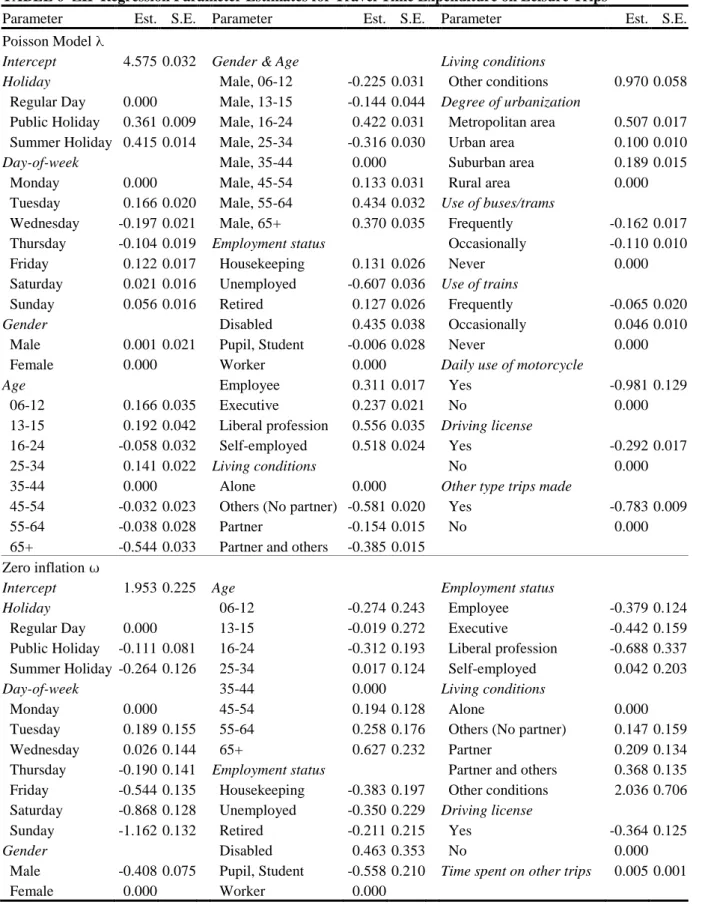
5.4 Time Spent on Leisure Trips
The parameter estimates of the zero-inflated Poisson regression model for predicting the travel time expenditure on leisure trips are shown in Table 6. Examination of the temporal effects
indicates that both the travel time expenditure on leisure trips and the odds of making these trips are higher during holiday periods and weekends. This can again be explained by the traditional organization of the modern society: during weekends and holidays more time is available to perform leisure activities.
Investigation of the socio-demographic effects reveals that males have a higher propensity to perform leisure trips and in general spend more time on leisure trips than females, which was also demonstrated by Schlich et al. (26). People in the age category 65+ have the smallest likelihood to execute leisure trips and also spend the least time on leisure trips. This can be partially accounted for by the fact that people aged 65+ are more likely to have physical disabilities limiting the opportunity to perform leisure activities. People living together with other people have a clearly lower probability and lower travel time expenditure on leisure than people living alone. Coupling constraints clearly seem to play an important role here. Besides, the importance of incorporating land use and density variables, denoted by Bhat and Gossen (28), is also evidenced in this study: in metropolitan and urban areas significantly more time is spent on leisure trips when compared to rural areas. Finally, the interdependency of travel time expenditures on differently motivated trips can also be observed for leisure trips.
< Insert Table 6 about here >
6 CONCLUSIONS AND FURTHER RESEARCH
In this paper it is shown that socio-demographics, temporal effects and transportation preferences are contributing significantly in the unraveling of variability in daily travel time expenditure. In particular it was shown that public holidays have a non-ignorable impact on daily travel behavior. The zero-inflated Poisson regression models, which were used to accommodate the Poisson models to the portentous excess of zeros caused by non-travelers, yielded findings that were harmonious with international literature.
It is essential that the findings reported in this paper are acknowledged and translated into transportation models. An explicit incorporation of the effect of public holidays in travel demand models will most likely result in more precise travel demand forecasts, and consequently policy makers can develop and fine-tune their policy measures on more precise assumptions.
From a methodological point of view, further research should assess the need for accommodating over-dispersion in zero-inflated models. A possible framework tackling both over-dispersion and the excess of zeros is the zero-inflated negative binomial approach. A comparison of zero-inflated Poisson regression models with zero-inflated negative binomial regression models would provide a thorough assessment. In addition, it would be worthwhile to compare the suggested modeling approach with the classical techniques such as Tobit models and hazard-based duration models. Inclusion of social interaction variables and spatial variables in the analyses could further intensify the understanding of differences in travel time expenditure. Moreover, the use of multi-day data can improve the analysis even further by for instance differentiating random and routine behavior (29). Triangulation of both quantitative (e.g. statistical analysis) and qualitative techniques (e.g. mental models) seems a solid roadway for further illumination of the underpinnings of travel behavior.
7 REFERENCES
(1) Liu, Z., and S. Sharma. Statistical Investigations of Statutory Holiday Effects on Traffic Volumes. In Transportation Research Record: Journal of the Transportation Research Board, No. 1945, Transportation Research Board of the National Academies, Washington, D.C., 2006, pp. 40-48.
(2) Cools, M., E. Moons, and G. Wets. Investigating Effect of Holidays on Daily Traffic Counts: Time Series Approach. In Transportation Research Record: Journal of the Transportation Research Board, No. 2019, Transportation Research Board of the National Academies, Washington, D.C., 2007, pp. 22-31.
(3) Cools, M., E. Moons and G. Wets. Investigating the Variability in Daily Traffic Counts Through Use of ARIMAX and SARIMAX Models: Assessing the Effect of Holidays on Two Site Locations. In Transportation Research Record: Journal of the Transportation Research Board, No. 2136, Transportation Research Board of the National Academies, Washington, D.C., 2009, pp. 57-66.
(4) Liu, Z., and S. Sharma. Predicting Directional Design Hourly Volume from Statutory Holiday Traffic. In Transportation Research Record: Journal of the Transportation Research Board, No. 1968, Transportation Research Board of the National Academies, Washington, D.C., 2006, pp. 30-39.
(5) Liu, Z., and S. Sharma. Nonparametric Method to Examine Changes in Traffic Volume Pattern During Holiday Periods. In Transportation Research Record: Journal of the Transportation Research Board, No. 2049, Transportation Research Board of the National Academies, Washington, D.C., 2008, pp. 45-53.
(6) Keay, K., and I. Simmonds. The association of rainfall and other weather variables with road traffic volume in Melbourne, Australia. Accident Analysis & Prevention, Vol. 37, No. 1, 2005, pp. 109-124.
(7) Van den Bossche, F., G. Wets, and T. Brijs. Predicting Road Crashes Using Calendar Data. In Proceedings of the 85th Annual Meeting of the Transportation Research Board. CD-ROM. Transportation Research Board of the National Academies, Washington, D.C., 2006.
(8) Zwerts, E., and E. Nuyts. Travel behavior research Flanders (January 2000 – January 2001), Part 3A: Analysis of person questionnaire (In Dutch: Onderzoek Verplaatsingsgedrag Vlaanderen (januari 2000 – januari 2001), Deel 3A: Analyse personenvragenlijst). Provinciale Hogeschool Limburg, Departement Architectuur, Diepenbeek, Belgium, 2004.
(9) Agarwal, A. A Comparison of Weekend and Weekday Travel Behaviour Characteristics in Urban Areas. Master Thesis. University of South Florida, Tampa, FL, 2004.
(10) Sall, E.A., and C.R. Bhat. An analysis of weekend work activity patterns in the San Francisco Bay Area. Transportation, Vol. 34, No. 2, 2007, pp. 161-175.
(11) Schwanen, T. The determinants of shopping duration on workdays in The Netherlands. Journal of Transport Geography, Vol. 12, No. 1, 2004, pp. 35-48.
(12) Gould, J., and T.F. Golob. Shopping without travel or travel without shopping? An investigation of electronic home shopping. Transport Reviews, Vol. 17, No. 4, 1997, pp. 355-376.
(13) Frusti, T., C.R. Bhat, and K.W. Axhausen. Exploratory Analysis of Fixed Commitments in Individual Activity-Travel Patterns. In Transportation Research Record: Journal of the Transportation Research Board, No. 1807, Transportation Research Board of the National Academies, Washington, D.C., 2002, pp.101-108.
(14) Lanzendorf, M. Mobility Styles and Travel Behavior: Application of a Lifestyle Approach to Leisure Travel. In Transportation Research Record: Journal of the Transportation Research Board, No. 1807, Transportation Research Board of the National Academies, Washington, D.C., 2002, pp. 163-173.
(15) Cools, M., E. Moons, and G. Wets. Travel time expenditure in Flanders: towards a better understanding of travel behavior. In Proceedings of the 10th International Conference on Computers in Urban Planning and Urban Management (CUPUM). CD-ROM. CUPUM, Iguassu Falls, Brazil, 2007.
(16) Pendyala, R.M. Time Use and Travel Behavior in Space and Time. In Goulias, K.G., ed. Transportation Systems Planning: Methods and Applications. CRC Press, Boca Raton, 2003.
(17) Lambert, D. Zero-inflated Poisson regression, with an application to defects in manufacturing. Technometrics, Vol. 34, No. 1, 1992, pp. 1-14.
(18) SAS Institute Inc. SAS/STAT 9.1 User’s Guide. SAS Institute Inc., Cary, N.C., 2004. (19) Van den Broek, J. A score test for zero inflation in a Poisson distribution. Biometrics, Vol.
51, No. 2, 1995, pp. 738-743.
(20) Simonoff, J.S. Analyzing Categorical Data. Springer, New York, 2003.
(21) Bhat, C.R., and R. Misra. Discretionary activity time allocation of individuals between in-home and out-of-in-home and between weekdays and weekends, Transportation, Vol. 26, No. 2, 1999, pp. 193-209.
(22) Banerjee, A., X. Ye, and R.M. Pendyala. Understanding Travel Time Expenditures Around the World: Exploring the Notion of a Travel Time Frontier. Transportation, Vol. 34, No. 1, 2007, pp. 51-65.
(23) van Wee, B., P. Rietveld, and H. Meurs. Is average daily travel time expenditure constant? In search of explanations for an increase in average travel time. Journal of Transport Geography, Vol. 14, No. 2, 2006, pp. 109-122.
(24) Srinivasan, K.K., and Z. Guo. Analysis of Trip and Stop Duration for Shopping Activities: Simultaneous Harard Duartion Model System. In Transportation Research Record: Journal of the Transportation Research Board, No. 1854, Transportation Research Board of the National Academies, Washington, D.C., 2003, pp. 1-11.
(25) Habib, K.M.N., and E.J. Miller. Modeling Individuals’ Frequency and Time Allocation Behavior for Shopping Activities Considering Household-Level Random Effects. In Transportation Research Record: Journal of the Transportation Research Board, No. 1985, Transportation Research Board of the National Academies, Washington, D.C., 2006, pp. 78-87.
(26) Schlich, R., S. Schonfelder, S. Hanson, and K.W. Axhausen. Structures of Leisure Travel: Temporal and Spatial Variability. Transport Reviews, Vol. 24, No. 2, pp. 219-237.
(27) Lee, B., and H.J.P. Timmermans. A latent class accelerated hazard model of activity episode durations. Transportation Research Part B: Methodological, Vol. 41, No. 4, 2007, pp. 426-447.
(28) Bhat, C.R., and R. Gossen. A mixed multinomial logit model analysis of weekend recreational episode type choice. Transportation Research Part B: Methodological, Vol. 38, No. 9, 2004, pp. 767-787.
(29) Bhat, C.R., T. Frusti, H. Zhao, S. Schönfelder, and K.W. Axhausen. Intershopping duration: an analysis using multiweek data. Transportation Research Part B: Methodological, Vol. 38, No. 1, 2004, pp. 39-60.
LIST OF TABLES AND FIGURES
TABLE 1 Distribution Categories for Travel Time Expenditure, Differentiated by Trip Motive TABLE 2 Mean Travel Time Expenditure According to Trip Motive
TABLE 3 Likelihood Ratio (LR) Statistics for the Zero-Inflated Poisson Regression Models TABLE 4 ZIP Regression Parameter Estimates for Travel Time Expenditure on Commuting TABLE 5 ZIP Regression Parameter Estimates for Travel Time Expenditure on Shopping Trips TABLE 6 ZIP Regression Parameter Estimates for Travel Time Expenditure on Leisure Trips
TABLE 1 Distribution Categories for Travel Time Expenditure, Differentiated by Trip Motive Descriptive measure Commuting Shopping Leisure
Distribution category No travel 62.1 % 70.1 % 78.3 % 1-10 min 4.7 % 8.3 % 4.8 % 11-20 min 7.6 % 8.0 % 5.0 % 21-30 min 6.6 % 5.2 % 2.9 % 31-40 min 4.5 % 2.7 % 2.0 % 41-50 min 3.1 % 1.5 % 1.5 % 51-100 min 7.5 % 3.4 % 3.2 % > 100 min 4.0 % 1.0 % 2.3 % Central tendency
Mean (with 0’s) 18.5 min 8.9 min 10.7 min Mean (without 0’s) 48.9 min 29.8 min 49.5 min
TABLE 2 Mean Travel Time Expenditure According to Trip Motive
Explanatory Variable Commuting Shopping Leisure
Holiday
No holiday 21.9 min 8.6 min 8.3 min
Holiday 11.3 min 9.6 min 15.7 min
Summer holiday 12.8 min 9.4 min 16.6 min
Day-of-week
Monday 29.6 min 7.6 min 9.4 min
Tuesday 31.4 min 6.8 min 8.6 min
Wednesday 24.2 min 8.8 min 5.7 min
Thursday 28.5 min 8.7 min 7.7 min
Friday 25.7 min 8.0min 11.6 min
Saturday 4.4 min 15.2 min 16.9 min
Sunday 3.0 min 7.0 min 24.3 min
Age
6-12 10.8 min 5.3 min 14.4 min
13-15 21.0 min 3.8 min 12.1 min
16-24 27.1 min 6.1 min 13.4 min
25-34 27.7 min 8.8 min 9.9 min
35-44 28.0 min 8.8 min 10.7 min
45-54 24.0 min 10.7 min 10.4 min
55-65 10.0 min 12.4 min 13.4 min
65+ 1.0 min 10.1 min 6.5 min
Gender
Male 24.0 min 7.5 min 12.5 min
Female 13.4 min 10.2 min 9.1 min
Employment status
Housekeeping 0.6 min 15.3 min 9.6 min
Unemployed 1.7 min 15.5 min 6.3 min
Retired 0.6 min 10.3 min 8.6 min
Disabled 1.1 min 9.1 min 8.8 min
Pupil, student 18.6 min 4.8 min 13.8 min
Worker 30.5 min 7.8 min 8.1 min
Employee 31.7 min 10.0 min 11.8 min
Executive 42.0 min 8.6 min 11.9 min
Liberal profession 15.5 min 5.2 min 18.5 min
Self-employed 20.3 min 6.1 min 11.6 min
TABLE 3 Likelihood Ratio (LR) Statistics for the Zero-Inflated Poisson Regression Models Selected variables DF* Commuting Shopping Leisure
Chi² p-value Chi² p-value Chi² p-value
Model predicting Holiday 2 84.2 <0.001 7.7 0.021 2052.4 <0.001 Day-of-week 6 401.0 <0.001 95.8 <0.001 615.2 <0.001 Age 7 1291.7 <0.001 330.2 <0.001 664.9 <0.001 Gender 1 15.4 <0.001 46.2 <0.001 70.3 <0.001 Interaction Age*Gender 7 1388.2 <0.001 238.7 <0.001 896.9 <0.001 Employment status 9 845.1 <0.001 383.5 <0.001 1534.4 <0.001 Living conditions 4 --- --- 223.6 <0.001 1164.2 <0.001 Degree of urbanization 3 120.0 <0.001 219.9 <0.001 863.0 <0.001 Uses of bus/tram 2 931.8 <0.001 497.6 <0.001 117.2 <0.001 Uses of trains 2 3272.5 <0.001 29.1 <0.001 27.6 <0.001 Daily use of motorcycle 1 86.0 <0.001 --- --- 99.3 <0.001 Daily use of bicycle 1 341.4 <0.001 --- --- --- --- Driving license 1 30.0 <0.001 --- --- 211.4 <0.001 Other type trips made 1 1911.8 <0.001 927.4 <0.001 7125.9 <0.001
Model predicting Holiday 2 218.3 <0.001 --- --- 6.4 0.041 Day-of-week 6 909.1 <0.001 136.5 <0.001 204.8 <0.001 Age 7 --- --- 17.5 0.014 15.5 0.030 Gender 1 11.7 <0.001 22.3 <0.001 30.5 <0.001 Employment status 9 1400.6 <0.001 68.1 <0.001 29.2 <0.001 Living conditions 4 --- --- --- --- 14.3 0.006 Driving license 1 --- --- 17.9 <0.001 7.8 0.005 Time spent on other type trips 1 357.4 <0.001 89.4 <0.001 60.3 <0.001
Performance measure
AICC 75489 46880 70572
BIC 75908 47344 71088
Score-test (p-value) <0.001 <0.001 <0.001 * DF: Degrees of freedom, --- indicates that the variables is not included in the final model
TABLE 4 ZIP Regression Parameter Estimates for Travel Time Expenditure on Commuting
Parameter Est. S.E. Parameter Est. S.E. Parameter Est. S.E. Poisson Model
Intercept 3.699 0.020 Gender & Age Use of buses/trams
Holiday Male, 06-12 years -0.429 0.031 Frequently 0.337 0.011
Regular Day 0.000 Male, 13-15 years -0.658 0.033 Occasionally 0.125 0.008 Holiday -0.061 0.009 Male, 16-24 years -0.494 0.021 Never 0.000 Summer Holiday -0.120 0.015 Male, 25-34 years -0.193 0.019 Use of trains
Day-of-week Male, 35-44 years 0.000 Frequently 0.531 0.012
Monday 0.000 Male, 45-54 years 0.093 0.022 Occasionally -0.038 0.008 Tuesday -0.063 0.010 Male, 55-64 years -0.256 0.034 Never 0.000 Wednesday -0.087 0.010 Male, 65+ years 9.004 3.747 Daily use of motorcycle
Thursday -0.037 0.010 Employment status Yes -0.441 0.044 Friday -0.046 0.010 Housekeeping 0.039 0.079 No 0.000 Saturday -0.230 0.018 Unemployed -0.340 0.059 Daily use of bicycle
Sunday -0.203 0.024 Retired -0.012 0.042 Yes -0.143 0.008
Gender Disabled -0.456 0.093 No 0.000
Male 0.456 0.014 Pupil, Student -0.117 0.018 Driving license
Female 0.000 Worker 0.000 Yes 0.081 0.014
Age Employee 0.136 0.009 No 0.000
06-12 years -0.367 0.028 Executive 0.200 0.011 Other type trips made
13-15 years 0.275 0.028 Liberal profession -0.142 0.038 Yes -0.293 0.007 16-24 years 0.247 0.019 Self-employed -0.134 0.017 No 0.000 25-34 years 0.086 0.016 Degree of urbanization
35-44 years 0.000 Metropolitan area -0.155 0.014 45-54 years -0.072 0.019 Urban area 0.018 0.008 55-64 years 0.188 0.030 Suburban area -0.049 0.012 65+ years -8.891 3.747 Rural area 0.000 Zero inflation
Intercept -2.032 0.162 Day-of-week Employment status
Holiday Friday 0.060 0.151 Retired 4.703 0.306
Regular Day 0.000 Saturday 2.573 0.163 Disabled 4.235 0.528 Public Holiday 1.245 0.103 Sunday 3.205 0.203 Pupil, Student 0.407 0.128
Summer Holiday 1.473 0.154 Gender Worker 0.000
Day-of-week Male -0.290 0.090 Employee -0.088 0.130
Monday 0.000 Female 0.000 Executive -0.383 0.179 Tuesday -0.107 0.160 Employment status Liberal profession 1.031 0.368 Wednesday 0.116 0.150 Housekeeping 4.970 0.500 Self-employed 1.043 0.191 Thursday 0.077 0.152 Unemployed 3.785 0.362 Time spent on other trips 0.016 0.001
TABLE 5 ZIP Regression Parameter Estimates for Travel Time Expenditure on Shopping Trips
Parameter Est. S.E. Parameter Est. S.E. Parameter Est. S.E. Poisson Model
Intercept 3.579 0.030 Age Living conditions
Holiday 55-64 0.087 0.025 Alone 0.000
Regular Day 0.000 65+ 0.064 0.029 Others (No partner) -0.045 0.021 Public Holiday -0.034 0.011 Gender & Age Partner -0.039 0.017 Summer Holiday -0.001 0.017 Male, 06-12 0.081 0.046 Partner and others -0.189 0.017
Day-of-week Male, 13-15 -0.736 0.075 Other conditions -0.509 0.075
Monday 0.000 Male, 16-24 -0.425 0.041 Degree of urbanization
Tuesday 0.015 0.021 Male, 25-34 -0.003 0.032 Metropolitan area -0.186 0.022 Wednesday 0.019 0.019 Male, 35-44 0.000 Urban area -0.159 0.011 Thursday 0.057 0.019 Male, 45-54 -0.085 0.033 Suburban area -0.016 0.019 Friday -0.013 0.019 Male, 55-64 -0.031 0.034 Rural area 0.000 Saturday 0.119 0.017 Male, 65+ -0.140 0.033 Use of buses/trams
Sunday -0.021 0.021 Employment status Frequently 0.406 0.017
Gender Housekeeping -0.062 0.023 Occasionally 0.087 0.011
Male 0.095 0.023 Unemployed 0.005 0.025 Never 0.000 Female 0.000 Retired -0.159 0.025 Use of trains
Age Disabled -0.356 0.041 Frequently 0.134 0.024
06-12 0.300 0.046 Pupil, Student -0.380 0.033 Occasionally 0.053 0.011 13-15 0.394 0.054 Worker 0.000 Never 0.000 16-24 0.197 0.029 Employee -0.009 0.017 Other type trips made
25-34 -0.161 0.022 Executive -0.027 0.022 Yes -0.299 0.010 35-44 0.000 Liberal profession -0.359 0.061 No 0.000 45-54 0.086 0.021 Self-employed 0.016 0.030
Zero inflation
Intercept 1.345 0.168 Age Employment status
Day-of-week 06-12 0.300 0.243 Retired -0.539 0.176
Monday 0.000 13-15 0.445 0.285 Disabled -0.239 0.250 Tuesday -0.043 0.130 16-24 0.300 0.171 Pupil, Student 0.000 0.210 Wednesday -0.295 0.121 25-34 -0.121 0.105 Worker 0.000 Thursday -0.315 0.123 35-44 0.000 Employee -0.307 0.108 Friday -0.423 0.121 45-54 0.047 0.110 Executive -0.124 0.145 Saturday -1.070 0.116 55-64 -0.008 0.142 Liberal profession 0.188 0.337 Sunday -0.041 0.129 65+ 0.431 0.183 Self-employed 0.417 0.184
Gender Employment status Driving license
Male 0.318 0.069 Housekeeping -0.870 0.161 Yes -0.600 0.105 Female 0.000 Unemployed -0.840 0.192 No 0.000
TABLE 6 ZIP Regression Parameter Estimates for Travel Time Expenditure on Leisure Trips
Parameter Est. S.E. Parameter Est. S.E. Parameter Est. S.E. Poisson Model
Intercept 4.575 0.032 Gender & Age Living conditions
Holiday Male, 06-12 -0.225 0.031 Other conditions 0.970 0.058
Regular Day 0.000 Male, 13-15 -0.144 0.044 Degree of urbanization
Public Holiday 0.361 0.009 Male, 16-24 0.422 0.031 Metropolitan area 0.507 0.017 Summer Holiday 0.415 0.014 Male, 25-34 -0.316 0.030 Urban area 0.100 0.010
Day-of-week Male, 35-44 0.000 Suburban area 0.189 0.015
Monday 0.000 Male, 45-54 0.133 0.031 Rural area 0.000 Tuesday 0.166 0.020 Male, 55-64 0.434 0.032 Use of buses/trams
Wednesday -0.197 0.021 Male, 65+ 0.370 0.035 Frequently -0.162 0.017 Thursday -0.104 0.019 Employment status Occasionally -0.110 0.010 Friday 0.122 0.017 Housekeeping 0.131 0.026 Never 0.000 Saturday 0.021 0.016 Unemployed -0.607 0.036 Use of trains
Sunday 0.056 0.016 Retired 0.127 0.026 Frequently -0.065 0.020
Gender Disabled 0.435 0.038 Occasionally 0.046 0.010
Male 0.001 0.021 Pupil, Student -0.006 0.028 Never 0.000 Female 0.000 Worker 0.000 Daily use of motorcycle
Age Employee 0.311 0.017 Yes -0.981 0.129
06-12 0.166 0.035 Executive 0.237 0.021 No 0.000 13-15 0.192 0.042 Liberal profession 0.556 0.035 Driving license
16-24 -0.058 0.032 Self-employed 0.518 0.024 Yes -0.292 0.017
25-34 0.141 0.022 Living conditions No 0.000
35-44 0.000 Alone 0.000 Other type trips made
45-54 -0.032 0.023 Others (No partner) -0.581 0.020 Yes -0.783 0.009 55-64 -0.038 0.028 Partner -0.154 0.015 No 0.000 65+ -0.544 0.033 Partner and others -0.385 0.015
Zero inflation
Intercept 1.953 0.225 Age Employment status
Holiday 06-12 -0.274 0.243 Employee -0.379 0.124
Regular Day 0.000 13-15 -0.019 0.272 Executive -0.442 0.159 Public Holiday -0.111 0.081 16-24 -0.312 0.193 Liberal profession -0.688 0.337 Summer Holiday -0.264 0.126 25-34 0.017 0.124 Self-employed 0.042 0.203
Day-of-week 35-44 0.000 Living conditions
Monday 0.000 45-54 0.194 0.128 Alone 0.000 Tuesday 0.189 0.155 55-64 0.258 0.176 Others (No partner) 0.147 0.159 Wednesday 0.026 0.144 65+ 0.627 0.232 Partner 0.209 0.134 Thursday -0.190 0.141 Employment status Partner and others 0.368 0.135 Friday -0.544 0.135 Housekeeping -0.383 0.197 Other conditions 2.036 0.706 Saturday -0.868 0.128 Unemployed -0.350 0.229 Driving license
Sunday -1.162 0.132 Retired -0.211 0.215 Yes -0.364 0.125
Gender Disabled 0.463 0.353 No 0.000
Male -0.408 0.075 Pupil, Student -0.558 0.210 Time spent on other trips 0.005 0.001 Female 0.000 Worker 0.000