HAL Id: hal-01634016
https://hal.archives-ouvertes.fr/hal-01634016
Submitted on 7 Nov 2019
HAL is a multi-disciplinary open access
archive for the deposit and dissemination of
sci-entific research documents, whether they are
pub-lished or not. The documents may come from
teaching and research institutions in France or
abroad, or from public or private research centers.
L’archive ouverte pluridisciplinaire HAL, est
destinée au dépôt et à la diffusion de documents
scientifiques de niveau recherche, publiés ou non,
émanant des établissements d’enseignement et de
recherche français ou étrangers, des laboratoires
publics ou privés.
Characterization of LiFePO4/C Cathode for Lithium Ion
Batteries
Nathalie Lyczko, Ange Nzihou, Patrick Sharrock, Alain Germeau, Claudia
Toussaint
To cite this version:
Nathalie Lyczko, Ange Nzihou, Patrick Sharrock, Alain Germeau, Claudia Toussaint. Characterization
of LiFePO4/C Cathode for Lithium Ion Batteries. Industrial and engineering chemistry research,
American Chemical Society, 2012, 51 (1), p.292-300. �10.1021/ie201799x�. �hal-01634016�
Characterization of LiFePO
4
/C Cathode for Lithium Ion Batteries
Nathalie Lyczko,*
,†Ange Nzihou,
†Patrick Sharrock,
‡Alain Germeau,
§and Claudia Toussaint
§†Universit!e de Toulouse, Mines Albi, CNRS, Centre RAPSODEE, Campus Jarlard, F-81013 Albi cedex 09, France ‡Universit!e de Toulouse, SIMAD, IUT de Castres, av. Pompidou, Castres 81104, France
§PRAYON S.A., Si"ege de Engis - Rue Joseph Wauters, 144 B-4480 ENGIS, Belgium
ABSTRACT:LiFePO4/C was synthesized from a mixture of different precursors of Li, Fe, and C by solid-state reaction. The initial mixture obtained was heated in different calcination conditions under inert atmosphere. The precursor of LiFePO4doped with carbon was studied using different techniques such as thermal analysis, chemical and physical characterizations, and M€osbauer spectroscopy. A calculation of the crystallinity of the final product with two different methods is also presented. The chemical analysis techniques used were IRTF, XRD, and SEM. This characterization confirmed that we obtained a well-crystallized LiFePO4/ C in all the operating conditions tested. The SEM showed aggregation and sintering during the calcination process, which were confirmed by the particle-size distribution measurements and by the physical characterizations. M€osbauer spectroscopy was used to determine the quantity of Fe(II) and Fe(III) contained in the final product. Our calcination conditions did not significantly modify the quantity of the two oxidation states.
1. INTRODUCTION
Numerous research groups have carried out extensive studies of LiFePO4 as a positive electrode material for lithium ion batteries. Interest in this material is due to its low cost, low toxicity, thermal stability, and high theoretical specific capacity of 170 mAh/g.1These studies showed that the synthesizing process is very important in controlling particle morphology and con-ductivity, both of which are determinant in obtaining good electrochemical performance in lithium batteries. The Li+can be extracted from or inserted into LiFePO4 at the electrode potential of 3.5 V versus Li/Li+and at the theoretical specific capacity of 170 mAh/g, but a main problem with LiFePO4is its low electronic conductivity. Both ionic and electronic transport need to be improved simultaneously. An improvement in con-duction properties can be obtained by reducing the size of primary particles with a uniform size distribution.2,3It has also been reported that carbon coating on LiFePO4 particles was effective in improving its electrochemical performance.4Small, high-crystalline particles of LiFePO4 have been prepared by using two processes: solid-state reaction and solution reaction. Many studies have used the solid-state reaction. This method produces LiFePO4/C with a good capacity.5!8The main draw-back to this method is that it results in crystal growth and particle agglomeration, both of which are uncontrollable. Mechanochem-ical activation is also used and produces small particles with a large specific surface area, resulting in an improvement in electronic conductivity.9,10The second group of processes used are the hydrothermal or sol!gel methods, or precipitation in solutions.11,12The hydrothermal method gives well-crystallized particles with a size smaller than 100 nm and with a good capacity.13,14The study showed that a hydrothermal treatment followed of a heating to 500 !C during 1 h allowed to obtain a LiFePO4/C composite with a high discharge capacity of 113 mAh/g. The sol!gel process is increasingly used because it seems to facilitate control of the nanoscale material structure with a good electrochemical performance.15!17
The objective of this paper was to determine whether the thermal treatment conditions have an effect on the properties of the final product in terms of size or magnetic property, which are determining factors for a good capacity. Our aim was the characterization (thermal, chemical, physical, magnetic) of in-dustrial LiFePO4/C powders obtained under mechanochemical conditions. Different powders were prepared by solid-state grinding then calcined under various conditions. The character-istics of the different LiFePO4precursors obtained were com-pared for the different operating conditions investigated.
2. EXPERIMENTAL DETAILS
2.1. Preparation of LiFePO4. The carbon-coated LiFePO4 material was synthesized by mixing stoichiometric amounts of a precursor of lithium and a precursor of iron. A precursor of carbon was then introduced into the ball mill. Different milling conditions were tested, and the mixtures obtained were calcined to obtain the LiFePO4/C precursor. These mixtures were then heated from ambient temperature to 600, 650, or 700 !C with different heating rates (5, 10, and 20 !C/min) with nitrogen providing an inert atmosphere. The inert atmosphere avoids the oxidation of Fe2+into Fe3+. The nitrogen flow rate was varied during the heating. The temperature at which the flow rate was changed was optimized in order to avoid oxidation of the final product.
2.2. Characterization Techniques. 2.2.1. Thermal Analysis.
A thermogravimetric analysis/differential scanning calorimetry (TGA/DSC) apparatus, SDT Q600 made by TA Instruments, was used. LiFePO4/C (20 mg) was heated over the temperature range from ambient to 700 !C at a heating rate of 5 !C/min.
A nitrogen atmosphere with 100 mL/min flow rate was used. Samples were analyzed in alumina crucibles, and the reference was an empty alumina pan.
2.2.2. Chemical Analysis. The structure of LiFePO4/C was characterized by Fourier transform infrared spectroscopy (Shimadzu model FTIR-8400S). The infrared spectra were recorded in the range of 1500!500 cm!1.
The phase identification of the sample was carried out using X-ray diffractometry (XRD, Siemens D5000 diffractometer), which had a Cu Kα radiation at 45 kV and 40 mA. The reflections were collected in the 2θ ranges from 10! to 65! with a step size of 0.05!, a scan speed of 0.016667!/s, and a time of 3.00 s per step. The phase identification was carried out with the JCPDS database.
The morphology and EDX analysis of the LiFePO4/C pre-cursor were observed by scanning electron microscopy (SEM) with a Philips model XL30.
The sample crystallinity was derived from two methods. One from the thermal method (DSC), and the other from the XRD spectra.
The first method used for the determination of crystallinity was the thermal method, from the enthalpy of crystallization that was determined from the DSC curves. The thermal program imposed is presented in Figure 1. A hysteresis curve was imposed to separate crystallization from evaporation. In the first part of the cycle, an endothermic peak appeared, corresponding to the evaporation and crystallization of LiFePO4. In the second part of the cycle, only the crystallization peak was present. From the crystallization enthalpy of the LiFePO4 reference, the crystal-linity of each sample was calculated according to the following
equation:
Crystallinityð%Þ ¼ ΔHc
sample
ΔHcref % 100 ð1Þ
The second method used for the determination of crystallinity was XRD. From XRD spectra, a well-crystallized precursor LiFePO4/C was chosen as the reference. From the intensity of the four main peaks of its XRD spectrum, the sample crystallinity was calculated using the following equation:
%¼ Σ intensityðsampleÞ
Σ intensityðLiFePO4referenceÞ% 100% ð2Þ
The magnetism of the samples was determined by M€osbauer spectroscopy with a Co γ-ray source used to detect Fe3+ impurities existing in the LiFePO4/C. This method is a form of absorption spectroscopy that allows the degree of oxidation of the chemical elements present to be determined. In our case, the iron oxidation states were investigated. These analyses were carried out at ambient temperature, and the doublet was analyzed by fitting to two Lorentzien curves.
2.2.3. Physical Analysis.The true density was measured with a Micromeritics 1330 10 cm3helium pycnometer. Measurements were taken in a cell of 1 cm3with about 0.9 g of sample. For the assays, the pressure was 1.4 bar, and the temperature 20.4 !C. The measurement principle is based on the variation of helium pressure in a calibrated volume. We obtained the true density, that is, the ratio between the mass and the volume of the actual sample. The specific surface area was measured by a Brunauer!Emmett! Teller (BET) analyzer, a Germini Vacprep 061 (Micromeritics).
Figure 1. Hysteresis thermal program.
The sample was first degassed for about 12 h under vacuum at a
temperature of 105 !C. This measurement was made by the five points method, with introduction of various quantities ofnitrogen.
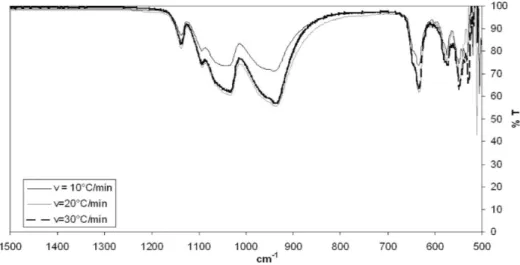
Figure 3. IR spectra of a calcinations temperature of 650 !C avec three-rate heating.
Figure 4. IR spectra for a speed of heating equal to 10 !C/min and three calcination temperatures.
The particle size distribution measurement was carried out with a laser granulometer, a Masterzizer 2000 HYDRO from Malvern. The dispersing agent used was ethanol, so as to avoid any dissolution of particles during the experiment. The range of the particle size measurement was from 0.02 to 2000 μm.
2.2.4. Electrochemical Performance.An experimental battery was made with 80% of the prepared LiFePO4mixed with 10%
carbon black and 10% polyvinylidene fluoride as binder. The binder is compressed between a Li-coated Ni anode and Al cathode separated by a 1 M LiPF6electrolyte in dimethylcar-bonate.25 The galvanostatic charge!discharge tests were performed at a C/10 or C/20 rates. The current densities are in the range of 2.5!4.3 V versus Li+/Li at room temperature (20 !C).29
Figure 6. XRD patterns of LiFePO4/C for different calcinations temperature and a speed of heating equal to 10 !C/min.
3. RESULTS AND DISCUSSION
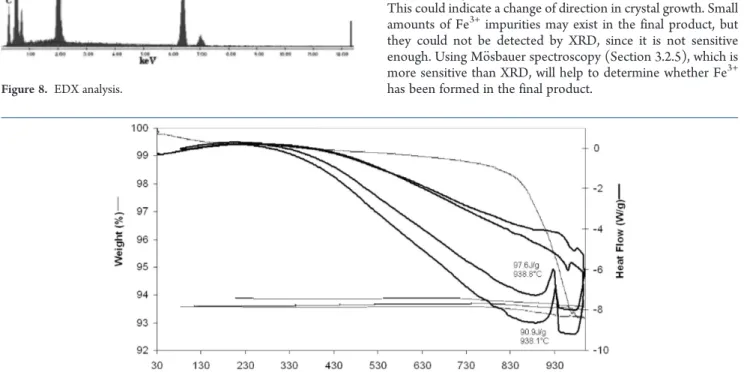
3.1. Thermogravimetry and Calorimetry Characterization.
The TG and DSC curves of the precursor of LiFePO4/C are presented in Figure 2. Three step weight losses were observed in the TG curve with a total weight loss of 19%. The first weight loss (5%) between 100 and 250 !C is related to the dehydration process.
An endothermic peak (DSC curve) at 150 !C was associated with this mass loss, corresponding to physically absorbed water.1 The main weight loss (9%), between 250 and 400 !C, associated with a second endothermic peak (330 !C), corresponded to the decomposition of the carbon precursor and of some organic residue materials. In the last stage, from 400 to 700 !C, an exothermic peak around 460 !C accompanied by about 2% mass loss appeared. This peak was associated with the crystallization process of LiFePO4. These results are in agreement with the literature.15,18!20
3.2. Chemical Characterizations. 3.2.1. Fourier Transform Infrared Spectroscopy.An example of infrared spectra obtained for a LiFePO4/C precursor calcined to the temperature of 650 !C and for three heating rates is presented in Figure 3. In
Figure 4, the infrared spectrum for the same precursor is presented but for different calcination temperatures. The same bands are present in all spectra, regardless of the operating conditions. The range from 500 to 1139 cm!1corresponds to internal modes resulting from the intramolecular vibrations of the (PO4)3!. Symmetric and antisymmetric O!P!O bending modes exist in the range of 500!647 cm!1. Bands present in the range of 945!1139 cm!1correspond to the symmetric and antisymmetric P!O stretching modes. The overall character-istics were similar to those reported in the literature.11,21,22 Whatever the calcination conditions imposed, the functional groups present in the final LiFePO4/C precursor were the same.
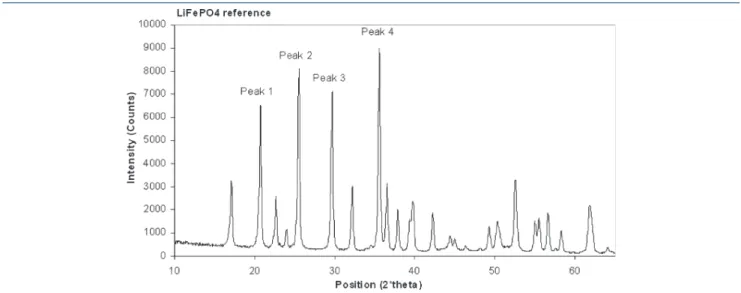
3.2.2. XR Diffractometry.Some X-ray diffraction spectra of the LiFePO4/C obtained after calcination under different tempera-tures and different heating rates are shown in Figures 5 and 6. All diffraction lines were indexed on an orthorhombic olivine system and a space group of Pnmb, which is in agreement with a well-crystallized single-phase LiFePO4 according to the pattern number PDF no. 040!1499. The lattice parameters were as follows: a = 0.60 nm; b = 1.03 nm; and c = 0.47 nm. The olivine crystal structure identified is in agreement with the literature.1,19 Our different calcination conditions (change of calcination temperature or variation of the heating rate) did not modify the crystalline phases present. A temperature of 650 !C with a heating rate of 10 !C/min was sufficient to obtain a well-crystallized LiFePO4/C. From the XRD crystallinity calculation, the optimum conditions are a final temperature of 650 !C with a heating rate of 10 !C/min. The intensities of some of the peaks were modified under certain conditions. For instance, for the same final temperature, the intensity of some peaks increased when the heating speed increased. For example, for the peak located at 2θ = 29.7!, the intensity decreased near 2% when the heating rate increased and inversely for the peak at 2θ = 25.5!, which increased about 4%. In all XRD patterns, the main peak corresponding to 100% of intensity was located at 2θ = 35.6!. This could indicate a change of direction in crystal growth. Small amounts of Fe3+impurities may exist in the final product, but they could not be detected by XRD, since it is not sensitive enough. Using M€osbauer spectroscopy (Section 3.2.5), which is more sensitive than XRD, will help to determine whether Fe3+ has been formed in the final product.
Figure 8. EDX analysis.
3.2.3. SEM and EDX. SEM micrographs for LiFePO4/C obtained at a calcination temperature of 700 !C and a heating rate of 10 !C/min are presented in Figure 7. In Figure 7a, a0, two
types of particles can be observed. There are some plates with primary particles bonded to the surface, and there are also aggregates of primary particles. The observation by SEM of the lithium precursor alone showed rounded particles (Figure7b), while observation of the iron precursor revealed flat particles (Figure7c).These observations are consistent with the type of particle present in the final product. The particle aggregation was confirmed by the particle size distribution measurement. In Figure 7d, the aggregation of primary particles can be observed. In Figure 7e, sintering was detected, which occurred during the calcination process on the surface of the plates. An energy dispersive X-ray (EDX) analysis was also carried out to identify the elemental atoms presents. An example of result obtained is presented in Figure 8. The EDX analysis of LiFePO4/C showed the atomic percentage of C ranged between 22 and 26% in the aggregates and between 28 and 35% in the plates. The EDX point analysis was repeatedly made on several particles to verify distribution of elements. From this observation, it was concluded that the carbon allocation seemed homogeneous in the various types of particles present. From this analysis, we calculated the ratio of the elemental atoms and found Fe/P well equal to 1 and O/Fe or O/P equal to 4. This confirmed the LiFePO4precursor formation.
3.2.4. Crystallinity. The first method used to calculate the crystallinity was to determine the enthalpy of crystallization,
which was calculated from DSC curves. An example of the curves obtained is presented in Figure 9. The DSC curve corresponds to a hysteresis curve. In the first part of the curve, an exothermic peak appears, caused by evaporation, and crystallization (97.6 J/g) of LiFePO4accompanied by a weight loss. In the second part (corresponding to the second heating), an exothermic peak appears (90.6 J/g) without weight loss accompanying the LiFe-PO4 crystallization. The crystallization enthalpy of different precursors was calculated from this peak. Results obtained are presented in Figure 10. DSC curves gave crystallinity for temperatures of 600 and 650 !C lower than 70%, while for the temperature of 700 !C, the crystallinity was higher than 100% with respect to the LiFePO4 reference. At a temperature of 700 !C, the final product had a better crystallinity than at the other calcination temperatures. This shows that the calcination conditions affect the crystallinity of the final product.
Another method used to determine crystallinity is XRD. Figure 11 shows the four peaks that were taken into account for the crystallinity calculation from eq 1. Results obtained are presented in Figure 12 and show that temperatures of 650 and 700 !C produced similar crystallinities (75% < % crystallinity <90%). On the other hand, for some samples obtained with a temperature of 600 !C, crystallinity was much lower (between 50% and 60%). For all precursors obtained, the Scherrer diameter was calculated, and no modification was observed in the size of the crystallites (between 38 and 44 nm) in our operating conditions.
The thermal method is more rigorous than the XRD method because it depends only on the chemical and thermodynamic properties of the product analyzed. The experimental prepara-tion condiprepara-tions for the samples have no effect on the result.
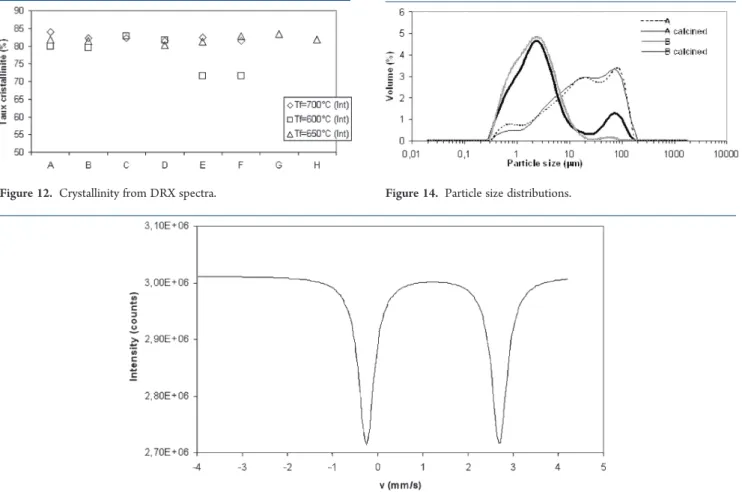
3.2.5. Quantification of Fe(II) and Fe(III). Some reaction products were analyzed by M€osbauer spectroscopy to quantify the Fe(II) and Fe(III) in the sample. The M€osbauer spectrum displayed in Figure 13 allowed the different Fe oxidation states to be quantified. Each peak corresponds to a different iron oxidation state. The first peak corresponds to Fe(II) and the second peak to Fe(III). These two peaks present in the spectrum are typical for iron compounds in mostly low oxidation state. Results are in agreement with a graph typically obtained for doped LiFePO4,as several authors have already shown.23,24 Results obtained for
Figure 10. Crystallinity from thermal analysis.
different LiFePO4precursors gave almost identical proportions in the various samples analyzed, 90% < Fe(II) <95% and 5% < Fe(III) <10%. So, our calcination conditions did not modify the final compositions of the samples. It would be interesting to connect these data with battery performance to assess the sensitivity of performance with regard to the quantity of Fe(III) present in the final product.
3.3. Physical Characterizations.Figure 14 presents the particle size distributions for two initial mixtures before (mixtures A and B) and after their calcination (mixture A calcined and B calcined) to a final temperature of 700 at 10 !C/min. The difference between these two mixtures is that mixture A contains all particles obtained after the ball milling while mixture B is composed of smaller particles. For the initial mixture A, the distribution was polymodal with small particles (peak at 0.7 μm) and larger ones (20 and 90 μm). This distribution remained unchanged after the calcination process. Some small particles disappeared in favor of the largest ones corresponding to agglomeration during the heating process. However, the main particle size distribution was the same with the maximum remaining at the same particle size.
For the initial mixture B, the particle distribution presented a large main peak around 2 μm and only a few particles around 80 μm. After calcination at 700 !C, the peak corresponding to the small particles was still present, but the peak around 80 μm increased significantly. The appearance of this higher quantity of large particles was in agreement with the SEM observations (Figure 7a, a0), where two aggregates of primary particles were
present. This increase in the quantity of large particles may
correspond to the sintering occurring with temperature rise. The sintering of particles began around 650 !C and corresponds to the formation of grain boundaries between particles. This phenomenon may explain the increase in the presence of larger particles. This phenomenon also occurred for mixture A, but it was less evident because this intitial mixture had a significant amount of particles larger than 10 μm.
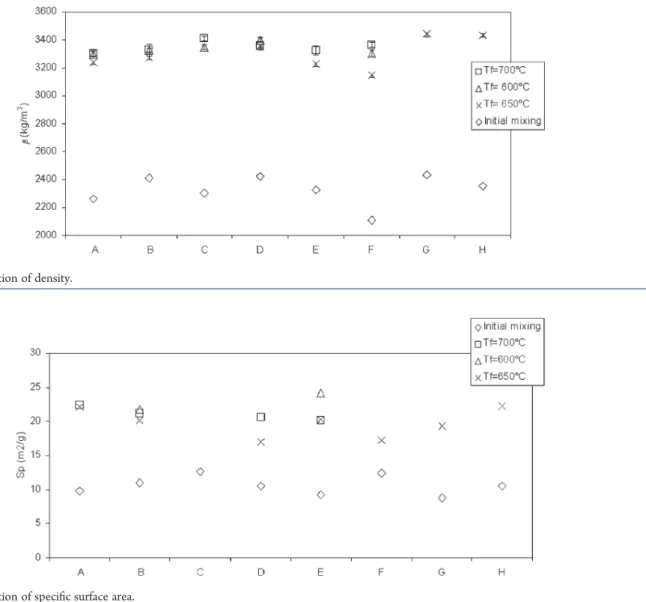
The density variation for different initial mixtures before and after their calcination is presented in Figure 15. The density of initial mixtures was found to be between 2000 and 2500 kg/m3, and the density of the final products was superior to 3000 kg/m3 regardless of the initial mixture used or the final calcination temperature. For the specific surface area (Figure 16), the same evolution was observed. Initial products had a specific area of about 10 m2/g while for the precursor LiFePO
4it was superior to 17 m2/g. These two characterizations show that calcination produced a denser and more reactive material. Under our operating conditions, the final temperature of calcinations (in the range studied) did not have a major influence on these two physical characteristics. The same observation can be made with regard to the heating rate. The rates used (5!30 !C/min) had no effect on the density or the specific surface area.
3.4. Electrochemical Performances.The first results obtained for electrochemical performance are presented in Table 1. For a heat treatment at 700 !C, electrochemical performances were identical and were of 128 mAh/g for the five examples considered. The difference observed between the samples are linked to the size distribution. In fact, the paricle size control allowed increasing the perfomance from 130 to 135 mAh/g. In
Figure 12. Crystallinity from DRX spectra.
Figure 13. M€osbauer analysis.
the other side, the analysis of a sample heated up to 650 !C showed a better electrochemical performance. When the particles are mainly small, the performance is improved. These results are consistent with results obtained by some authors in the literature.2,3A homogeneous size distribution and small particles decrease the mean free path of lithium, and the movement of electrons is falicitated.
4. CONCLUSIONS
A LiFePO4/C precursor made by a solid-state reaction was characterized under different calcination conditions, to reveal the influence (or not) of the calcination process.
Thermal characterization of the initial mixture showed the LiFePO4/C crystallization process occurring between 450 and 500 !C.
IR spectra confirmed that variations in calcination tempera-tures or heating rates did not change the functional groups of the
product. All calcination conditions used in this study allowed LiFePO4/C to be synthesized in an orthorhombic olivine structure with a Pnmb space group. With the SEM analysis, two types of particles were observed, some plates with primary particles on the surface and some aggregates of primary particles. The EDX confirmed a homogeneous allocation of carbon in the final product. With SEM micrographs, sintering was seen on the plate surface. The physical characterization showed that calcina-tion caused a densificacalcina-tion of the final material and increased its reactivity. Moreover, the particle size distribution measurements confirmed the appearance of larger particles that corresponded to aggregates observed in the SEM micrograph.
The M€osbauer analysis showed that the proportion of Fe(II) to Fe(III) did not differ significantly following changes in calcination conditions. Investigations on LiFePO4doped by C, used as a positive electrode material for Li+ion batteries, are increasingly turning to techniques allowing control of particle size and porosity.25!28 These parameters are very important because if the particle size is smaller than the distance of Li+ ion diffusion is decreased and if particles present porosity then ion diffusion is facilitated. Modifying these parameters should improve the performance of LiFe-PO4/C in batteries.
Figure 15. Variation of density.
Figure 16. Variation of specific surface area.
Table 1. Electrochemical Performances
final sample A, Tf= 700 !C B, Tf= 700 !C C, Tf= 700 !C D, Tf= 700 !C E, Tf= 650 !C mAh/g 123 128 130 135 147
’AUTHOR INFORMATION
Corresponding Author
*Tel.: +33 5634931121. Fax: +33 563493243. E-mail: lyczko@ mines-albi.fr.
’ACKNOWLEDGMENT
The contribution of Christine Rolland (ESEM) is gratefully acknowledged.
’REFERENCES
(1) Franger, S.; Le Cras, F.; Bourbon, C.; Rouault, H. Optimized lithium iron phosphates for high-rate electrochemical applications. J. Electrochem. Soc. 2004, 26, A1024–A1027.
(2) Delacourt, C.; Poizot, P.; Levasseur, S. Size effects on carbon-free LiFePO4powders: The key to superior energy density. Electrochem. Solid
State Lett. 2006, 9, A352–355.
(3) Franger, S.; Bourbon, C.; Le Cras, F. Comparison between different LiFePO4synthesis routes and their influence on its
physico-chemical properties. J. Power Sources 2003, 119, 252–257.
(4) Chen, Z. H.; Dahn, J. R. J. Electrochem. Soc. 2002, 149, A1184– A1189.
(5) Chen, H.; Yu, W.-Z.; Han, S. C.; Xu, Z. Y. Preparation and electrochemical properties of LiFePO4/C composite with network
structure for lithium ion batteries. Trans. Nonferrous Met. Soc. China 2007, 17, 951–956.
(6) Gu, H.-B.; Jun, D. K.; Park, G. C.; Jin, B.; Jin, E. M. Nanosized LiFePO4cathode materials for lithium ion batteries. J. Nanosci.
Nano-technol. 2007, 7, 3980–3984.
(7) Dong, Y. Z.; Zhao, Y. M.; Chen, Y. H.; He, Z. F.; Kuang, Q. Optimized carbon-coated LiFePO4 cathode material for lithium-ion
batteries. Mater. Chem. Phys. 2009, 115, 245–250.
(8) Yu, L.; Liu, Q.; Wang, H. Synthesis of LiFePO4-C cathode
materials using a green low-cost method. Ionics 2009, 15, 689–692. (9) Shin Cho, W. I.; Jang, H. Electrochemical properties of the carbon-coated LiFePO4as a cathode material for lithium-ion secondary
batteries. J. Power Sources 2006, 159, 1383–1388.
(10) Franger, S.; Benoit, C.; Bourbon, C.; Le Cras, F. Chemistry and electrochemistry of LiFePO4composite materials for secondary lithium
batteries. J. Phys. Chem. Solids 2006, 67, 1338–1342.
(11) Arnold, G.; Garche, J.; Hemmer, R.; Str€obele, S.; Vogler, C.; Wohlfahrt-Mehrens, M. Fine-particle lithium iron phosphate LiFePO4
synthesized by a new low-cost aqueous precipitation technique. J. Power Sources 2003, 119!121, 247–251.
(12) Ni, J. F.; Zhou, H. H.; Chen, J. T.; Zhang, X. X. LiFePO4doped
with ions prepared by co-precipitation method. Mater. Lett. 2005, 59, 2361–2365.
(13) Kuwahara, A.; Suzuki, S.; Miyayama, M. High-rate properties of LiFePO4/carbon composite as cathode materials for lithium-ion
batteries. Ceram. Interfaces 2008, 34, 863–866.
(14) Wang, G.; Shen, X.; Yao, J. One-dimensional nanostructures as electrodematerials for lithium-ion batteries with improved electroche-mical performance. J. Power Sources 2009, 189, 543–546.
(15) Sanchez, M. A. E.; Brito, G. E. S.; Fantini, M. C. A.; Goya, G. F.; Matos, J. R. Synthesis and characterization of LiFePO4prepared by
sol-gel method. Solid State Ionics 2006, 177, 497–500.
(16) Choi, D.; Kumta, P. N. Surfactant based sol-gel approach to nanostructured LiFePO4for high rate Li-ion batteries. J. Power Sources
2007, 163, 1064–1069.
(17) Goktepe, H.; Sahan Ahan, H.; Pata, S. Determination of optimum carbon content of LiFePO4cathode material for lithium ion
batteries. Asian J. Chem. 2009, 21, 3186–3192.
(18) Wang, Y.; Sun, B.; Park, J.; Kim, W. S.; Kim, H. S.; Wang, G. Morphology control and electrochemical properties of nanosize LiFe-PO4cathode materials synthesized by co-precipitation combines with
in situ polymerization. J. Alloys Compd. 2011, 509, 1040–1044.
(19) Peng, W.; Jiao, L.; Gao, H.; Qi, Z.; Wang, Q.; Du, H.; Si, Y.; Wang, Y.; Yuan, H. A novel sol-gel method based on FePO43 2H2O to
synthesize submicrometer structured LiFePO4/C cathode material.
J. Power Sources 2011, 196, 2841–2847.
(20) Scaccia, S.; Carewska, M.; Wisniewski, P.; Prosini, P. P. Mor-phological investigation of sub-micron FePO4and LiFePO4particles for
rechargeable lithium batteries. Mater. Res. Bull. 2003, 38, 1155–1162. (21) Ait Salah, A.; Mauger, A.; Julie, C. M.; Fendron, F. Nano-sized impurity phases in relation to the mode of preparation of LiFePO4.
Mater. Sci. Eng. 2006, B129, 232–244.
(22) Zaghib, K.; Mauger, A.; Gendron, F.; Julien, C. M. Surface effects on the physical and electrochemical properties of thin LiFePO4
particles. Chem. Mater. 2008, 20, 462–469.
(23) Song, M.-S.; Kang, Y.-M.; Kim, J.-H.; Kim, H.-S.; Kim, D.-Y.; Kwon, H.-S.; Lee, J.-Y. Sample and fast synthesis of LiFePO4-C
composite for lithium rechargeable batteries by ball-milling and micro-wave heating. J. Power Sources 2007, 166, 260–265.
(24) Martin, J.-F.; Cuisinier, M.; Dupr!e, N.; Yamada, A.; Kanno, R.; Guyomard, D. More on the reactivity of olivine LiFePO4nano-particles
with atmosphere at moderate temperature. J. Power Sources 2011, 196, 2155–2163.
(25) Gao, M.; Lin, Y.; Yin, Y.; Liu, Y.; Pan, H. Structure optimization and structural factors for the discharge rate performance of LiFePO4/C
cathode materials. Electrochim. Acta. 2010, 55 (Issue27), 8043–8050. (26) Dominko, R.; Bele, M.; Gaberscek, M.; Remskar, M.; Hanzel, D.; Goupil, J. M.; Pejovnik, S.; Jamnik, J. Porous olivine composites synthesized by sol-gel technique. J. Power Sources 2006, 153, 274–280. (27) Gaberscek, M.; Dominko, R.; Bele, M.; Remskar, M.; Hanzel, D. Porous carbon-decorated LiFePO4prepared by sol-gel method based
on citric acid. Solid State Ionics 2005, 176, 1801–1805.
(28) Sundarayya, Y.; Kumara, K. C.; Sunandana, C. S. Oxalate based non aqueous sol-gel synthesis of phase pure sub-micron LiFePO4. Mater.
Res. Bull. 2007, 42, 1942–1948.
(29) Patoux, S.; Martinet, S.; Launois, S.; Gourgue, A.; Germeau, A. Accumulateurs au lithium "a base de phosphate de fer lithi!e et de carbone. Eur. Pat. 2 355 214 A1, 2011.