HAL Id: hal-02023215
https://hal.archives-ouvertes.fr/hal-02023215
Submitted on 17 Nov 2020
HAL is a multi-disciplinary open access
archive for the deposit and dissemination of
sci-entific research documents, whether they are
pub-lished or not. The documents may come from
teaching and research institutions in France or
abroad, or from public or private research centers.
L’archive ouverte pluridisciplinaire HAL, est
destinée au dépôt et à la diffusion de documents
scientifiques de niveau recherche, publiés ou non,
émanant des établissements d’enseignement et de
recherche français ou étrangers, des laboratoires
publics ou privés.
New ultra-cool and brown dwarf candidates in Gaia
DR2⋆
C. Reylé
To cite this version:
C. Reylé. New ultracool and brown dwarf candidates in Gaia DR2⋆. Astronomy and Astrophysics
-A&A, EDP Sciences, 2018, 619, pp.L8. �10.1051/0004-6361/201834082�. �hal-02023215�
https://doi.org/10.1051/0004-6361/201834082 c ESO 2018
Astronomy
&
Astrophysics
L
ETTER TO THEE
DITORNew ultra-cool and brown dwarf candidates in Gaia DR2
?
C. Reylé
Institut UTINAM, CNRS UMR6213, Univ. Bourgogne Franche-Comté, OSU THETA Franche-Comté-Bourgogne, Observatoire de Besançon, 1615, 25010 Besançon Cedex, France
e-mail: celine@obs-besancon.fr
Received 13 August 2018/ Accepted 12 September 2018
ABSTRACT
Context.The second Gaia data release (Gaia DR2) contains high-precision positions, parallaxes, and proper motions for 1.3 billion sources. The resulting Hertzsprung–Russel diagram reveals fine structures throughout the mass range.
Aims.This paper aims to investigate the content of Gaia DR2 at the low-mass end and to characterize ultra-cool and brown dwarfs.
Methods.We first retrieved the sample of spectroscopically confirmed ultra-cool and brown dwarfs in Gaia DR2. We used their locus in the precise Hertzsprung–Russel diagram to select new candidates and to investigate their properties.
Results.The number of spectroscopically confirmed objects recovered in Gaia DR2 corresponds to 61% and 74% of the expected
number of objects with an estimated Gaia magnitude Gest ≤ 21.5 and 20.3, respectively. This fills much of the gap to Gaia DR1.
Furthermore, Gaia DR2 contains ∼13 000 ≥ M7 and 631 new L candidates. A tentative classification suggests that a few hundred of them are young or subdwarf candidates. Their distance distribution shows that the solar neighborhood census is still incomplete.
Conclusions.GaiaDR2 offers a great wealth of information on low-mass objects. It provides a homogeneous and precise catalog of candidates that is worthwhile to be further characterized with spectroscopic observations.
Key words. stars: low-mass – solar neighborhood – Galaxy: stellar content – surveys – catalogs
1. Introduction
The Gaia mission (Gaia Collaboration 2016b) provides full-sky coverage down to the Gaia magnitude G = 20(V ' 20−22) at the spatial resolution of the HST, with about 70 observations per source over five years. Distances, with an amazing precision of 1% up to 2.5 kpc at the end of the mis-sion, and proper motions are now measured for 1.3 billions stars.
As highlighted in the scientific demonstration paper from (Gaia Collaboration 2018a), Gaia astrometry and photome-try are powerful tools for studying fine structures within the Hertzsprung–Russell (HR) diagram. It is now possible to dis-tinguish the locus of different types of objects, as predicted by models.
The Gaia optical observations are not the most suitable observations for studying the low-mass reddest end of the HR diagram. Nevertheless, the large number of objects observed with an unprecedented precision, including trigonometric par-allax, makes it an unrivaled dataset for studying the ultra-cool and brown dwarfs.
These low-mass objects are the dominant stellar compo-nent of the Milky Way (∼70% of all stars,Reid & Gizis 1997; Bochanski et al. 2010). They still remain elusive, however, because of their low luminosity, and modeling their complex atmosphere is still a challenge. Therefore, the understanding of
? Full Table 2 is only available at the CDS via anonymous ftp
tocdsarc.u-strasbg.fr(130.79.128.5) or viahttp://cdsarc.
u-strasbg.fr/viz-bin/qcat?J/A+A/619/L8
this population has relevant implications for both stellar and Galactic astronomy.
Ultra-cool dwarfs have been defined by Kirkpatrick et al. (1997) as M7 and later main-sequence stars. This corresponds to an effective temperature of .2700 K (Rajpurohit et al. 2013). These objects serve as a link between known stars and brown dwarfs. They span the transition from stellar to sub-stellar masses: this effective temperature is expected in a 0.03 M object
of 8 Myr or in a 0.095 M object of 10 Gyr (Baraffe et al. 2015),
both at solar metallicity.
Smart et al. (2017) compiled an input catalog of known L and T dwarfs with an estimated G magnitude within the reach of Gaia. They identified part of them in Gaia DR1 (Gaia Collaboration 2016a). They found 321 L and T dwarfs, with 10 ≥ L7, which corresponds to 45% of the brown dwarfs with estimated Gaia magnitude Gest≤ 20.3. As they pointed out,
this incompleteness is mainly due to the cuts made in the cata-log to ensure the quality of the data. With eight more months of observations, Gaia DR2 (Gaia Collaboration 2018b) should provide more complete and precise data, and help to fill this gap. Recent discoveries show that even the local census is not com-plete, as illustrated by the discovery of an L7 at 11 pc, close to the Galactic plane (Scholz & Bell 2018;Faherty et al. 2018).
In a first step, we search for known ultra-cool and brown dwarfs in Gaia DR2 and investigate their properties using their Gaia observations (Sect. 2). In a second step, we use the properties from the known sample to show the poten-tial of Gaia DR2 to reveal new candidates and list them (Sect. 3). The conclusions and perspectives are given in Sect.4.
A&A 619, L8 (2018) 2. Known ultra-cool and brown dwarfs found
in Gaia DR2 2.1. Sample
We focus on the well-characterized sample of ultra-cool and brown dwarfs that have a spectroscopic spectral type. A compi-lation of all L, T , and Y dwarfs that Gaia is expected to observe directly or constrain indirectly (e.g., in a common proper motion system with brighter members), the so-called Gaia Ultracool Dwarf Sample (GUCDS), has been published by Smart et al. (2017). GUCDS is based on the online census compiled by J. Gagné1, which contains all objects from the Dwarfarchives2
database, complemented by the catalogs ofDupuy & Liu(2012) andMace(2014). Some of these objects have information on age or metallicity, and they are listed in the census as young candi-dates or subdwarfs.Smart et al.(2017) added the recent discov-eries fromMarocco et al.(2015) andFaherty et al.(2016). This catalog has 1886 entries, for which the predicted G magnitude is brighter than 21.5 for 1010 L and 58 T dwarfs. This is within the reach of Gaia.
To this census, we added the ultra-cool (M7–M9.5) dwarfs listed by J. Gagné3 and the new spectroscopically con-firmed objects from (Rajpurohit et al. 2014;Robert et al. 2016; Faherty et al. 2018; Zhang et al. 2018). Because we wish to study the location in the fine Gaia DR2 HR diagram of a well-characterized sample, we did not include the numerous can-didates that are found in photometric surveys without spectro-scopic confirmation.
We retrieved these entries using their 2MASS identi-fier and cross-matching Gaia DR2 with the 2MASS cat-alog (Skrutskie et al. 2006) provided in the Gaia archive (Marrese et al. 2017). We also used the Gaia DR2 identifier when available in the SIMBAD astronomical database4
(Wenger et al. 2000), particularly for the faint objects found within the SDSS (Eisenstein et al. 2011) and SIMPS (Artigau et al. 2009) catalogs that have no counterpart in 2MASS.
The resulting sample includes 3671 ultra-cool (≥M7), 647 L, and 16 T dwarfs, 34 of which have a spectral type ≥L7. Of these, 1806 ≥ M7, 526 L, and 9 T dwarfs have a relative precision on parallax σ$≤ 10%, and full astrometric (coordinates, parallax, and proper motions) and photometric (G, GBP, and GRP)
infor-mation. Twenty-six are noted in the census as subdwarfs and 75 as young candidates. The spectral type distribution of the input catalog, the sample with an entry in Gaia DR2, and the sub-sample with σ$≤ 10% is shown in Fig.1.
We built the HR diagram by computing the absolute Gaia magnitude in the G band for individual stars using MG = G −
5 log10(1000/$)+5, where $ is the parallax in milli-arcseconds. The simple distance determination from $ is valid when σ$. 20% (Luri et al. 2018).
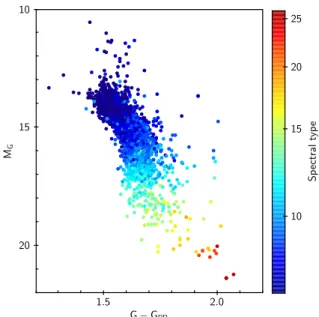
Figure 2 shows the HR diagram of the sub-sample with σ$≤ 10%. The color code gives the spectral type. The adopted
spectral type is the mean of the optical and near-infrared spectral type when both are available. We used G −GRPas the color index
because these faint and red objects have a lower flux in the BP bandpass. 1 https://jgagneastro.wordpress.com/ list-of-ultracool-dwarfs/ 2 http://dwarfarchives.org 3 https://jgagneastro.wordpress.com/ list-of-m6-m9-dwarfs/ 4 http://simbad.u-strasbg.fr/simbad/ 10 20 30 Spectral type 10 100 1000
Fig. 1.Spectral type distribution of the known ultra-cool (≥M7) and
brown dwarfs. Black line: input catalog. Gray line: objects with a counterpart in Gaia DR2. Filled gray: objects with a counterpart in
GaiaDR2 and σ$ ≤ 10%. 10 stands for L0, 20 for T0, and 30 for
Y0 on the spectral type axis.
1:5 2:0 G ¡ GRP 10 15 20 MG 10 15 20 25 S p ec tr al ty p e
Fig. 2.HR diagram of the known ultra-cool and brown dwarfs found in
GaiaDR2 that have σ$ ≤ 10%. The color bar gives the spectral type
range, where 10 stands for L0 and 20 for T0.
As the sub-sample with σ$ ≤ 10% contains all astrometric
properties, it allows us to explore the HR diagram as a function of transverse velocity. The transverse velocity VTwas computed
as follows: VT=
q µ2
α+ µ2δ×4.74$ , where µαand µδare the proper
motions. This is shown in Fig.3. Thanks to the high precision of Gaia measurements, it is possible to distinguish a sequence of young candidates (redder and brighter) with a low transverse velocity from the sequence of lower metallicity dwarfs (bluer and fainter). The vast majority of the subdwarfs have a high transverse velocity, indicating that they belong to the older pop-ulations of the Milky Way, as expected. This separation seems slightly enhanced in the G − J color index over the G − GRP
index.
1:5 2:0 G ¡ GRP 10 15 20 MG 0 100 200 300 T ra n sv er se ve lo ci ty (k m s ¡ 1) 3 4 5 6 G ¡ J 10 15 20 MG 0 100 200 300 T ra n sv er se ve lo ci ty (k m s ¡ 1)
Fig. 3.HR diagram of the known sample found in Gaia DR2 (restricted to the sub-sample with σ$ ≤ 10%), using the G − GRP(left panel) and
G − J(right panel) color index. The color bar gives the transverse velocity range. Filled squares are objects listed as subdwarfs in the census, and
open circles are objects listed as young candidates.
Table 1. Colors, absolute magnitudes, and spectral type relations obtained from the polynomial fitting Y= aX2+ bX + c.
Y X X-range a b c MG SpT M7–T6 −0.020 ± 0.001 0.985 ± 0.025 8.298 ± 0.135 MJ SpT M7–T6 −0.011 ± 0.001 0.627 ± 0.023 6.372 ± 0.122 MH SpT M7–T6 −0.007 ± 0.001 0.503 ± 0.023 6.453 ± 0.122 MK s SpT M7–T6 −0.003 ± 0.001 0.387 ± 0.023 6.709 ± 0.122 G − GRP SpT M7–T6 0 0.029 ± 0.001 1.358 ± 0.005 G − J SpT M9–T6 0 0.108 ± 0.003 3.603 ± 0.036 J − Ks SpT M7–L9 0 0.0635 ± 0.002 0.562 ± 0.016 MJ J − Ks 0.5–2.2 2.119 ± 0.116 −2.531 ± 0.282 10.967 ± 0.172
Notes. SpT ranges from 7 (for M7) to 26 (for T6). We list the range in which the relations are valid.
2.2. Color, absolute magnitude, and spectral type relations We determined the relationships between MG, MJ, MH, MK s,
G − J, J − Ks, and spectral type from a polynomial fitting of
the sub-sample (σ$ ≤ 10%). We also determined the MJ vs.
J − Ks relation. The resulting parameters and their asymptotic
standard errors are summarized in Table1. The validity range of each relation is also given. Some of the relations are shown in Fig.4.
The dashed line in the right panel of Fig. 4 represents the relation derived from 304 L dwarfs found in Gaia DR1 (Smart et al. 2017). The difference is due to the evolution of the photometric system between Gaia DR1 and Gaia DR2, as described inGaia Collaboration(2018b).
Young candidates depart from these relationships, in par-ticular in the M-dwarf regime. It is also possible to distin-guish the relation followed by the subdwarfs. Such trends have been presented extensively in different photometric systems by Zhang et al. (2018) based on their sample of 20 L subdwarfs found in Gaia DR2.
3. New ultra-cool and brown dwarf candidates in Gaia DR2
Our aim is to search for robust candidates in Gaia DR2, in par-ticular, to define a list of objects deserving further investigations
such as spectroscopic follow-up. Thus we chose to apply strict filters on the data that were based on astrometric and photometric features. Detailed information on the data processing, validation, and catalog content are given byLindegren et al.(2018) for the astrometry and byRiello et al.(2018) andEvans et al.(2018) for the photometry. The global validation of the catalog can be found inArenou et al.(2018), and the description of the Gaia archive5 inSalgado et al.(2018).
3.1. Data filtering
In order to work on a precise HR diagram, we followed Gaia Collaboration (2018a) to filter the data. We refer to this paper for a detailed description of the applied filters. Here we describe their effects only briefly. The Gaia Collabora-tion retained objects with σMG < 0.22 mag, σG< 0.022 mag,
σGRP< 0.054 mag, and reliable five-parameter solutions
(astro-metric and photo(astro-metric), and removed most artifacts. The corresponding Gaia archive query is
SELECT * FROM gaiadr2.gaia_source WHERE parallax_over_error > 10 AND phot_g_mean_flux_over_error>50 AND phot_rp_mean_flux_over_error>20
A&A 619, L8 (2018) 10 15 20 25 Spectral type 10 15 20 MG 10 15 20 25 Spectral type 6 8 10 12 14 16 MJ 10 15 20 25 Spectral type 3 4 5 6 G ¡ J
Fig. 4.MG(left panel), MJ(middle panel), and G − J (right panel) relations vs. spectral type of the known ultra-cool and brown dwarfs found in
GaiaDR2. 10 stands for L0, and 20 for T0. The squares show the subdwarfs, and the open circles the young candidates. The black line gives the
fits, and the gray lines include the asymptotic standard errors. The G − J vs. spectral type relation is valid from M7 to L9). The black dashed line
is the relation derived from L0 to L7 found in Gaia DR1 (Smart et al. 2017).
AND visibility_periods_used>8
AND astrometric_chi2_al/(astrometric_n_good_obs_al-5) <1.44*greatest(1,exp(-0.4*(phot_g_mean_mag-19.5)))
FollowingGaia Collaboration(2018a), we also restricted the sample to low-extinction regions in the Milky Way and kept objects with a reddening E(B − V) ≤ 0.015 according to the 3D extinction map ofCapitanio et al.(2017). The resulting HR diagram is shown in the left panel of Fig.5.
3.2. Color excess
The HR diagram has a fuzzy appearance between the white dwarfs and the main sequence, and redward of the main sequence. Whereas the G flux is determined from a profile fit-ting, the fluxes in the blue (BP) and red (RP) photometers are the total flux in a field of 3.5 × 2,1 arcsec2. Therefore, the mea-sured BP and RP fluxes may include a contribution of flux from bright sky background (e.g., in crowded regions or from a nearby source). As explained in Evans et al. (2018), IG, IBP, and IRP,
the flux in the G, GBP, and GRPbandpass, respectively, should
be consistent (the sum of the BP and RP fluxes is expected to exceed the G flux by only a small factor). They defined the color excess factor phot_bp_rp_excess_factor = (IBP+ IRP)/IG
and an empirical limit to reject the affected sources having phot_bp_rp_excess_factor ≥1.3+ 0.06 × (GBP− GRP)2.
The resulting HR diagram when applying this filter is shown in the middle panel of Fig. 5. Because ultra-cool and brown dwarfs have low flux in the BP bandpass, they are very sensitive to any background overestimation yielding a high phot_bp_rp_excess_factor. As a consequence, most of these objects are rejected, as can be clearly seen at the low-mass end of the main sequence. As an illustration, applying this fil-ter on the previously known sample dramatically removes 47% of the objects (68% of the L and T dwarfs) that were found in GaiaDR2 (1067 ultra-cool and only 160 L dwarfs remain).
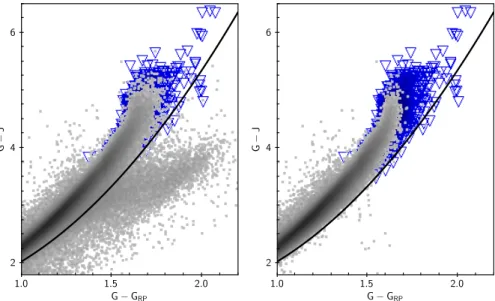
It is thus necessary to define a more suitable criterion to retain these faint and red objects that does not rest upon the BP flux. The effect of color excess is also clearly visible in the G − J
vs. G − GRPplane (Fig.6, left panel). We define a new empirical
limit, shown by the curve in the plot:
G − J= 1.42 × (G − GRP)2− 0.94 × (G − GRP)+ 1.55.
We note that the J magnitude rejects ∼20% of the candidates with no 2MASS counterpart or a 2MASS photometric qual-ity flag Qfl , AAA. Removing objects below this limit allows excluding objects with spurious colors, but the low-mass objects can still be retained, as well as most of the previously known sample. This is in contrast to the cut using the color excess fac-tor (Fig.6, right panel). The resulting HR diagram is shown in the right panel of Fig.5.
As the rejection of objects is based on a hard and empirical cutoff, we expect our sample to be contaminated, in particular for G − GRP . 1.6 (see left panel of Fig.6). About 12% of our
sample with G − GRP . 1.6 indeed have a color-excess factor
above the limit defined byEvans et al.(2018). This is much less an issue for L candidates (G − GRP& 1.6).
3.3. Selecting ultra-cool and brown dwarf candidates
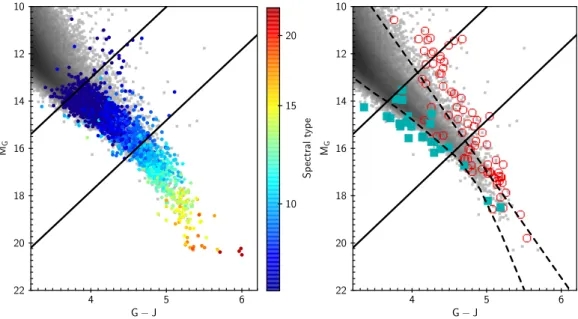
Figure7focuses on the Gaia DR2 HR diagram at the low-mass end, superimposed with the sample of spectroscopically con-firmed ultra-cool and brown dwarfs found in Gaia DR2.
We used the information on the spectral type to define sep-arations in the HR diagram. They are shown by solid lines and suggest that Gaia DR2 contains 14 176 M7–L0 candidates and 488 L candidates, all of them earlier than L5. These indica-tive numbers exclude previously known objects in common that remained after we applied the filters described in the previous section (870 M7–L0 and 223 L dwarfs).
Because the very end on the main sequence is less affected by the color excess problem, we also selected L candidates from the MG vs. G − GRP diagram. The selection was defined from
the locus of the spectroscopically confirmed sample (MG >
17.5 − (G − GRP), and 1.55 < GRP < 1.85). It allowed us
to retrieve robust candidates that do not depart from the main sequence. These 251 additional candidates would have been
0 1 2 G ¡ GRP 0 10 20 MG 0 1 2 G ¡ GRP 0 10 20 MG 0 1 2 G ¡ GRP 0 10 20 MG
Fig. 5.HR diagram of Gaia DR2. Left panel: 4 705 366 stars, after filtering, and in low-extinction Galactic regions. Middle panel: 4 640 635 stars,
after removing stars with an RP/BP flux excess followingEvans et al.(2018). Right panel: 3 716 407 stars with the 2MASS photometric quality
flag Qfl= AAA, and after removing stars showing color excess using G − J (see text).
1:0 1:5 2:0 G ¡ GRP 2 4 6 G ¡ J 1:0 1:5 2:0 G ¡ GRP 2 4 6 G ¡ J
Fig. 6.G−Jvs. G−GRPdiagram at the low-mass
end. The open triangles show previously known
objects found in Gaia DR2 (see Sect. 2). The
dots show the filtered Gaia DR2 catalog with a 2MASS counterpart and a 2MASS
photomet-ric quality flag Qfl= AAA, before (left panel),
and after (right panel) removing objects with an
RP/BP flux excess followingEvans et al.(2018).
The curve shows the empirical limit we used to filter objects with spurious colors.
excluded based on lack of J magnitude (or a bad 2MASS photo-metric quality flag Qfl).
We also used the peculiarities of the known sample to tenta-tively define regions where subdwarfs and young candidates are expected to be dominant. We used the G − J color index as it better separates these types (right panel in Fig.7, also visible in the right panel of Fig.3), probably because of the larger wave-length extent between the G and J bands. There are 233 (≥M7) and 70 (L) new promising young candidates and 466 (≥M7) and 17 (L) subdwarf candidates. The candidates are listed in a table published at the CDS. A small part is shown in Table2.
3.4. Comparison with models
Evolutionary and atmosphere models of ultra-cool and brown dwarfs have been developed for a long time (see, e.g., the 20-year old review from Burrows et al. 1998) and are successful today in reproducing color–magnitude diagrams in many pho-tometric systems.
However, the strong added value of Gaia data in testing these models, that is, the precise parallax, will help refine these models. Here we show a preliminary comparison of our candi-dates with the new evolutionary models reported byBaraffe et al. (2015) that consistently couple interior structure calculations with the BT-Settl atmosphere models (Allard et al. 2013).
Figure8shows the HR diagram of our candidates superim-posed on these evolutionary models. They tend to confirm the locus of the objects as a function of the peculiarities we dis-cussed in the previous section. It also shows that our selection does not favor young candidates, as can be seen also in the right panel of Fig.7.
3.5. Completing the census
Figure9 shows the sky distribution of previously known (top) and new candidates (bottom). The new candidates cover the whole sky, including the Galactic plane, where we can expect more discoveries of hidden dwarfs, such as the newly
char-A&A 619, L8 (2018) 4 5 6 G ¡ J 10 12 14 16 18 20 22 MG 10 15 20 S p ec tr al ty p e 4 5 6 G ¡ J 10 12 14 16 18 20 22 MG
Fig. 7.MGvs. G − J diagram of the filtered Gaia DR2 catalog (gray dots) at the low-mass end, superimposed on the known spectroscopic sample.
Left panel: color-code gives the spectral type (10 stands for L0 and 20 for T0) and allows defining three regions, separated by the solid lines, from
top to bottom:.M7, ∼M7 to L0, and &L0. Right panel: squares represent the known subdwarfs, and open circles show the young candidates. The
dashed lines aim to separate these different types.
Table 2. Characteristics of the ultra-cool and brown dwarf candidates found in Gaia DR2.
DR2 source ID α δ Parallax µα µδ G G − GRP VT SpT Peculiarity
mas mas yr−1 mas yr−1 km s−1
741002118375424 47.455 2.223 10.192 −52.550 −120.279 19.648 1.554 61.046 M7.5 1577597323028864 43.690 2.836 7.061 −42.770 −52.972 19.393 1.482 45.702 M7.0 2038460198792704 44.559 3.795 10.712 33.802 27.336 19.009 1.468 19.237 M7.0 2781562554898432 47.779 4.293 23.509 399.310 −34.376 18.561 1.596 80.810 M8.0 3036954195695616 49.836 4.733 18.310 75.223 −75.181 18.453 1.559 27.532 M7.5 3447449989685760 46.704 4.426 9.889 −12.907 −52.790 20.289 1.578 26.050 M8.0 5797037618821888 41.487 4.533 11.794 90.101 −96.024 19.145 1.588 52.921 M7.5 6033570057616896 40.247 5.165 7.469 38.655 −28.239 19.817 1.675 30.381 M7.0 6078688688994048 40.837 5.131 15.053 337.776 −36.942 18.198 1.485 106.995 M7.0 6156543561459584 40.374 5.613 9.231 40.170 3.470 18.874 1.497 20.704 M7.0 6313262622741504 42.279 5.720 11.231 158.451 −51.802 18.429 1.477 70.357 M7.0 6668160065596928 42.433 6.508 10.274 −63.768 −59.994 18.890 1.483 40.394 M7.0 7033094847307136 45.649 6.409 8.880 37.677 −43.789 19.593 1.471 30.834 M7.0 Subdwarf 8052342126139392 44.378 7.053 13.937 66.670 −62.054 20.122 1.648 30.976 M9.0 8777268181161216 44.872 8.471 25.662 158.484 13.082 16.794 1.452 29.373 M7.0 9475659927993600 51.236 6.520 9.305 50.899 −27.089 18.865 1.509 29.371 M7.0 9790158907981952 52.557 7.060 8.240 73.355 −14.970 19.373 1.460 43.068 M7.0 9851005710350592 52.683 7.727 9.143 21.240 −33.522 19.173 1.490 20.573 M7.0 10358086728974848 49.722 7.165 13.882 53.955 −52.929 18.110 1.457 25.808 M7.0 12880641280670976 51.821 10.057 12.777 55.051 −38.696 19.631 1.557 24.963 M8.0 Young 15647768450759296 47.629 11.203 22.431 110.190 −371.818 17.788 1.522 81.947 M7.5 16744020197785216 51.278 12.472 10.185 74.968 −7.001 19.201 1.573 35.042 M7.0 17275870293313024 48.488 12.065 11.908 63.823 −187.191 18.668 1.492 78.721 M7.0 17315212193436672 49.131 12.133 13.993 56.529 6.926 18.244 1.494 19.292 M7.0 18771343546171008 41.647 7.080 11.915 88.864 −14.731 18.611 1.495 35.833 M7.0 19314472225770368 38.677 7.087 10.064 −82.286 −68.344 18.734 1.470 50.379 M7.0 19350511296260224 38.990 7.412 6.656 −34.833 −20.406 19.357 1.463 28.747 M7.0 19485927320169472 37.682 7.298 10.811 20.122 −14.774 18.669 1.549 10.945 M7.0 19499701279778432 36.956 7.118 17.641 94.693 164.794 18.328 1.551 51.069 M7.5 19697033552145920 38.025 8.207 23.744 171.769 11.269 17.729 1.524 34.364 M7.5
Notes. The full table is available at the CDS. SpT is the photometric spectral type computed from the MGvs. spectral type relation defined in
Sect.2.
1:4 1:6 1:8 G ¡ GRP 10 15 20 MG ¡2 ¡1 0 1 lo g1 0 (a ge ) 4 5 G ¡ J 10 15 20 MG ¡2 ¡1 0 1 lo g 10 (a ge )
Fig. 8.BT-Settl evolution tracks from right to left: 0.02, 0.04, 0.06, and 0.08 M at [M/H]= 0, and 0.083 M at [M/H]= −1. The color bar gives
the logarithm of the age in Gyr. The gray dots show the Gaia DR2 candidates.
Fig. 9.Sky distribution in equatorial coordinates of previously known
ultra-cool dwarfs with a counterpart in Gaia DR2 (top panel), and of the additional candidates found in the filtered Gaia DR2 data (bottom panel). The dots are ≥M7, the blue open circles are L-dwarfs, and the red squares are T -dwarfs.
acterized L-dwarf WISE J192512.78+070038.8 (Scholz & Bell 2018;Faherty et al. 2018). The imprint of the Gaia scanning law is visible in the plot, where no candidates are found in some Galactic regions, which are rejected as they do not fulfill our con-dition visibility_periods_used > 8. Thus new candidates are expected to be found in the forthcoming Gaia data releases.
Figure 10 shows the distance distribution of previously known and additional Gaia DR2 candidates for L and ≥ M7 dwarfs. While several recent efforts (seeBest et al. 2018a) have
been made to complete the volume-limited sample of brown dwarfs up to 25 pc, Gaia shows that the census is still not complete. The situation is even worse for ≥M7 dwarfs, which is not surprising since we here only considered objects with spectroscopic confirmation. The ongoing and future spectro-scopic large survey such as APOGEE (Majewski et al. 2017), LAMOST (Cui et al. 2012), WEAVE (Dalton et al. 2014), and 4MOST (de Jong et al. 2016) will soon complete the characteri-zation of the census of sources that lie farther away.
4. Conclusion
Smart et al.(2017) estimated the Gaia magnitude from J mag-nitude and spectral type of spectroscopically confirmed objects and found that 1010 L and 58 T are brighter than Gest= 21.5, and
543 L and 10 T are brighter than Gest= 20.3.Sarro et al.(2013)
predicted similar numbers using a more theoretical approach. Gaia DR2 contains very many objects of the spectroscop-ically confirmed sample: 3050 ultra-cool (≥M7), 647 L, and 16 T dwarfs. This corresponds to 61% and 74% objects with Gest≥ 21.5 and Gest= ≥20.3, respectively. However, Gaia DR2
is an intermediate release, on which strong filters were applied. Further releases will most probably continue to fill the gap.
There are numerous ultra-cool (∼14 200) and mainly early L (739) candidates in Gaia DR2. We stress that these numbers are lower limits because of the successive cuts we made to the origi-nal Gaia DR2. In particular, we used the J magnitude to remove objects with a spurious color excess, and ∼20% of the objects were rejected during the cross-identification with 2MASS. The high precision of the HR diagram allows us to give an indication of some of the characteristics of the object, for instance, whether it is young or a subdwarf. This rough classification was made to guide the target selection for follow-up, depending on the scien-tific case that is to be studied.
The given numbers are of course indicative, but they also prove that the census is not complete yet, even locally. Although we call them new candidates, some may be part of the significant number of ultra-cool and brown dwarf candidates found in large-scale surveys that have been classified from photometry (e.g., Folkes et al. 2012;Smith et al. 2014,2018;Schmidt et al. 2015;
A&A 619, L8 (2018) 0 50 100 Distance (pc) 0 20 40 60 0 100 200 Distance (pc) 0 500 1000 1500 2000
Fig. 10. Distance distribution of the L (left
panel) and ≥M7–L0 (right panel) dwarfs for the known sample (black line) and the additional candidates found in the filtered Gaia DR2 data (filled gray).
Skrzypek et al. 2016; Theissen et al. 2017; Best et al. 2018b). We cross-matched these studies and found that 1800 ≥ M7 and 108 L dwarfs are indeed part of them. Still, the numerous candi-dates we found are most valuable for follow-up since they benefit from the reliable Gaia observations, including precise parallax and proper motion.
Further exploitation of this dataset will be useful for com-pleting the census of late-M and at least early-type brown dwarfs, refining their luminosity function, testing stellar and sub-stellar models, and probing the old population in the Galaxy through the few hundred subdwarf candidates. The contamina-tion and completeness of the sample is not easy to address, in particular because of the BP and RP flux measurements, which are contaminates by the background flux. The cyclic nature of the treatment of Gaia offers the promise of a increased quality and a larger quantity of data at each release. In any case, the high precision of Gaia and the numerous candidates it provides with full 5D (astrometry and photometry) data offers a great wealth of information at the low-mass end of the HR diagram. This homo-geneous and precise catalog is a worthwhile target to be further characterized with spectroscopic observations, and most likely has surprises in store for us6,7.
Acknowledgements. The author thanks the referee for fruitful comments. This work has made use of data from the European Space Agency (ESA) mission Gaia (https://www.cosmos.esa.int/gaia), processed by the Gaia Data Pro-cessing and Analysis Consortium (DPAC,https://www.cosmos.esa.int/ web/gaia/dpac/consortium). Funding for the DPAC has been provided by national institutions, in particular the institutions participating in the Gaia Mul-tilateral Agreement. This research has made use of the VizieR catalogue access tool, CDS, Strasbourg, France. The original description of the VizieR service was published inOchsenbein et al.(2000). This research has made use of the SIM-BAD database, operated at CDS, Strasbourg, France. The author made queries at CDS using Virtual Observatory with python (Paletou & Zolotukhin 2014). All figures have been generated using the TOPCAT tool (Taylor et al. 2005). Data fitting was performed using Gnuplot.
References
Allard, F., Homeier, D., & Freytag, B. 2013,Mem. Soc. Astron. It., 84, 1053
Arenou, F., Luri, X., Babusiaux, C., et al. 2018,A&A, 616, A17
Artigau, É, Lafrenière, D., & Doyon, R. 2009,AIP Conf. Ser., 1094, 493
Baraffe, I., Homeier, D., Allard, F., & Chabrier, G. 2015,A&A, 577, A42
6 http://www.starlink.ac.uk/topcat/
7 http://www.gnuplot.info/
Best, W. M. J., Liu, M. C., Magnier, E., & Dupuy, T. 2018a,AAS Meeting Abstracts, 231, 349.19
Best, W. M. J., Magnier, E. A., Liu, M. C., et al. 2018b,ApJS, 234, 1
Bochanski, J. J., Hawley, S. L., Covey, K. R., et al. 2010,AJ, 139, 2679
Burrows, A., Sudarsky, D., & Sharp, C. 1998,ASP Conf. Ser., 134, 354
Capitanio, L., Lallement, R., Vergely, J. L., Elyajouri, M., & Monreal-Ibero, A. 2017,A&A, 606, A65
Cui, X.-Q., Zhao, Y.-H., Chu, Y.-Q., et al. 2012,Res. Astron. Astrophys., 12, 1197
Dalton, G., Trager, S., Abrams, D. C., et al. 2014,Proc. SPIE, 9147, 91470L
de Jong, R. S., Barden, S. C., Bellido-Tirado, O., et al. 2016,Proc. SPIE, 9908, 99081O
Dupuy, T. J., & Liu, M. C. 2012,ApJS, 201, 19
Eisenstein, D. J., Weinberg, D. H., Agol, E., et al. 2011,AJ, 142, 72
Evans, D. W., Riello, M., De Angeli, F., et al. 2018,A&A, 616, A4
Faherty, J. K., Riedel, A. R., Cruz, K. L., et al. 2016,ApJS, 225, 10
Faherty, J. K., Gagne, J., & Burgasser, A. J. 2018, ApJL, submitted [arXiv:1805.01573]
Folkes, S. L., Pinfield, D. J., Jones, H. R. A., et al. 2012,MNRAS, 427, 3280
Gaia Collaboration (Brown, A. G. A., et al.) 2016a,A&A, 595, A2
Gaia Collaboration (Prusti, T., et al.) 2016b,A&A, 595, A1
Gaia Collaboration (Babusiaux, C., et al.) 2018a,A&A, 616, A10
Gaia Collaboration (Brown, A. G. A., et al.) 2018b,A&A, 616, A1
Kirkpatrick, J. D., Henry, T. J., & Irwin, M. J. 1997,AJ, 113, 1421
Lindegren, L., Hernández, J., Bombrun, A., et al. 2018,A&A, 616, A2
Luri, X., Brown, A. G. A., Sarro, L. M., et al. 2018,A&A, 616, A9
Mace, G. N. 2014, PhD thesis, University of California, Los Angeles, USA Majewski, S. R., Schiavon, R. P., Frinchaboy, P. M., et al. 2017,AJ, 154, 94
Marocco, F., Jones, H. R. A., Day-Jones, A. C., et al. 2015,MNRAS, 449, 3651
Marrese, P. M., Marinoni, S., Fabrizio, M., & Giuffrida, G. 2017,A&A, 607, A105
Ochsenbein, F., Bauer, P., & Marcout, J. 2000,A&AS, 143, 23
Paletou, F., & Zolotukhin, I. 2014, ArXiv e-prints [arXiv:1408.7026] Rajpurohit, A. S., Reylé, C., Allard, F., et al. 2013,A&A, 556, A15
Rajpurohit, A. S., Reylé, C., Allard, F., et al. 2014,A&A, 564, A90
Reid, I. N., & Gizis, J. E. 1997,AJ, 114, 1992
Riello, M., De Angeli, F., Evans, D. W., et al. 2018,A&A, 616, A3
Robert, J., Gagné, J., Artigau, É., et al. 2016,ApJ, 830, 144
Salgado, J., González-Núñez, J., & Gutiérrez-Sánchez, R. 2018, Gaia DR2 Documentation Chapter 13: Construction of the Archive, Tech. Rep.
Sarro, L. M., Berihuete, A., Carrión, C., et al. 2013,A&A, 550, A44
Schmidt, S. J., Hawley, S. L., West, A. A., et al. 2015,AJ, 149, 158
Scholz, R.-D., & Bell, C. P. M. 2018,Res. Notes Am. Astron. Soc., 2, 33
Skrutskie, M. F., Cutri, R. M., Stiening, R., et al. 2006,AJ, 131, 1163
Skrzypek, N., Warren, S. J., & Faherty, J. K. 2016,A&A, 589, A49
Smart, R. L., Marocco, F., Caballero, J. A., et al. 2017,MNRAS, 469, 401
Smith, L., Lucas, P. W., Bunce, R., et al. 2014,MNRAS, 443, 2327
Smith, L. C., Lucas, P. W., Kurtev, R., et al. 2018,MNRAS, 474, 1826
Taylor, M. B. 2005,ASP Conf. Ser., 347, 29
Theissen, C. A., West, A. A., Shippee, G., Burgasser, A. J., & Schmidt, S. J. 2017,AJ, 153, 92
Wenger, M., Ochsenbein, F., Egret, D., et al. 2000,A&AS, 143, 9
Zhang, Z. H., Gálvez-Ortiz, M. C., Pinfield, D. J., et al. 2018,MNRAS, 480, 5447

![Fig. 8. BT-Settl evolution tracks from right to left: 0.02, 0.04, 0.06, and 0.08 M at [M/H] = 0, and 0.083 M at [M/H] = −1](https://thumb-eu.123doks.com/thumbv2/123doknet/14773929.592692/8.892.156.742.126.441/fig-bt-settl-evolution-tracks-right-left-m.webp)

