VISIBLE SPECTROSCOPY OF TERRESTRIAL EXOPLANETS WITH SEE-COAST
A.-L. Maire
1, R. Galicher
2, A. Boccaletti
1, J. Schneider
2, P. Baudoz
1and the SEE-COAST team
Abstract. While more than 450 exoplanets have been discovered, mid-infrared photometry and near-infrared (NIR) low-resolution spectroscopy were obtained for a few transiting gazeous planets. Nevertheless, the transit method is limited to close-in planets (.0.1 AU). To study the chemical composition and structure of the atmosphere of wide-separated planets (&1 AU), direct imaging is requested. To date, 12 planet candidates were detected by this method. In a near future (2011-2014), ground-based instruments (SPHERE, GPI, HiCIAO) and the James Webb Space Telescope (JWST) will survey a large sample of gazeous planets around young and M-dwarf stars in the solar neighborhood. To characterize terrestrial planets, extremely good and stable conditions as in space are required. Our team propose the SEE-COAST mission, a 1.5-m space telescope, that aims at visible spectro-polarimetry of mature giant and massive terrestrial planets. Here we briefly recall the principle of this mission and its objectives. We detailed the image analysis used to retrieve the planet spectra and we present the performance of SEE-COAST obtained by numerical simulations.
Keywords: exoplanets, high contrast imaging, coronagraph, imaging spectroscopy, numerical simulations
1 Exoplanet characterization
The exoplanet research passed from a detection stage to a characterization one with photometric and spectro-scopic measurements of the atmosphere of transiting giant planets (see e.g. Swain et al. 2009; Tinetti et al. 2010). However, the transit method is more appropriated to close-in exoplanets (.0.1 AU). The other method to investigate the physical properties of exoplanets is direct imaging which is complementary to transits by studying the diversity of planet separations beyond 1 AU. This provides observational constraints to theoretical mechanisms of planetary formation. Nevertheless, this technique is difficult to carry out because it necessitates both high contrast and high angular resolution. The 12 planet candidates already detected have physical char-acteristics favorable to direct imaging like a large separation from the host star (>8 AU), a large mass (>1 MJup) and a young age (<300 Myr).
Planet finder instruments (2011) like SPHERE (Beuzit et al. 2006) on the Very Large Telescope, GPI (Macintosh et al. 2006) on the Gemini telescope and HiCIAO (Tamura et al. 2006) on the Subaru telescope, and the JWST (2014) will analyze a large sample of young giant planets down to the Jupiter mass in the NIR. Extremely large telescopes (∼2020) are expected to extend this sample towards less massive and mature planets ideally down to super-Earths (terrestrial planets with a mass up to 10 MEarth). However, ground-based
instruments will probably be unable to characterize telluric planets due to the limitations of adaptive optics in terms of long-time performance and stability, the day/night cycle and most of all the atmospheric absorption. Ambitious space projects like Darwin and Terrestrial Planet Finder concepts will be devoted to this objective but they are technically difficult and planned for the long-term (>2030). It is now mostly admitted that mid-term (2020−2022) precursory missions are required to prepare these missions. They will also be complementary to extremely large telescopes and other mid- and long-term planned instruments by addressing different science cases.
1 Observatoire de Paris, LESIA, CNRS UMR 8109, 92195 Meudon, France 2 Observatoire de Paris, LUTh, CNRS UMR 8102, 92195 Meudon, France
c
2 The SEE-COAST mission
In the context detailed in the previous section, our team propose a 1.5-m coronagraphic space telescope named SEE-COAST (Super-Earth Explorer - Coronagraphic Off-Axis Space Telescope). For further informations on the scientific objectives and instrumental concept, the reader is referred to the following papers: Schneider et al. (2006); Boccaletti et al. (2008); Schneider et al. (2009). Here we briefly recall the main characteristics of this mission. It aims at visible spectroscopy and polarimetry of a sample of giant and massive terrestrial exoplanets previously discovered by NIR direct imaging (SPHERE/GPI/HiCIAO), radial velocities or astrometry. The scientific motivation is twofold. First, the flux reflected (visible light) by a planet gives informations on the chemical composition of its atmosphere. It also depends on its radius, albedo and phase angle. With theoretical mass-radius relations, we can deduce the albedo which brings informations about the planet surface type. Then, the measurement of the degree of polarization of the reflected light completes the spectral data by providing informations on the physics of atmospheres (clouds, hazes and so on) and the existence of oceans at the surface (Stam 2008). SEE-COAST was proposed as a M-class mission to the first ESA Cosmic Vision call for proposals in 2007 but it was not selected. We will submit a slightly evolved project called SPICES (Spectro-Polarimetric Imaging and Characterization of Exoplanetary Systems) to the new call in december 2010.
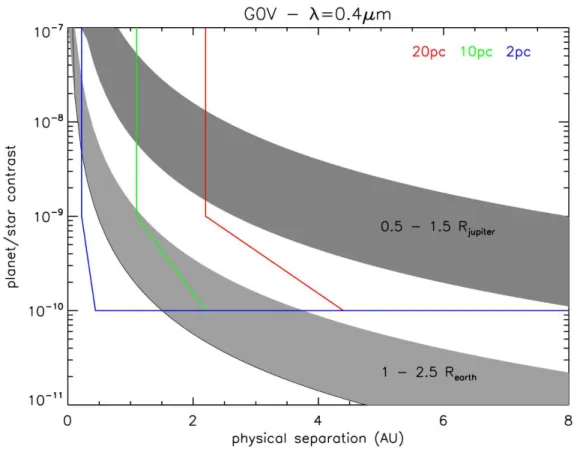
Fig. 1 explains how to derive the SEE-COAST contrast and angular resolution requirements from its planet targets. It represents the planet/star contrast in reflected light for giant and telluric planets orbiting a G0V star at 0.4 µm. The blue, green and red vertical lines represent the contrast curves for a 1.5-m coronagraphic telescope characterized by a 2-λ/D inner working angle and a 10−10-contrast for a star distance of 2, 10 and 20 pc. SEE-COAST must achieve a contrast of about 10−10and have a diameter at least equal to 1.5 m to analyze
massive telluric planets until ∼15 pc.
Fig. 1. SEE-COAST instrumental requirements derived from its planet targets.
2.1 Numerical simulations
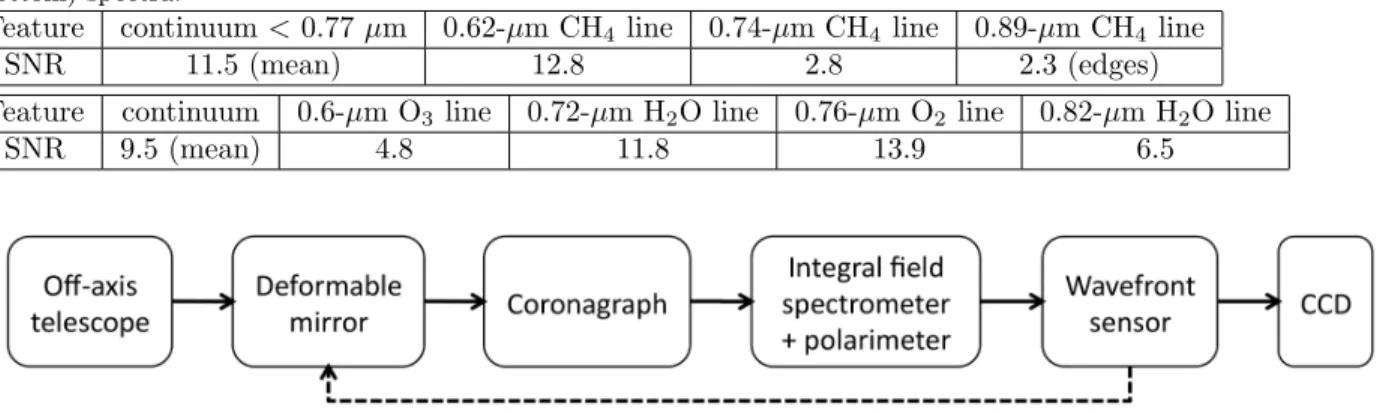
Fig. 2 is a block diagram of the SEE-COAST instrumental baseline. It comprises an off-axis telescope, a coronagraph to attenuate the starlight, a deformable mirror (DM) and an integral field spectrometer (IFS)
associated to a polarimeter. We use an off-axis telescope because the attenuation power of a coronagraph is degraded by a mirror obscuration. The coronagraph performance is also sensitive to the wavefront aberrations upstream it. In space, they are due to imperfections in the optical components which induce a “quasi-static” speckle field (Baudoz et al. 2006). We use a DM to correct for the mirror aberrations to avoid very stringent polishing constraints on it (<5 nm rms; for comparison the value for the HST is 20 nm rms but we aim to reach a slightly lower value for SEE-COAST). However, the DM correction is not perfect (finite number of actuators) and image analysis is required to remove the non-corrected speckles to detect faint planets. We use two techniques. At small separations (.10 λ/D), the self-coherent camera (SCC) distinguishes planets from speckles using the incoherence of the starlight with the planet light (Baudoz et al. 2006). The spectral deconvolution (SD) technique discriminates them because the speckle distance from the image center varies with the observation wavelength whereas the planet one does not (Sparks & Ford 2002). This technique is efficient for planet separations &10 λ/D.
We chose a peculiar instrumental configuration for this paper. The main characteristics are a 1.5-m primary mirror, no central obscuration, 20-nm rms phase aberrations, no amplitude aberrations, a 32x32 DM, an achro-matic four-quadrant phase mask coronagraph (Rouan et al. 2000) and a 30-channel IFS covering the 0.5−0.95 µm spectral bandwidth (spectral resolution of ∼49). We currently carry out simulations to refine the design for the ESA proposal in next december but it will not differ a lot from the current one.
2.2 First results
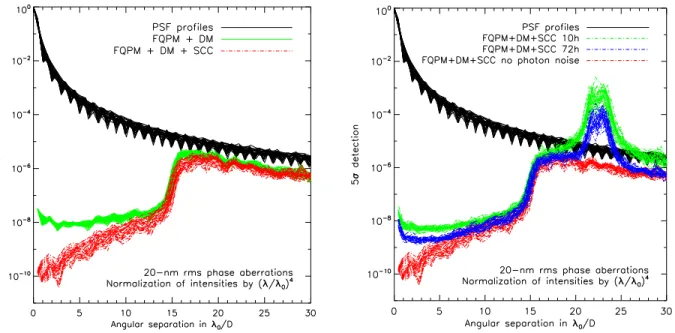
The left panel of Fig. 3 shows the SEE-COAST performance without photon noise before and after speckle calibration by the SCC. The calibration efficiency decreases with the angular separation because of the channel chromaticity (Baudoz et al. 2006). Then we study the impact of photon noise assuming that the observed source is a 10-pc G2V star, the global instrument transmission is 15% and the sole noise sources are speckle and photon noises. The right panel of Fig. 3 presents the performance after speckle calibration for two exposure times. After 10 hours, the profiles have achieved a contrast inferior to 10−8 between 1 and 7 λ/D but 72 hours are needed to reach a few 10−9-contrast in the same region. As the instrument is limited by the sole photon noise, longer exposures enable to reach very high contrasts. This point will however limit SEE-COAST to the study of nearby systems (.25 pc).
To confirm the conclusions drawn from the 5-σ detection radial profiles, we introduced spectra of a Jupiter-like planet and a super-Earth orbiting a G2V star and calculated the signal-to-noise ratio (SNR) of the continuum and the spectral lines obtained with the SEE-COAST concept. The left panel of Fig. 4 shows the spectrum of a Jupiter-like planet at 2 AU at a 10-pc distance after 72 hours (model from Burrows et al. 2004). The right panel of Fig. 4 represents the spectrum of a super-Earth at 1 AU at a distance of 6 pc after 100 hours (model from Stam 2008). Note that the y-axis scale is different between the two plots. Table 1 gives the SNR of the main features of the Jupiter (top) and the super-Earth (bottom) spectra. For the Jupiter, we correctly measure the continuum <0.77 µm and the methane spectral line at 0.62 µm but not the other methane features. For the super-Earth, the continuum and the spectral lines of water at 0.72 µm and dioxygen at 0.76 µm are well retrieved but the SNR values for the 0.6-µm ozone line and the 0.82-µm water line are moderate.
Table 1. SNR for the continuum and the major spectral lines of the Jupiter-like planet (top) and the super-Earth (bottom) spectra.
Feature continuum < 0.77 µm 0.62-µm CH4 line 0.74-µm CH4 line 0.89-µm CH4line
SNR 11.5 (mean) 12.8 2.8 2.3 (edges)
Feature continuum 0.6-µm O3 line 0.72-µm H2O line 0.76-µm O2 line 0.82-µm H2O line
SNR 9.5 (mean) 4.8 11.8 13.9 6.5
Fig. 3. 5-σ detection radial profiles of the SEE-COAST concept obtained before and after SCC speckle calibration without photon noise (left) and after SCC speckle calibration for two levels of photon noise and without photon noise (right). 4 CH H 0 2 0 3 0 2 H 0 2
Fig. 4. Spectra of a Jupiter-like planet (left) and a super-Earth (right) measured by SEE-COAST.
3 Conclusions
The objective of the SEE-COAST spacecraft (now renamed SPICES) is the visible spectro-polarimetric char-acterization of Jupiter-like planets down to super-Earths. It will be complementary to future projects of NIR direct imaging and transit spectroscopy by dealing with different science cases. It will also be a precursor to ambitious Terrestrial Planet Finder concepts. In this paper, we presented the performance of a peculiar instru-mental configuration without and with photon noise. Speckle noise is calibrated at a contrast level of about 10−10 very close to the star image (∼2 λ/D). The instrument is limited by the sole photon noise and will be
able to characterize only nearby targets (.25 pc). Then, we compared spectra of a Jupiter-like planet and a super-Earth retrieved by SEE-COAST with the theoretical ones: the continuum and the spectral features above a contrast of 10−9 are correctly measured in 3-4 days. Currently, we are refining the instrumental configuration for the next ESA proposal. We account for other types of aberrations (Fresnel propagation and amplitude aberrations) and other noise sources. Then, we will study the retrieval of planet spectra for different kinds of planets and stars both in spectroscopy and polarimetry.
References
Baudoz, P., Boccaletti, A., Baudrand, J., & Rouan, D. 2006, in IAU Colloq. 200: Direct Imaging of Exoplanets: Science & Techniques
Beuzit, J.-L., Feldt, M., Dohlen, K., et al. 2006, The Messenger, 125, 29
Boccaletti, A., Schneider, J., Tinetti, G., et al. 2008, in SF2A-2008, ed. C. Charbonnel, F. Combes, & R. Samadi, 61 Burrows, A., Sudarsky, D., & Hubeny, I. 2004, ApJ, 609, 407
Macintosh, B., Graham, J., Palmer, D., et al. 2006, in SPIE Conf. Series, Vol. 6272, 62720L Rouan, D., Riaud, P., Boccaletti, A., Cl´enet, Y., & Labeyrie, A. 2000, PASP, 112, 1479 Schneider, J., Boccaletti, A., Mawet, D., et al. 2009, Exp. Astron., 23, 357
Schneider, J., Riaud, P., Tinetti, G., et al. 2006, in SF2A-2006, ed. D. Barret, F. Casoli, G. Lagache, A. Lecavelier, & L. Pagani, 429
Sparks, W. B. & Ford, H. C. 2002, ApJ, 578, 543 Stam, D. M. 2008, A&A, 482, 989
Swain, M. R., Vasisht, G., Tinetti, G., et al. 2009, ApJL, 690, L114
Tamura, M., Hodapp, K., Takami, H., et al. 2006, in SPIE Conf. Series, Vol. 6269, 62690V Tinetti, G., Deroo, P., Swain, M. R., et al. 2010, ApJL, 712, L139