VALIDATION OF ENVISAT-1 LEVEL-2 PRODUCTS RELATED TO LOWER
ATMOSPHERE O3 AND NOY CHEMISTRY BY A FTIR QUASI-GLOBAL
NETWOR.
M. De Mazière (1), T. Coosemans (1), B. Barret (1), T. Blumenstock (2), A. Griesfeller (2), P. Demoulin (5), H. Fast (3), D. Griffith (4) , N. Jones (4), E. Mahieu (5), J. Mellqvist (6), R. L. Mittermeier (3), J. Notholt (11), C. Rinsland
(8)
, A. Schulz (7), D. Smale (9), A. Strandberg (6), R. Sussmann (10), S. Wood (9), M. Buchwitz (11) (1)
Belgian Institute for Space Aeronomy, Ringlaan 3, B-1180 Brussels, Belgium; Email: [email protected]; [email protected]
(2)
Forschungszentrum Karlsruhe, IMK, Germany
(3)
Meteorological Service of Canada
,
Downsview, Ontario, Canada(4)
University of Wollongong, New South Wales, Australia
(5)
Institut d'Astrophysique et de Géophysique, Liège., Belgium
(6)
Chalmers University of Technology, Radio & Space Science, Göteborg, Sweden
(7)
Alfred Wegener Institute for Polar and Marine Research (AWI) , Potsdam, Germany
(8)
NASA Langley Research Center, Hampton, VA, USA
(9)
National Institute for Water and Air Research (NIWA), New-Zealand
(10)
Forschungszentrum Karlsruhe, IFU, Germany
(11)
Institute of Environmental Physics, University of Bremen, FB1,Germany
ABSTRACT
A coordinated action involving eleven stations of the ground-based Network for Detection of Stratospheric Change (NDSC) equipped with Fourier transform infrared (FTIR) instruments was conducted to contribute to the validation of the three atmospheric chemistry instruments onboard ENVISAT, that are MIPAS, SCIAMACHY and GOMOS. The target products for validation are total columns of O3, CH4, CO and some important NOy species (NO2, HNO3,
NO) and the source gas N2O. Together the eleven stations cover the latitudes between 79 °N and 78°S, including
polar, mid -latitude and subtropical and tropical locations. The goal is to contribute to the assessment of the data quality of the aforementioned ENVISAT instruments, from a quasi-global perspective.
The period of intensive ground-based data collection for the benefit of the ENVISAT Validation Commissioning Phase that is dealt with in the present paper is July 15 to December 1, 2002. The FTIR network involved collected a data set corresponding to an equivalent of approximately 400 days of measurements; about three quarter of the data have already been submitted to the ENVISAT Calval database and are included in the present work.
Unfortunately, the distribution of ENVISAT data has been slow and limited. Only a limited number of coincidences has been found for making data inter-comparisons. Therefore, the conclusions drawn in this paper are very preliminary and cover only a limited set of data products from SCIAMACHY only.
Our findings up to now concerning the above mentioned target products are the following: (1) SCIAMACHY near infrared operational products (CO, CH4, N2O) have no scientific meaning yet, (2), the operational SCIAMACHY
total vertical O3 column product derived in the ultraviolet window has undergone some improvements with
changing versions of the processor(s) but it still underestimates the column by about 5 – 10 %, (3), the operational SCIAMACHY total vertical O3 column product derived in the visible window is unrealistically large, and (3), the
operational NO2 total column product from SCIAMACHY seems to largely overestimate the real column, but very
few coincidences and large dispersions of the data do inhibit any further conclusion at present.
In a next phase, the same ground-based correlative data set will be exploited to further validate the ENVISAT data as soon as more and reprocessed data will be distributed.
1 GROUND-BASED CORRELATIVE DA TA SET
1.1 FTIR Network
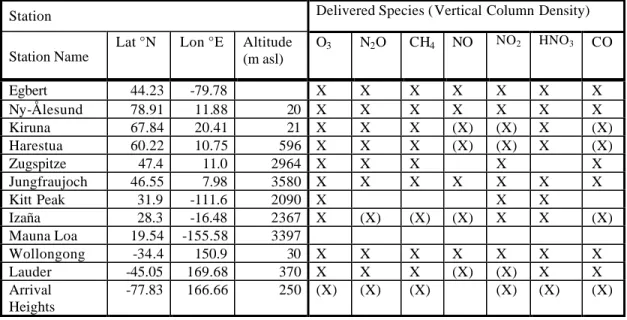
The present validation project is based on a network of eleven ground-based FTIR instruments that are all NDSC qualified. Fig. 1 and Table I show the distribution of stations in the FTIR network involved. One station, Mauna Loa, has not been able to really contribute, because of a defective instrument. Together, the stations span the latitude band from 79 °N to 78°S, including locations in the polar, mid-latitude and subtropical and tropical regions.
__________________________________________________________________________________________________________ Proc. of Envisat Validation Workshop, Frascati, Italy, 9 – 13 December 2002 (ESA SP-531, August 2003)
Fig. 1 Map of the FTIR network involved in the validation project.
Table I The coordinates and contributions of all FTIR stations participating to the validation project. No
measurements have been taken at Mauna Loa so far, because of a defective instrument. X indicates that data have been delivered; (X) between parentheses indicates that the data are available in the measurements but that they have not been retrieved/delivered yet.
Station Delivered Species (Vertical Column Density)
Station Name
Lat °N Lon °E Altitude (m asl) O3 N2O CH4 NO NO2 HNO3 CO Egbert 44.23 -79.78 X X X X X X X Ny-Ålesund 78.91 11.88 20 X X X X X X X Kiruna 67.84 20.41 21 X X X (X) (X) X (X) Harestua 60.22 10.75 596 X X X (X) (X) X (X) Zugspitze 47.4 11.0 2964 X X X X X Jungfraujoch 46.55 7.98 3580 X X X X X X X Kitt Peak 31.9 -111.6 2090 X X X Izaña 28.3 -16.48 2367 X (X) (X) (X) X X (X) Mauna Loa 19.54 -155.58 3397 Wollongong -34.4 150.9 30 X X X X X X X Lauder -45.05 169.68 370 X X X (X) (X) X X Arrival Heights -77.83 166.66 250 (X) (X) (X) (X) (X) (X)
1.2 FTIR Correlative Data Products
The correlative data products in this first version are total vertical column amounts of the target species. No instructions have been given to the various contributing teams regarding the data processing options. After some discussions, it was decided that every participant would process his data according to his best judgement.
Typical precisions of retrieved column data from a single measurement (i.e. without averaging of spectra) are in the order of some percent to 10%, depending on the target molecule and the characteristics of the site (altitude, humidity, etc.). Table II provides an example for the Jungfraujoch.
Arrival Heights Lauder Wollongong Izaña Jungfraujoch & Zugspitze Harestua Kiruna Ny Alesund Egbert Kitt Peak Mauna Loa
Table II Precision of column data retrieved from a single measurement at the Jungfraujoch.
O3 CO CH4 N2O NO2 HNO3 NO
3% - 5% 2 % – 4 % 2 % – 3 % 2 % – 3 % 6 % – 12 % 4 % – 6 % 4 % – 7 %
For next versions of the data submissions, data analyses may be refined and distinct tropospheric and stratospheric column amounts will be delivered. This distinction is important for exploit ing the ground-based data in the near future and also for the validation of the MIPAS and GOMOS data that are essentially stratospheric profiles. The integrated MIPAS and GOMOS profiles will then be compared with the stratospheric partial columns measured at the ground stations. For some molecules like NO2 and maybe O3, one might attempt to work with tropospheric
climatologies for adding a tropospheric content to the MIPAS and GOMOS integrated profiles, in order to allow comparisons with total column data from the ground.
A common spectroscopic database [A. Meier, private communication, 2002] has been distributed to all partners in the network: it may serve in the near future to eliminate possible biases between data from different stations originating in the use of different line parameters.
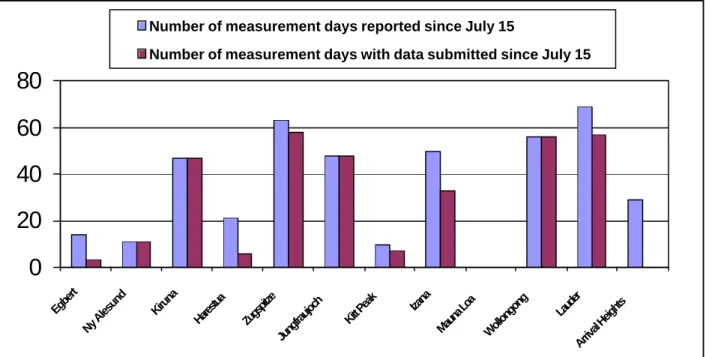
All stations, because of their NDSC affiliation, have a commitment towards NDSC to make regular measurements of a number of key stratospheric species. For the aim of the ENVISAT validation, they have intensified their measurement activities during the Commissioning Phase and they have attempted to deliver the data products, at least a preliminary version of them, with short time delays to the ENVISAT Calval Database, in the appropriate HDF format. The measurements are either solar either lunar absorption measurements, and thus can be performed only at clear sky conditions. Bad weather conditions during certain months at certain locations have limited the number of measurement days. Fig. 2 shows the amount of correlative data available. The whole data set corresponds to an equivalent of approximately 400 days of measurements. In some cases (about one fourth of the total), the processing has been slightly delayed and the data have not been submitted yet to the ENVISA T Calval databas e
0
20
40
60
80
Egbert Ny Alesund Kiruna Hare stua Zugs pitze Jungfraujoch Kitt Peak Izana Mau na L oa Wollongong Laud er Arrival HeightsNumber of measurement days reported since July 15
Number of measurement days with data submitted since July 15
Fig. 2 Histogram of data available now (‘submitted’, purple), and of data expected (‘reported’, blue), per station in
the network.
2 ENVISAT DATA SET
At present, the ENVISAT data with which comparisons have been made are operational SCIAMACHY NRT data products corresponding to the nadir observations, and the SCIAMACHY so-called ‘meteo’ data products. During the Commissioning Phase, the SCIAMACHY data processing has already evolved from version 3.51 to 4.00. Therefore the data and inter-comparisons have been distinguished as to the version number.
In addition some scientific CO and CH4 data products retrieved from the SCIAMACHY channel 8 (2265 - 2380
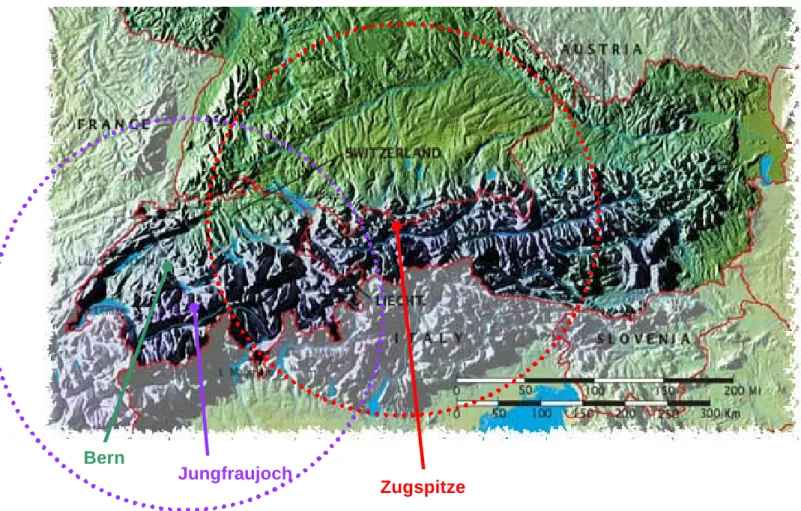
Because we dispose of only a limited number of SCIAMACHY data, that is effectively even more limited than it appears because one must distinguish between different version numbers, the coincidence criteria for inter-comparison have been kept relaxed. Fig. 3 illustrates the consequences of the spatial coincidence criterion that was defined as follows: the centre of the ground pixel should be within a 500 km distance from the ground station.
Especially over mountainous areas as the Alps the sampled air masses may be very different from one pixel to the other in their lowest part, and the so-called total columns do not encompass identical altitude ranges. Such different air masses will be discriminated as soon as more overpass data become available.
Fig. 3 Illustration of the criterion for spatial coincidence. The circles surrounding the stations have half the diameter
of the ones used at present to define an overpass.
Another parameter that cannot be accounted for at present is the possible presence of clouds, because this information is not yet provided with the SCIAMACHY data.
SCIAMACHY vertical column data for Ozone and NO2 taken at large solar zenith angle larger than 87° suffer from
wrong air mass factors (either they equal zero, either they become negative). Therefore those SCIAMACHY data have been eliminated from the inter-comparisons discussed hereinafter.
Bern
Jungfraujoch
3 INTERCOMPARISONS OF TOTAL OZONE DATA 3.1 Coincidence Criteria
Total ozone is a rather slowly varying parameter. The bulk of the ozone lies in the stratosphere below 25 km, and is dynamically controlled. Therefore we adopted as a criterion of temporal coincidence that data are taken within the same day.
3.2 Intercomparisons with SCIAMACHY DOAS_1 (Visible) Data
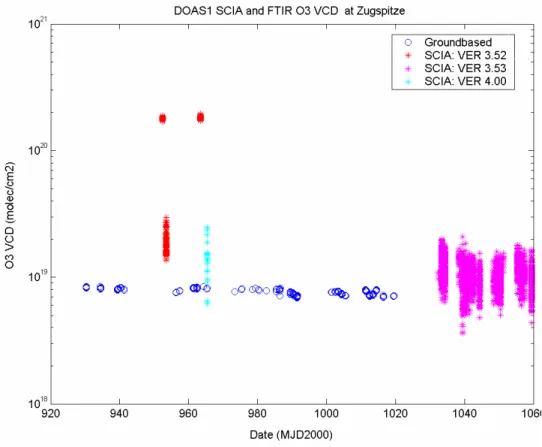
Total Ozone retrieved with the DOAS method in the visible window (425 - 450 nm) shows unrealistically high values, which in some cases are more than a factor 20 larger than the ground-based values. Nevertheless, it appears that the situation is improved for version 3.53; for version 4.0 it is still impossible to tell because not enough data have been delivered. One example of ozone vertical column density (VCD) measurements at Zugspitze is given in Fig. 4. The situation looks very similar at Kiruna.
Fig. 4 Ground-based FTIR and SCIAMACHY NRT nadir DOAS_1 data of total ozone above Zugspitze. The
SCIAMIACHY values are individual pixel measurements. The ground-based values are daily averages. Date convention is MJD2000: 1 January 2000, hour 0.00, equals date 0.
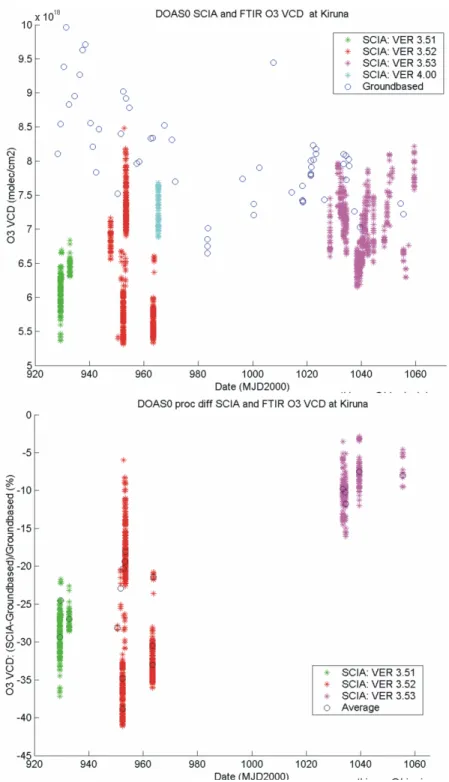
3.3 Intercomparisons with SCIAMACHY DOAS_0 (Ultraviolet) Data
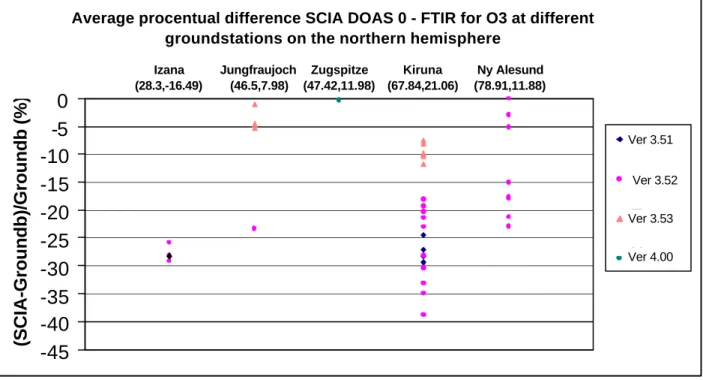
Total Ozone retrieved with the DOAS method in the ultraviolet window (325 - 335 nm) has been compared to the ground-based values at different locations. The initially large negative bias of the SCIAMACHY data of order -35% appears to have decreased to a bias of about -10% in the latest version 4.00. A typical example is provided by the data at Kiruna, in Fig. 5: one can see that the measured data on the ground and those collected with SCIAMACHY converge as the processor is updated. This can also be observed in Fig. 6 in which the average difference between ground and SCIAMACHY data is given in terms of percentage for different stations in the network. The improvement does not seem to be dependent on the latitude but solely on the processor upgrade version. For a more thorough evaluation of version 4.00 SCIAMACHY data, more coincident data are necessary.
Fig. 5 Ground-based FTIR and SCIAMACHY NRT nadir DOAS_0 data of total ozone above Kiruna. Upper plot:
individual data; lower plot: percentage differences between collocated data; individual coincident pixel data (asterisks) as well as the averages over all coincident pixels (open circles) on one day are displayed. Ground-based based data are daily averages.
Average procentual difference SCIA DOAS 0 - FTIR for O3 at different groundstations on the northern hemisphere
-45
-40
-35
-30
-25
-20
-15
-10
-5
0
(SCIA-Groundb)/Groundb (%)
Series
1
Series
2
Series
3
Series
Ver 3.52 Ver 3.53 Ver 3.51 Ver 4.00 Izana (28.3,-16.49) Jungfraujoch (46.5,7.98) Zugspitze (47.42,11.98) Kiruna (67.84,21.06) Ny Alesund (78.91,11.88)Fig. 6 The average relative difference (per overpass) DOAS 0-FTIR for different ground based stations does not
show a latitude dependence, but indicates the improvement of the processor updates.
The limited set of coincidences with ground-based FTIR observations data does not allow to draw more precise quantitative conclusions. Conclusions drawn from a larger data set including also a network of ground-based UV-Visible observations are presented in [1].
4 INTERCOMPARISONS OF TOTAL NITROGEN DIOXIDE DATA
4.1 Coincidence Criteria
NO2 has a strong diurnal variation that is very fast for solar zenith angles (SZA) larger than 85°. Except for polar
day conditions, NO2 increases slowly from morning to evening because of the photodissociation of N2O5 that forms
during night. We defined temporal coincidence as data taken within 2 hours from each other, with solar zenith angles smaller than 80°. Very few coincidences have been found, at the Jungfraujoch and at Zugspitze..
4.2 Intercomparisons with SCIAMACHY Operational DOAS_1 (Visible) Data
For the small number of coincidences at the northern mid -latitude stations of the Jungfraujoch and Zugspitze, total NO2 columns retrieved from the SCIAMACHY nadir observations with the DOAS method in the visible window
(425 - 450 nm) show discrepancies with respect to the ground-based FTIR observations of order 70 – 150 % - see Figure 7a and b .
Fig 7a
Fig. 7b
Fig. 7 Ground-based FTIR and SCIAMACHY NRT nadir DOAS_1 data of total NO2 above Jungfraujoch. Fig. 7a
plot: individual data; Fig. 7b : percentage differences between collocated data; individual coincident pixel data (asterisks) as well as the averages over all coincident pixels (open circles) on one day are displayed.
Nitrogen dioxide is not retrieved in the ultraviolet window.
5 INTERCOMPARISONS OF DATA FROM THE NEAR INFRARED CHANNELS (CO, CH4, N2O)
5.1 Intercomparisons with SCIAMACHY Operational BIAS Products
It appears that the level 2 BIAS products from the near infrared (NIR) channels 6 to 8 (1000 - 1750 nm, 1940 - 2040 nm, and 2265 - 2380 nm, resp.) suffer from erroneous calibrations that affect the level-1b data. At present, they are scientifically not useful, and comparisons with ground-based data are useless. Fig. 8 shows an example of CH4 total
column data retrieved from channel 8 in the BIAS_1 window (2269 – 2275 nm) along a complete orbit (orbit 3810) on Nov. 22, 2002. Expected values are of order 5 *1019 molec/cm2 as observed at the beginning. The values increase to more than 100 times what is expected.
Fig. 8. NRT CH4 total column data retrieved with t he BIAS method from SCIAMACHY nadir observations in the
BIAS_1 window in channel 8 as a function of time along the orbit.
5.2 Intercomparisons with SCIAMACHY Scientific WFM-DOAS Products
To get an idea of the capabilities of SCIAMACHY NIR nadir observations, alternative retrieval algorithms have been developed that include correction methods to deal with the calibration problems. We have used the available set of ground -based FTIR data to evaluate scientific data products obtained herewith.
At present, we have made some intercomparisons with CO and CH4 total columns data retrieved from
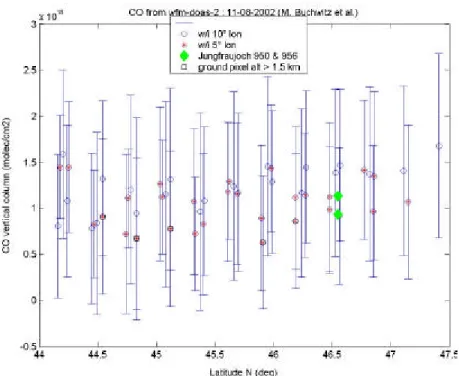
SCIAMACHY spectra in channel 8 with the so-called Weighting Function Modified DOAS (WFM-DOAS) algorithm developed at Bremen University [M. Buchwitz et al., private communication]. The SCIAMACHY data have been retrieved from orbits 2337 and 2338 on August 11, 2002 (day 953 MJD2000). Overpasses over Jungfraujoch and Zugspitze have been compared with ground-based data taken on days 950 and 956 (MJD2000) at Jungfraujoch, and on day 956 (MJD2000) at Zugspitze. ‘Overpass data’ have been selected within ± 2.5°, and ± 5° longitude respectively. Figure 9 shows the inter-comparison results.
Fig. 9 Comparison between CH4 (upper plot) and CO (lower plot) vertical column data retrieved from
SCIAMACHY channel 8 spectra with the WFM-DOAS method and ground-based FTIR observations at Jungfraujoch and Zugspitze. Open blue circles (including red asterisk) and associated error bars: SCIAMACHY data within ± 5° (± 2.5°) longitude from Jungfraujoch; green diamonds: daily mean FTIR column at Jungfraujoch on days 950 and 956; thick black squares: daily mean FTIR column at Zugspitze on day 956. SCIAMACHY symbols embedded in a black square indicate that the ground altitude of the pixel is higher than 1.5 km.
The SCIAMACHY error bars in Fig. 9 represent the goodness of fit: they are huge in case of CO because the CO absorptions is weak and thefit is presently dominated by rather systematic artefacts of similar magnitude probably due to residual dark signal calibration errors . For CH4, they are smaller but still one observes a quite large
dispersion in the data. Unfortunately, none of the selected pixels is cloud-free, which may cause additional uncertainties. No error bars have been plotted for the FTIR data because they are negligible with respect to the ones of the SCIAMACHY data. It is encouraging that the SCIAMACHY data quite reasonably agree with the ground-based data, taking into account their uncertainties. The apparent sensitivity to altitude (for both CH4 and CO) and
longitude dependence (for CH4) must be verified.
6 PRELIMINARY CONCLUSIONS
The following preliminary conclusions regarding the quality of the SCIAMACHY data products are drawn from a very limited set of comparisons and must therefore be taken cautiously. They all refer to the NRT nadir products unless stated explicitly. They cover the period July to end of November 2002, and allow only a poor latitudinal distinction and no seasonal distinctions at all.
− The O3 vertical column retrieved with the DOAS method in the ultraviolet window (DOAS_0) is
underestimated by at least 5% at mid-latitude and high northern hemisphere locations. The discrepancy was larger with the earliest versions of the processor (v. 3.51); it has gradually decreased as the processor has evolved.
− The O3 vertical column retrieved with the DOAS method in the visible window (DOAS_1) is much too
high, and not scientifically useful.
− The NO2 vertical column retrieved with the DOAS method in the visible window (DOAS_1) at northern
mid-latitudes is too high (by approx. a factor of 2).
− The NIR products CO, CH4 and N2O retrieved with the BIAS method in the NIR windows are
scientifically not useful at present: they adopt values that are more than 100 times too large.
− The SCIAMACHY NIR windows do promise possible exploitations: scientific data products for CH4, and
Already at present, a substantial data set of total column amounts for CO, CH4, O3, N2O, NO2, HNO3 and NO from
FTIR ground-based observations is available to cover the ENVISAT validation data set: an equivalent of about 400 days of observations is available. As far as funding permits, the data providers will improve their data sets, and if possible, provide distinct stratospheric and tropospheric column data to the benefit of the validation of additional ENVISAT profile data products.
7 REFERENCES
‘Coordinated Ground-based Validation of Envisat Atmospheric Chemistry with the NDSC Network: Commissioning Phase Report’, Jean-Christopher Lambert et al, these proceedings.
Acknowledgements
Thanks are due to José Granville, Pierre Gérard, Johan Bulcke and Tim Jacobs of BIRA-IASB for their support for retrieving and reading the ENVISAT and correlative data files. Necessary fileserver hardware has been acquired with Belgian LOTTO funding. The work has been financed through PRODEX contracts 15150/01/NL/SFe(IC) and 15151/01//NL/SFe(IC) and ESA/ESTEC contract n° 15940/02/NL/FF. Various national funding sources have supported the ground-based observations.