40 years of observations of
atmospheric methane from
a remote European site
(among other things…)
Whitney Bader Brewer-Wilson Seminar November 4th, 2016
Overview
• Master’s thesis : "Extension of the long-term total column time series of atmospheric methane above the Jungfraujoch station: analysis of grating infrared spectra between 1977 and 1989."
• PhD Thesis : "Long-term study of methane and two of its derivatives from solar observations recorded at theJungfraujochstation."
• Long-term evolution and seasonal modulation of CH3OH above
Jungfraujoch,AMT, 7, 3861-3872, 2014.
• Retrieval of C2H6 from ground-based FTIR solar spectra : recent burden increase aboveJungfraujoch, JQSRT, 160, 36-49, 2015.
• Increase of CH4 since 2005 based on FTIR observations and GEOS-Chem tagged simulation, ACPD, in review, 2016.
• Postdoc project : "Atmospheric content of the most abundant of
12CH
4 isotopologues from ground-based and satellite infrared solar
observations and development of a methane isotopic GEOS-Chem module."
4th Nov 2016
Jungfraujoch station
3
4th Nov 2016
Whitney Bader - Brewer-Wilson Seminar
• Swiss Alps (46.5°N, 8.0°E) • 3 580 m a.s.l.
• Weak local pollution : no major industries within 20 km
• Very high dryness : high-altitude + Aletsch Glacier in its immediate vicinity
Instrumentation and
retrievals
4th Nov 2016
Jungfraujoch station
5 Instrumentation timeline 1950' 1 m focal length grating spectrometerDatabase of 45 000 spectra (grating + homemade + Bruker) → 40 years of continuous observations
Network for the Detection of Atmospheric Composition Change -NDACC 1991 Bruker 120HR Fourier Transform Spectrometer 1985 Homemade Fourier Transform Spectrometer 1976 - 1989 7.3 m focal length Double Pass Grating Spectrometer 1975 Detection of HF in the atmosphere by R. Zander Zander et al., 1989 Atmospheric observations resumed and haven't stopped since then. pioneering infrared solar observations CH4 : Nielsen and Migeotte, 1952 CO : Migeotte and Neven, 1950 + solar atlas
Jungfraujoch station
6 Instrumentation timeline 1950' 1 m focal length grating spectrometerDatabase of 45 000 spectra (grating + homemade + Bruker) → 40 years of continuous observations
Network for the Detection of Atmospheric Composition Change -NDACC 1991 Bruker 120HR Fourier Transform Spectrometer 1985 Homemade Fourier Transform Spectrometer 1976 - 1989 7.3 m focal length Double Pass Grating Spectrometer 1975 Detection of HF in the atmosphere by R. Zander Zander et al., 1989 Atmospheric observations resumed and haven't stopped since then. pioneering infrared solar observations CH4 : Nielsen and Migeotte, 1952 CO : Migeotte and Neven, 1950 + solar atlas
Whitney Bader - Brewer-Wilson Seminar 4th Nov 2016 40+ atmospheric gases
Kyoto protocol H2O, CO2, CH4, N2O, CF4, SF6
Montreal protocol O3, NO, NO2, HNO3, ClONO2, HCl, HF, COF2, CFC-11, CFC-12, HCFC-22, HCFC-142b, CCl4
Air quality, biomass burning CO, CH3OH, C2H6, C2H2, C2H4, HCN, HCHO, HCOOH, NH3
Others OCS, N2, many isotopic forms (HDO, CH3D,
13CH 4, 13CO,…)
Jungfraujoch station
7 Instrumentation timeline 1950' 1 m focal length grating spectrometerDatabase of 45 000 spectra (grating + homemade + Bruker) → 40 years of continuous observations
Network for the Detection of Atmospheric Composition Change -NDACC 1991 Bruker 120HR Fourier Transform Spectrometer 1985 Homemade Fourier Transform Spectrometer 1976 - 1989 7.3 m focal length Double Pass Grating Spectrometer 1975 Detection of HF in the atmosphere by R. Zander Zander et al., 1989 Atmospheric observations resumed and haven't stopped since then. pioneering infrared solar observations CH4 : Nielsen and Migeotte, 1952 CO : Migeotte and Neven, 1950 + solar atlas
"Extension of the long‐term total
column time series of
atmospheric methane above the
Jungfraujoch station: analysis of
grating infrared spectra between
1977 and 1989."
Grating spectrometer
9 → wavelength → diffraction order Inversion wavenumber (cm-1) Diffraction angle In ten si ty 4th Nov 2016Inversion strategy (SFIT-2)
10
4th Nov 2016
Whitney Bader - Brewer-Wilson Seminar
Datasets and harmonization
11
4th Nov 2016
Whitney Bader - Brewer-Wilson Seminar 2700 spectra - 9 datasets
Datasets and harmonization
4th Nov 2016
Whitney Bader - Brewer-Wilson Seminar 12
Micro-fenêtres et espèces ajustées
1979
1983
Datasets and harmonization
13
4th Nov 2016
Datasets and harmonization
14
4th Nov 2016
CH
4
: 1977 - 1989
15 Zander et al., 1989 Random error 1.17 % Systematic error : 11.98 % - 15.08 %- 9.04 % 4th Nov 2016Jungfraujoch station
16 Instrumentation timeline 1950' 1 m focal length grating spectrometerDatabase of 45 000 spectra (grating + homemade + Bruker) → 40 years of continuous observations
Network for the Detection of Atmospheric Composition Change -NDACC 1991 Bruker 120HR Fourier Transform Spectrometer 1985 Homemade Fourier Transform Spectrometer 1976 - 1989 7.3 m focal length Double Pass Grating Spectrometer 1975 Detection of HF in the atmosphere by R. Zander Zander et al., 1989 Atmospheric observations resumed and haven't stopped since then. pioneering infrared solar observations CH4 : Nielsen and Migeotte, 1952 CO : Migeotte and Neven, 1950 + solar atlas
Fourier Transform Spectrometer
4th Nov 2016
Whitney Bader - Brewer-Wilson Seminar 17
2 Detectors HgCdTe and InSb
650 à 4500 cm-1
High resolution between 0.00285 cm-1
Inversion strategy (SFIT-2)
18
4th Nov 2016
Whitney Bader - Brewer-Wilson Seminar
(covar matrix)
"Long-term study of methane
and two of its derivatives from
solar observations recorded at
the Jungfraujoch station."
PhD thesis
Inversion strategy (SFIT-2)
4th Nov 2016
Whitney Bader - Brewer-Wilson Seminar 20
Inversion strategy
Séminaire de thèse - Whitney Bader 22
Rinsland et al., 2009
992 – 998.7 cm-1
Stavrakou et al., 2011 1029 – 1037 cm-1 Mahieu et al., 2012
+ Atmospheric Chemistry Experiment, 2011 984.9 – 1005.1 cm-1
+ CH3OH
• Solar zenith angle 65 et 80°
• Contrasting absorptions features O393% and 98 %
CH3OH 1.7% and 1.8 %
• Improved vertical sensitivity range Low troposphere [surface - 7 km] UTLS [7 - 15 km]
Inversion strategy
Séminaire de thèse - Whitney Bader 23
Inversion strategy - Interferences
Séminaire de thèse - Whitney Bader 25
Dry conditions
Inversion strategy - Spectroscopy
Séminaire de thèse - Whitney Bader 26
• Combination of 3 windows & updated spectroscopic parameters included • Improved vertical sensitivity range Low tropospheric < 8.5 km UTLS 8.5 - 22 km Hitran 2008 C2H6 pseudolines Pseudolines +CH3Cl
40 years of observations of
atmospheric methane from
a remote European site
(among other things…)
Whitney Bader Brewer-Wilson Seminar November 4th, 2016
Atmospheric methane
• 2ndmost important anthropogenic greenhouse gas
• 1/5 of anthropogenic radiative forcing since 1750 is due to methane
• 3 types of emission processes :
• biogenic (dotted) • thermogenic (plain) • pyrogenic (hatched) • 1 major sink • oxidation by OH + 260% since 1750
CH
4: 1977 - 2015
29
4th Nov 2016
CH
4: 1977 - 2015
30 + 6.96 % Between 1978 and 1983 4th Nov 2016Whitney Bader - Brewer-Wilson Seminar
0.72 ± 0.11 0.37 ± 0.07 -0.04 ± 0.07 …
"The recent increase of methane
from 10 years of NDACC
ground-based FTIR
observations."
Bader, W. et al., Ten years of atmospheric methane from ground-based NDACC FTIR observations, Atmos. Chem. Phys. Discuss., doi:10.5194/acp-2016-699, in review, 2016.
Jungfraujoch station
32 Instrumentation timeline 1950' 1 m focal length grating spectrometerDatabase of 45 000 spectra (grating + homemade + Bruker) → 40 years of continuous observations
Network for the Detection of Atmospheric Composition Change -NDACC 1991 Bruker 120HR Fourier Transform Spectrometer 1985 Homemade Fourier Transform Spectrometer 1976 - 1989 7.3 m focal length Double Pass Grating Spectrometer 1975 Detection of HF in the atmosphere by R. Zander Zander et al., 1989 Atmospheric observations resumed and haven't stopped since then. pioneering infrared solar observations CH4 : Nielsen and Migeotte, 1952 CO : Migeotte and Neven, 1950 + solar atlas
Unexplained increase since ~2005
Whitney Bader - Brewer-Wilson Seminar 33 0.35 ± 0.09 %
-0.04 ± 0.08 %
0.31 ± 0.04 %
10 years of NDACC FTIR observations
Whitney Bader - Brewer-Wilson Seminar 34
1- Eureka (80 °N) 2- Kiruna (68 °N) 3- Zugspitze (47 °N) 4- Jungfraujoch (47 °N) 5- Toronto (44 °N) 6- Tsukuba (37 °N) 7- Izaña (28 °N) 8- Wollongong (34 °S) 9- Lauder (45 °S) 10- Arrival Heights (78 °S)
2005-2014
4th Nov 201610 years of NDACC FTIR observations
Whitney Bader - Brewer-Wilson Seminar 35
Anomaly with respect to 2005.0
Averaged increase : 0.31 ± 0.03 %/year
0.26 ± 0.02 %/year : Wollongong 0.39 ± 0.09 %/year : Toronto
GEOS-Chem v9-02. Tagged simulation
•
Resolution : 2° x 2.5° and 4° x 5°•
47 vertical levels - Output : 3 hours•
Meteo fields : GEOS5 (Dec 2003 - May 2013)•
Spin-up over 2004(70 spins for initialization)
•
Emission inventories• Anthropogenic emissions : EDGAR v4.2 • Biomass burning : GFED3 (8h)
• Wetland model [Pikett-Heaps, 2011] • Termites [Fung et al., 1991]
• Biofuels [Yevich and Logan, 2003] • Soil absorption [Fung et al., 1991]
•
Main sink : 3D OH monthly [Park et al., 2004]•
Lifetime : 8.9 years•
Each tracer represents the contribution of each source to the simulated total column of methane4th Nov 2016
Whitney Bader - Brewer-Wilson Seminar 36
Tracers 1- Total
2- Gas and oil 3- Coal 4- Livestock 5- Waste management 6- Biofuels 7- Rice cultures 8- Biomass burning 9- Wetlands 10- Other natural 11- Other anthropogenic 12- Soil absorption
FTIR vs GEOS-Chem
Whitney Bader - Brewer-Wilson Seminar 37
• Maximum bias 4.8 ± 3.5 % (Arrival Heights) ≈ FTIR systematic error > Anomaly with respect to 2005.0
FTIR vs GEOS-Chem
Whitney Bader - Brewer-Wilson Seminar 38
Averaged increase over 2005-2012 FTIR : 0.30 ± 0.04 %/year
GEOS-Chem : 0.35 ± 0.03 %/year
Methane since 2005
GC tagged simulation : Analysis
Whitney Bader - Brewer-Wilson Seminar 40
Yearly relative change in %. 𝑌𝐶 𝑖𝑛 % = 𝜇𝑛 − 𝜇𝑛−1
𝜇𝑡𝑜𝑡,𝑛−1
μn : annual mean of CH4, year n. The year-to-year relative changes are computed so that when we assume a relative change of a tracer for the year n, it is expressed wrt to the previous year (n-1) as reference. µtot, n-1 : annual mean of the simulated cumulative methane for the year (n-1)
GC tagged simulation : Analysis
• Yearly relative change (%)
• Natural sources mainly responsible for the interannual variation
• e.g. Wollongong
GC tagged simulation : Analysis
• Yearly relative change (%)
• Secondary contributors such as coal or gas and oil contribute to the overall increase
• e.g. Izaña
GC tagged simulation : Analysis
•
Contributors to the cumulative increase : tracer ranking
Whitney Bader - Brewer-Wilson Seminar 43
EUR KIR ZUG JFJ TOR TSU IZA WOL LAU AHT
1 co co co co co co co co co co
2 gao gao wl gao gao gao gao li gao gao
3 wl wl gao wl wl wl wl gao li li 4 ri li ri ri ri li li wl wl wl 5 li ri li li li ri ri ri ri ri 6 wa wa wa wa wa wa wa wa wa wa 7 bf bf oa oa bf bf bf bf bf bf 8 oa oa bf bf oa oa oa oa oa oa 9 on on on on on on on on on on 10 bb bb bb bb bb bb bb bb bb bb 4th Nov 2016
Methane increase : Discussion
Many studies… Rigby et al., 2008 Ringeval et al., 2010 Bloom et al., 2010 Aydin et al., 2011 Dlugokencky et al., 2009 Sussmann et al., 2012 Kirschke et al., 2013 Nisbet et al., 2014 Hausmann et al., 2016 Schaefer et al., 2016Whitney Bader - Brewer-Wilson Seminar 44
Source attribution ?
Methane increase : Discussion
Whitney Bader - Brewer-Wilson Seminar 45
From GEOS-Chem tagged simulation
Secondary contributors to the global budget of methane play a major role in the increase of methane observed since 2005.
→ coal mining, gas and oil transport and exploitation
Source attribution ?
Methane increase : Discussion
Whitney Bader - Brewer-Wilson Seminar 46
From GEOS-Chem tagged simulation
Secondary contributors to the global budget of methane play a major role in the increase of methane observed since 2005.
→ coal mining, gas and oil transport and exploitation
Source attribution ?
4th Nov 2016
Best emission inventories available → limitations
EDGAR v4.2
• Overestimates the recent emission growth in Asia (Schwietzke et al. 2014, Bergamaschi et al. 2013 and Bruhwiler et al. 2014).
• Chinese coal mining emissions are too large by a factor of 2 (Turner et al. 2015, from a global GOSAT inversion)
• EDGAR v4.2 vs global GOSAT inversion (Turner et al., 2015)
• increase in wetland emissions in South America
Methane increase : Discussion
Gas and oil use and exploitation (GAO)
underestimated by current emission inventories (incl. EDGAR) Franco et al., 2015, 2016; Turner et al., 2015, 2016
Whitney Bader - Brewer-Wilson Seminar 4th Nov 2016 47
Methane increase : Discussion
Gas and oil emissions : the use of C2H6 as a proxy CH4 and C2H6 share a source of emissions
Production, transport and use of natural gas and the leakage associated to it amounts at ~ 62 % of ethane’s atmospheric budget (Logan et al.,
1981; Rudolph, 1995)
Whitney Bader - Brewer-Wilson Seminar 4th Nov 2016 48
Methane increase : Discussion
Gas and oil emissions : the use of C2H6 as a proxy CH4 and C2H6 share a source of emissions
Production, transport and use of natural gas and the leakage associated to it amounts at ~ 62 % of ethane’s atmospheric budget (Logan et al., 1981; Rudolph, 1995)
Franco et al., 2016
• Observations : sharp increase of C2H6 since 2009 × GEOS-Chem → ~5 %/year at mid-latitudes, ~3 %/year at remote sites
• Massive growth of oil and gas exploitation in the North American continent, confirmed by Helmig et al. 2016
Whitney Bader - Brewer-Wilson Seminar 4th Nov 2016 49
Methane increase : Discussion
Gas and oil emissions : the use of C2H6 as a proxy
Production, transport and use of natural gas and the leakage associated to it amounts at ~ 62 % of ethane’s atmospheric budget (Logan et al.,
1981; Rudolph, 1995)
Franco et al., 2016
• Observations : sharp increase of C2H6 since 2009 × GEOS-Chem → ~5 %/year at mid-latitudes, ~3 %/year at remote sites
• Massive growth of oil and gas exploitation in the North American continent, confirmed by Helmig et al. 2016
Methane increase ? From C2H6/CH4 ratio derived from GOSAT
measurements
→ from 20Tg in 2008, to 35 Tg in 2014
Confirming the influence of GAO on the observed methane increase
Whitney Bader - Brewer-Wilson Seminar 4th Nov 2016 50
Methane increase : Discussion
Gas and oil emissions : the use of C2H6 as a proxy → C2H6/CH4
Hausmann et al. 2016 : GAO contribution of 39 % to the renewed methane in Zugspitze between 2007 and 2014
BUT
The strength of the C2H6/CH4 relationship associated to GAO strongly depends on the studied region and/or production basin
Variability rarely taken into account (Kort et al. 2016, Peischl et al. 2016)
Whitney Bader - Brewer-Wilson Seminar 4th Nov 2016 51
Methane increase : Discussion
The problem of the use of C2H6 as a proxy → C2H6/CH4
Whitney Bader - Brewer-Wilson Seminar 4th Nov 2016 52
Source attribution ?
• Emissions from GAO well pads may be missing from most bottom-up emission inventories. Lyon et al. (2016)
• A horizontal drilling rig for natural gas in the Marcellus formation in eastern, Pennsylvania.
• Emissions differ from one well pad to another and even within the same pad depending on the depth of the extraction.
• e.g. Marcellus Basin that is
actually two different overlapping basins.
Methane increase : Conclusion
• FTIR ground-based measurements : 0.31 ± 0.03 %/year wrt 2005.0
Source attribution ?
• GEOS-Chem : 0.35 ± 0.03 %/year vs 0.30 ± 0.04 %/year (FTIR)
• Anthropogenic sources, secondary contributors to the global CH4 budget, are first contributors to the observed increase
• coal mining, gas and oil exploitation, livestock
• While GEOS-Chem agrees with our observations, the repartition between the different sources of methane would greatly benefit from an improvement of the global emission inventories. e.g. EDGAR
• US oil and gas and livestock are underestimated.
• Coal emissions are overestimated.
What's the next step ?
How can isotopologues help ?
In situ 13CH
4 observations
NOAA Earth System Research Laboratory & Global Atmospheric Watch
Schwietzke et al. (2016)
Total fossil fuel = industry activities + natural geological seepage
"Methane emissions from natural gas, oil and coal production and their
usage are 20 to 60 percent greater than inventories."
No upward trend of industrial fossil fuel emissions in global CH4 inventories → natural-gas industry improvements
Nisbet et al. (2016)
"A major cause of increased tropical wetland and tropical agricultural
methane emissions, the likely major contributors to growth, may be their responses to meteorological change."
Whitney Bader - Brewer-Wilson Seminar 4th Nov 2016 55
• Both isotopologues show distinctive 13C/12C (and D/H) signature depending on the emission process
• Kinetic Isotope Effect (KIE) : Each isotopologue will react at a specific rate
constant depending on the removal pathway. KIE = Ratio of the rate constants. (Saueressig et al., 2001 & Snover and Quay, 2000).
• Determining the 13C/12C and D/H content of atmospheric methane is therefore a unique tracer of its budget.
How can isotopologues help ?
Whitney Bader - Brewer-Wilson Seminar 4th Nov 2016 56
Two year project – Part I
• Development of a retrieval strategy for 13CH
4 and CH3D from infrared
observations
• Instrumentation & Database
• Fourier Transform Spectrometers
• Toronto : ~1430 days since 2002, resolution : 0.004 cm-1)
• Eureka : ~760 days since 2006 (0.0035 cm-1)
• Jungfraujoch, Switzerland : 2590 days since 1990 (0.004 cm-1)
• PARIS-IR (0.02 cm-1) ~240 days since 2004
• Portable Atmospheric Research Interferometric Spectrometer for the InfraRed
• Complementary : ACE-FTS solar occultations
• ~35 000 occultations since February 2004
4th Nov 2016
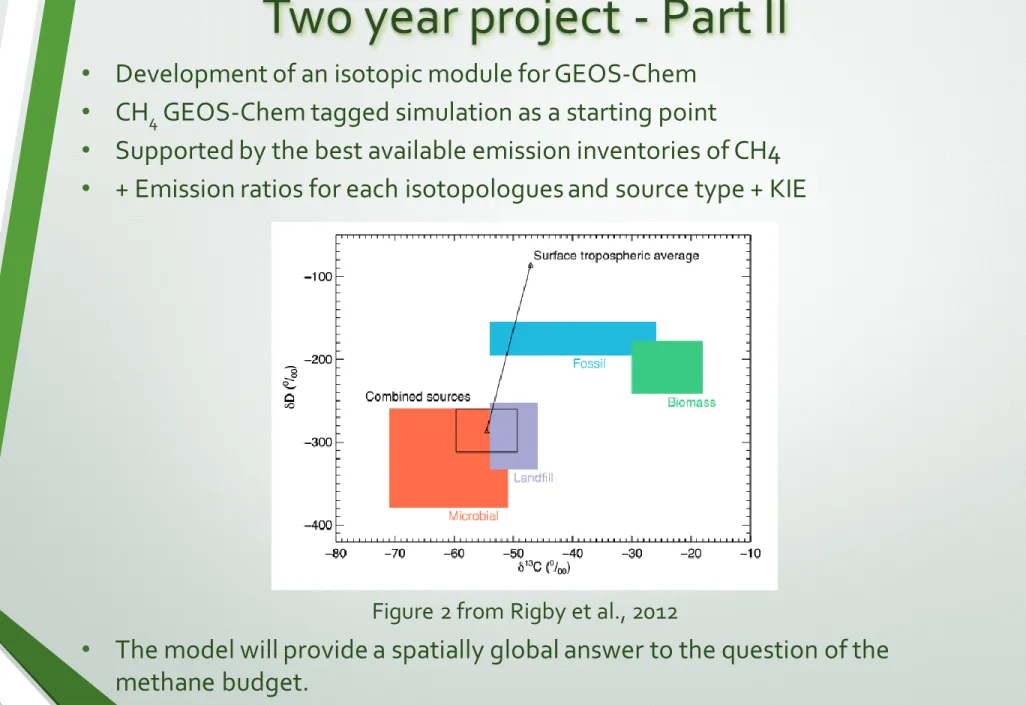
• Development of an isotopic module for GEOS-Chem
• CH4GEOS-Chem tagged simulation as a starting point
• Supported by the best available emission inventories of CH4
• + Emission ratios for each isotopologues and source type + KIE
• The model will provide a spatially global answer to the question of the methane budget.
Two year project - Part II
4th Nov 2016
Whitney Bader - Brewer-Wilson Seminar 58
Thank you !
The University of Liège’s involvement has primarily been supported by the PRODEX and SSD programs funded by the Belgian Federal Science Policy Office (Belspo), Brussels. W.B. has received support by a postdoctoral fellowship from the University of Toronto and funding from the European Union’s Horizon 2020 research and innovation programme under the Marie Sklodowska-Curie grant agreement No 704951.
4th Nov 2016 Whitney Bader - Brewer-Wilson Seminar