The Impact of the Emergence of China’s
Economy on South Africa
Mémoire
Zi YANG
Maîtrise en économique
Maître ès arts (M.A.)
Québec, Canada
© Zi YANG, 2014
iii
Résumé
Le but de cette recherche est d'analyser l'impact du développement économique de la Chine sur l'économie de l'Afrique du Sud. Afin de répondre à cette question, cinq principaux canaux d'impact sont présentés: (1) La concurrence accrue des importations chinoises sur le marché local; (2) L'augmentation de la demande chinoise pour les exportations sud-africaines; (3) La réduction des coûts des consommations intermédiaires pour les producteurs locaux à travers des prix d'importation réduits; (4) Bien-être des consommateurs améliorée par la réduction des prix à la consommation; (5) La concurrence accrue des importations chinoises dans d'autres marchés d'exportation de l'Afrique du Sud.
Un seul pays (Afrique du Sud) modèle CGE est adopté à distinguer deux marchés extérieurs pour les importations et les exportations: la Chine et le reste du monde. Le secteur du commerce à deux niveaux obtenu est capturé par l'utilisation de imbriquée Armington (l'importation) et les CET (l'exportation) fonctions pour modéliser la substitution entre les deux marchés extérieurs.
v
Abstract
The purpose of this research is to analyze the impact of China’s economic development on the economy of South Africa. In order to address this question, five main channels of impact are identified: (1) Increased competition from Chinese imports on local market; (2) Increased Chinese demand for South African exports; (3) Reduced intermediate input costs for local producers through reduced import prices; (4) Enhanced consumer welfare from reduced consumer prices; (5) Increased competition from Chinese imports in South Africa’s other export markets.
A single-country (South Africa) CGE model is adopted to distinguish two external markets for imports and exports: China and the rest of the world. The resulting two-tiered trade sector is captured through the use of nested Armington (import) and CET (export) functions to model substitution between the two external markets.
vii
Table of contents
Résumé...iii
Abstract...v
Table of contents ...vii
List of Tables...ix Acknowledgements...xi Introduction...1 Literature Review...9 Methodology...13 Conclusion...23 References...27 Annexes...29
ix
List of Tables
Table 1. China’s Exports from/ Import to South Africa Table 2. Gross Domestic Product of South Africa
Table 3. recent economic situation of China and South Africa Table 4. South Africa's main imports of Chinese products Table 5. South Africa’s main exports to China
Table 6: Effects of Sectorial exports Table 7: Effects of Sectorial output Table 8: Macroeconomic impacts Table 9: Effects of Sectorial imports Table 10: Effects of Sectorial output Table11: Macroeconomic impacts
xi
Acknowledgements
First of all, I would like to extend my sincere gratitude to my director, Mr. John Murray Cockburn, for his instructive advice and useful suggestions on my study.
I am deeply grateful of his help in the completion of this research.
Second, I would like to express my heartfelt gratitude to Ms. Hélène Maisonnave, who led me into the world of GAMS code. I am also greatly indebted to MS. Carleen Gruntman, whose profound knowledge of English triggers my interest for this beautiful language.
Third, High tribute shall be paid to Mr. Erwin Corong who have put considerable time and effort into various economic data between China and South Africa.
Last my thanks would go to my beloved family for their loving consideration and great confidence in me all through these years. Special thanks should go to my friends and my fellow classmates who gave me their help and time in helping me work out my problems during the difficult course of this research.
1
I. Introduction
The purpose of this study is to explore the ways in which China’s economic development has influenced South Africa’s economy. The research focuses on the trade relationship between South Africa and China.
China's growing economy now plays a very important role in the world economy. In particular, there has been a significant increase in Chinese imports and exports. In fact, China's economic development has greatly promoted global economic growth (Eswar Prasad, 2004).
From the end of 2010, China has officially exceeded the USA and became the most important export market in South Africa. From 2005 to 2012, China has also become South Africa's largest exporter and importer (See table 1 below).
Table 1. China’s Exports from/ Import to South Africa (US dollars, millions) (See Annexes)
South Africa is a middle-income developing country. Rich resources and cheap labor have made South Africa the most economically developed countries in Africa, known as “the economic giant in Africa”. South Africa is one of the most important members of the Southern African Customs Union (SACU). South Africa is also the largest energy producer and consumer in Africa, as well as an important member of the IMF (International Monetary Fund) and the G20 (Group of Twenty Finance Ministers and Central Bank Governors). In 2011, South Africa was a member of the non-permanent UN Security Council. Accordingly, South Africa has taken an important position in global affairs.
2
South Africa's GNP accounts for more than 30% of sub-Saharan Africa (World Bank, 2011). As Africa's largest economy, it has maintained a high rate growth for decades, doubling in size on average every 7.3 years. Thus, the ’African giant” has become an “economic miracle”.
Table 2. Gross Domestic Product (in Billions, US dollars) of South Africa (See Annexes)
South Africa’s free trade regime and foreign trade have played an essential role in the national economy. At the beginning of the 21st century, South Africa adjusted its foreign trade policy, including the implementation of a new industrial policy as a priority in the local procurement policies, in order to tap into the new economic growth impetus. South Africa has continued to improve economic relationships with its neighbouring countries and has focused on the development of African regional markets. While maintaining trade relationships with both the United States and with Europe, South Africa has paid attention to developing trade relationships with other emerging economies. Consequently, the policy of the South African Foreign Trade has shown new features. For instance, in recent years, trading between South Africa and China, India, Brazil, Russia and other emerging economies, has increased rapidly. Due to the financial crisis, the volume of trade between South Africa and the European Union dropping significantly, while, conversely, trade with the other four BRICS countries has been maintained.
Within the next five years, South Africa will invest approximately 15.26 billion dollars in new economic growth projects. These projects will focus on the development of mining and mineral processing, manufacturing, agriculture and agro-industry, tourism, creative industries and other industries. In addition to all of this, South Africa plans to attract foreign investment, spending about one hundred million dollars to promote: mining, manufacturing, transportation, agriculture, tourism and green industries, financial services, high-tech industries, and other sectors to obtain comprehensive and
3
rapid development. It is expected that the South African government will introduce a large number of strategic initiatives in which there should be an abundance of trade and investment opportunities that may result in faster economic growth for South Africa.
The economic structures of South Africa and China are complementary in nature. In other words, if both countries collaborated in various economic sectors, great economic benefits might result. Because both countries are members of “BRICS” ( Brazil, Russia, India, China and South Africa), they are distinguished by their large, fast-growing economies and significant influence on regional and global affairs. In 2013, the five countries of BRICS represented almost 42% of the world's total population, 26% of the total land mass of the world, 12.8% of the world trade volume and 14.6% (US$14, 9 trillion) of the world's GDP total.
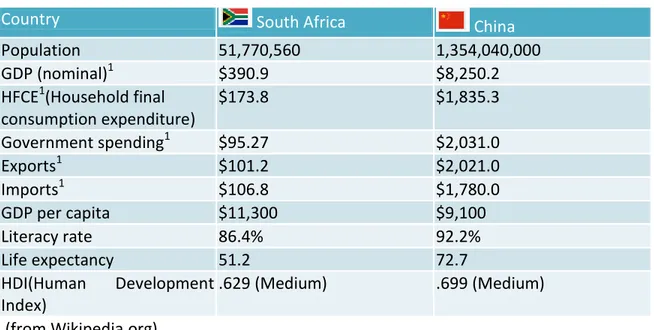
The following data shows the current economic situation in China and South Africa: Table 3. recent economic situation of China and South Africa (See Annexes)
This research is thus devoted to the theoretical and methodological issues in the modeling of the economic development in China and in South Africa’s strategic plans to attract investment from China.
The analysis will be organized into five channels.
1. Increased competition from Chinese imports on local market.
There has been increasing demand for imports from China to South Africa. As a low-cost exporting country, China has put downward pressure on domestic prices in South Africa. The increased competition from these imports may result in a downward shift in domestic firms’ demand, which would, consequently, lessen domestic sales. This has already created consequences in South Africa since many South African manufacturers
4
have already suffered as domestic commodities have been replaced by cheaper Chinese imports, resulting in serious competitive impacts in the South African labour market. “Chinese clothing imports have not only cut down domestic production, but have also displaced imports from neighbouring countries, many of which were previously produced by small-scale tailors, dressmakers, and knitters” (for Kenya, see McCormick et al. 2007). “Chinese imports, are problematic for domestic manufacturers. Ghanaian furniture exporters find it increasingly difficult to compete with Chinese imports, as do South African clothing manufacturers” (Kaplinsky and Morris, 2008).
The expansion of Chinese clothing imports has pushed local South African textile manufacturers into a disadvantageous competitive position and has forced manufacturers to sharpen their competitiveness. Although South Africa has a labour surplus, cheap textiles from China have seriously impacted the once-booming textile industry. The South African economy has been hit hard by its import trading with China, since China became a member of the World Trade Organization (WTO) in 2001. Employment in many labour-intensive manufacturing sectors has been lost in the local market. “Complaints are increasing from the South African textile industry, saying that cheap imports from China are threatening to wipe out local industry, where 60,000 jobs have been lost since 2002”. (Thakalekoala 2005)
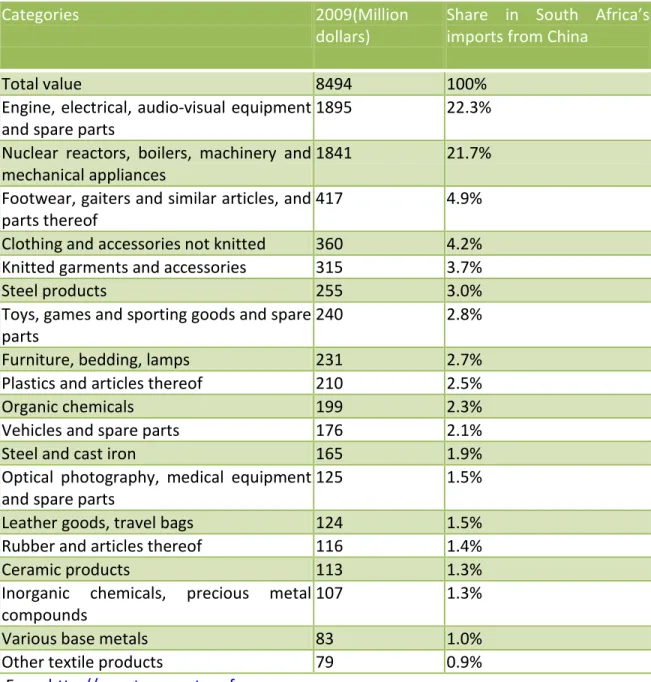
Table 4. South Africa's main imports of Chinese products (See Annexes)
2. Increased Chinese demand for South African export.
The rapid growth of China’s demand for South Africa exports will be beneficial to the economy of South Africa in the future. “Already Africa’s single biggest trading partner, China is set to become the continent's largest export destination in 2012 according to South African based Standard Bank.”(LanreAkinola, 2012). Regarding China’s increased imports of South African natural resources, China’s demands for all kinds of
5
commodities may heighten their global prices directly or indirectly; moreover, South Africa has gained surplus in trade with China.
Most African manufactured exports to China come from South Africa. Most of these products are natural resources: precious metals, mineral products and base metals have been the main Chinese export demands from South Africa.
Some parts of the South African economy have revived, because of the post-2000 boom in commodity prices. This growth is closely linked to the Chinese needs for imported inputs, which has been used for the infrastructure construction and for its manufacturing industry. Regarding the increasing price of hard commodities (metal steels), Chinese commodity imports have expanded in the African continent.
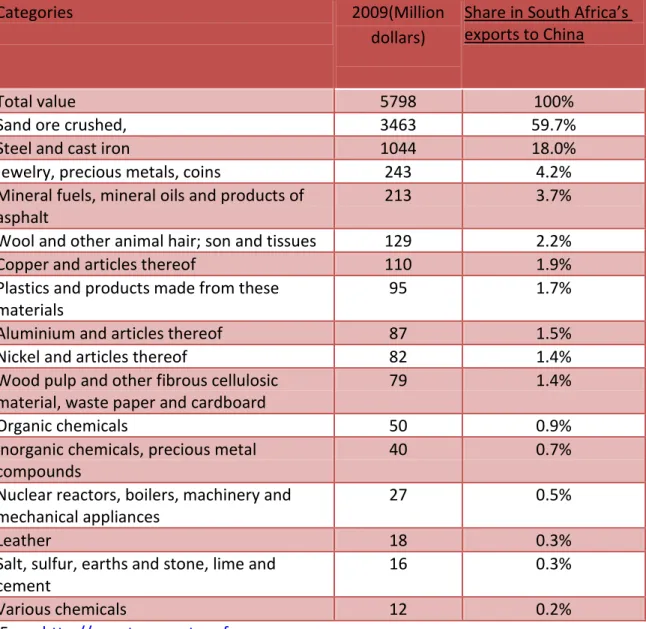
The following table provides some statistical data on the size and the structure of South Africa’s exports to China.
Table 5. South Africa’s main exports to China (See Annexes)
3. Reduced intermediate input costs for local producers through reduced import prices.
The low prices of Chinese imports have also reduced intermediate/capital input costs for South African producers. Accordingly, this has improved their competitiveness in the global and local market. For example, South Africa’s clothing producers have benefited from low-cost textiles imports from China. Wholesalers and retailers have switched their sourcing of inputs/capital products to cheaper Chinese suppliers to increase their cost competitiveness.
South Africa’s local producers have bought semi-finished products imported from China at a much lower price than similar local products.
6
Low-cost products imported from China have contributed to the livelihoods in South Africa. For example, by the lower prices of clothing imports, South African consumer consumption has increased in recent years and Chinese products such as small household products and hi-tech technology products have become more and more popular in the South African market. After ten years of development, Chinese products have transformed from low-grade and unfashionable products to products of high quality with an array of different styles and variety. Therefore, this has major positive impacts on the local consumer. “Made in China” has been warmly welcomed by the South African consumer. Chinese products have been cheap and quite competitive in the market. Low-income families account for most of the population in South Africa; they have the right to choose cheaper products. In other words, low-cost electronic products and T-shirts from China actually benefit the local consumers.
5. Increased competition from Chinese imports in South Africa’s other export markets.
Exports of fabrics from China have already displaced South African products in other export markets. China is a new dynamic force among the Asian Tigers, which has been threatening competitiveness in value added product sectors, through their low cost.
China’s share of exports has increased significantly. While there had been relatively little competition between Chinese and South African exports in the late 1990s, over the past decade this has increased substantially. “Africa's biggest economy: South Africa has lost about 900 million dollars in trade with the rest of the continent. Though manufacturing remains the country's second-biggest sector, its share of output has declined over the last decade from 19% to 15%.”(Idéle Esterhuizen)
As China competes against South Africa directly in labor-intensive and low-technology industrial sectors, South Africa’s manufacturers have been moving back to the resource sectors. Of course, the most obvious threat has been demonstrated in South African
7
clothing, textile, furniture and footwear exports in both the regional and global markets. (Thakalekoala 2005)
To analyse the impact of China’s growth on the South African economy, this study adopts a methodology of a single country CGE model with two external markets captured by Nested Armington /CET functions. The second part of this thesis provides a literature review. The third section presents the simulation scenarios and then discusses the results of the simulation.
The study concludes with a series of results and consequences coming from the change of the world import prices from China and the world export prices to China. The central argument of this study shows many complex channels that can affect South Africa’s economy and the consequences of these channels.
9
II. Literature Review
Several studies have sought to examine the impacts of trade with a specific partner on a country’s economy (South Africa). Generally speaking, there are three types of CGE models used for this purpose:
Single country models with a single external market (rest of the world)
Single country models with multiple external markets (e.g. trade partners of interest in the study and rest of the world)
Multi-country models, including the country of interest and the partners of interest.
Approach 1 (single country, one external market):
In this approach, the CGE model adopted is a standard CGE model with a single external market (rest of the world). As the partner of interest is not distinguished, the shock cannot be captured directly in the model. Instead, the researchers use a separate global model to first simulate the shock (e.g. a bilateral trade agreement between the country and partner of interest) and then derive the consequent changes in import and export prices. This approach also makes it necessary to calculate variations in the country of interest’s trade-weighted average import and export prices, which is introduced into the single country model as the “shock”.
An example of this approach comes from the article titled “Examining the South Africa– China Agricultural Trading Relationship” which uses both the PROVIDE model and the GTAP model. It first utilizes the global model of the GTAP to evaluate the variation of the import/export prices in South Africa with all its partners subsequent to a China-South Africa free-trade agreement.After that it uses the import/export shares of each partner to calculate an average change from the GTAP in South African import/export prices, which is introduced in the single-country CGE model as a shock.
10
The PROVIDE model applies the result of the GTAP model and calibrates its detailed levels in the underlying social matrix (SAM). Furthermore, this article concludes that: “The macroeconomic results from the PROVIDE model indicated an increase of 0.02% in the gross domestic product of South Africa from the given changes in world prices faced by South Africa’s producers and consumers as derived from the GTAP model results.”(Sandrey R. and Edinger H. (2009) ).
However, this method does not permit separate analysis of trade with China and it assumes fixed import /export shares from foreign markets, thus excluding possible substitutions in South Africa’s imports and exports between China and other external markets.
Approach 2 (single country, two external markets with Nested Armington/CET):
This approach applies a single country, two external markets and a computable general-equilibrium (CGE) model. It is solved simultaneously and coherently by the choice of purchasing in the local market and importing from the other country. It is based on the use of the nested Armington/CET functions. The first choice is followed by the second choice: import from/export to the rest of the world, then import from/export to China. As an example, Zhang, X.G. (2006) proposes a “two-tier Armington substitution in a three-country pure exchange model”. In the first tier, local consumers substitute between composite import products and domestic products. In the second tier, they substitute between imports from the two partner countries.
Although it focuses on the change of average imports and its Armington fits this research model, it is not the same model as what this research is seeking: a single country, two external markets, and CGE models.
Thus, this research introduces the Armington approach – and a similar two-tier CET approach to model exports by external market – into a single country, two external
11
market CGE model.
Approach 3 (multi-country, multi-external market):
This approach employs a multi-country, computable general-equilibrium model. “This model has both detailed country coverage of the region and rich links between countries through goods and asset markets.”(Greene M., Dihel N., Kowalski P. and Lippoldt D.(2006)). This method notices a difference of imports/ exports between intraregional trade flows and the rest of the world. It also decomposes the price of imports /exports by: the world price of the imported /exported product from China (PWMc /PWEc) and the world price of the imported /exported product from the rest of
the world (PWMRDM/PWMRDM) by using the GTAP model and the CGE model.
This world model is too complex to analyze in detail the impacts of China’s growth on the South African economy.
13
III. Methodology
This study develops a single country (South Africa) computable general-equilibrium (CGE) model with two external markets - China and the rest of the world - using the nested CET/Armington functions to capture import/export substitution between Chinese and other external markets. “The allocation of the import budget is further guided by another CES utility function, which gives equal shares to the imports from all countries but treats them as imperfect substitutes. This allows the model to start from the same free-trade equilibrium point.” (Zhang, X.G. (2006)). This study starts from a standard single-country CGE model and adapts more than one foreign country (China and the rest of the world). It is, thus, assumed that “consumer’s preferences over its own domestic and imported goods from more than one country are separable” (Zhang, X.G. (2006)).
The CGE model is a model of an open economy with several branches of production, factors of production and agents (households, corporations, the government, China and the rest of world). The presence of China and the rest of the world leads us to consider the existence of flows of exports and imports which require the consideration of additional tax revenue, foreign savings and international commodity prices denominated in foreign currency and in national currency.
In this model, two input assumptions are made: the first is that the domestic economy is a price-taker, i.e. the prices of exports and imports are fully determined on the world market. The second hypothesis assumes that domestic producers face a finite elasticity export demand. This following graph illustrates essential variables:
14
The import side
composite product(Q)
buy of local products σM2 imports (IM)
imports from China σM1 imports from the rest of the world
σM1, σM2: substitution elasticity for the CES function at the first level and the second level
The export side
total production
sell on the local market σE2 exports (EX)
exports to China σE1 exports to the rest of the world
σE1, σE2: substitution elasticity for the CET function at the first and the second level
There are five channels through which the emergence of China’s economy affects South Africa. These channels are: (1) Increased competition from Chinese imports on local market; (2) Increased Chinese demand for South African exports; (3) Reduced intermediate input costs for local producers through reduced import prices; (4)
15
Enhanced consumer welfare from reduced consumer prices; (5) Increased competition from Chinese imports in South Africa’s other export markets.
The basic issue in all these channels is the world import price from China (PWMC) and
the world export price to China (PWEC).
This is illustrated in the following functions:
Q = AM *(βM*IM-ρM+ (1- βM)*DD-ρM] 1/(1-ρM) (1)
PWM=
AM
1
*(βM)σM(PWMC )1-σM+(1-βM)σM(PWMROW)1-σM]1/(1-σM) (Nested Armington) (2)
IM = *(PD/PM)*(βM/1-βM)] σM*DD (Armington) (3)
Here the PWM is the total import price of products in South Africa, i.e.: average import price; AM is the shift parameter in the Armington function; βM is the share parameter in the Armington CES function; σM is the substitution elasticity for the CES function, AM is
scale parameter in the Armington CES function; Q is composite product; DD is the demand for local products;ρM is elasticity parameter of composite products; PM is the price of imports; PD is the price of local products; IM is imports.
XS = AE *(βE*EXρE+ (1- βE)*DSρE] 1/ρE (4) PWE =
AX
1 *(βE
)-σX(PWEC )1+σX+ (1-βE)-σX(PWEROW)1+σX]1/(1+σX)(Nested Armington) (5)
16
Here PWE is the total export price of products from South Africa, i.e.: average export price; AX is the shift parameter in the CET function; βE is the share parameter in the Armington CET function; σX is the substitution elasticity for the CET function; DS is the
supply of domestic product; XS is the production; AE is scale parameter in the Armington CET function; EX is exports; DS is supply of local products,ρE is elasticity parameter of CET.
We also have:
PM= (1+tx) (1+tm)*e*PWM (7) PE=e*PWE/ (1+te) (8) Where PM is the price of import, tm is the tariff on imports, tx is the tariff on exports, PE is the price of South African export, e is the nominal exchange rate.
Using the equations above, we can explore what happens when PWMC falls and PWEc
rises through the five different channels.
Section III.1 Chinese imports displace domestic producers
PWMc drops, which reduces PWM and thus PM drops. As a result, imports displace local
products:
IM = *(PD/PM)*(βM/1-βM)] σM*DD (Armington) (3) Total imports rise as local consumers substitute to cheaper imports. As a result, the demand for local products falls, reducing both their price (PD) and volume (DD).
17
PWEC rises, which increases PWE and PE. As a result, total exports increase:
EX= [(PE /PL)*(1-βE/βE)]σE*DS (Armington) (6) So the exports from South Africa would grow as well.
Section III.3 Reduced intermediate input costs for local producers through reduced prices
The falls of PM and PD push the price of the composite good (PC) to drop, since: PC↓= (PD↓*DD↓+PM↓*IM↑).
Therefore, the price index of intermediate consumption would fall:
PCI ↓= ∑PC↓*DI/CI (9)
(Where the DI is the intermediate demand for products, CI is Total intermediate consumption.)
This increases the value added price for local producers and favors increased local production.
PVA ↑= (P*XS-PCI↓*CI) /VA (10)
It is the same thing for PINV (price of investment) and, consequently, for INV (investment).
Section III.4 Enhanced consumer welfare from reduced consumer prices
C ↑=γ*CTH? /PC↓ (11) γ is the share of the product in the consumption budget; C is the volume of house hold consumption; PC is the price of composite products; CTH is the budget of household
18
consumption. The variation in local incomes and consumption is hard to predict, as it depends on the net effect of many general equilibrium impacts such as: loss of domestic market shares, increase in exports to China, losses of shares in other export markets, changing government revenue, etc. Even if total consumption value falls, if the price of consumption goods fall more, the volume of household consumption, which determines consumer welfare, might increase.
Section III.5 South Africa has lost market share compared to China in export markets
As Chinese exports in other external markets bring down prices, the demand for South African products in these markets is likely to fall. This will translate into a fall in their prices (PWEROW) and volumes (EXROW).
Simulation results from an increase of 20% in the Chinese demand
for South African exports
There are nine sectors that export more than 10% of their total exports to the Chinese market. In this report, these sectors will be referred to as the “China-oriented” sectors. The first simulation consists of a 20% increase in the Chinese demand for the five China-oriented sectors.
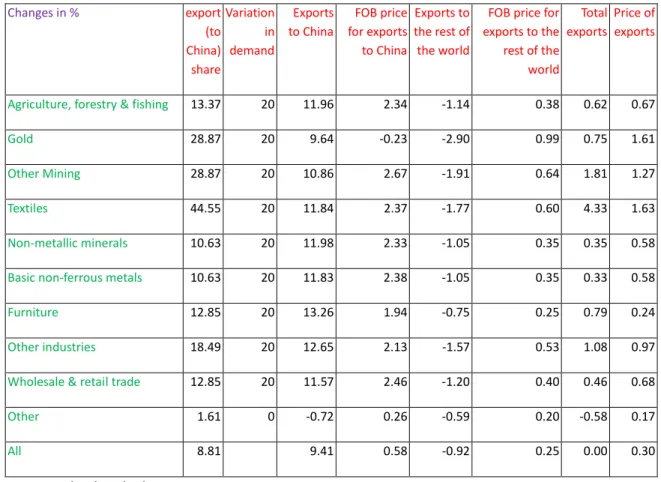
In the midst of an increased Chinese demand, for South African experts, we can observe an increase in export quantities and prices (Table 6). Quantities increase more than prices because of the high elasticity of supply (6) we have assumed between Chinese and other export markets. There is little impact on the quantity and price of exports to China from the other sectors.
19
South African exporters have moved some exports from the global export market towards China in order to be more profitable. As a result, exports to the rest of the world markets (except China) drop (table 6): exports to the rest of the world of five China-oriented sectors has slightly reduced by annual ≈1%, resulting into slightly
increased prices of South African exports to the rest of the world market. The FOB (free on board) price for exports to China (table 6) has increased by almost the same
proportion as the export price to the rest of the world (<1%). The sectors that have the highest share of their exports oriented toward the Chinese market (other mining and other industries) have the greatest reduction in the exports to the rest of the world. The changes in exports to China and to the rest of the world, result in little growth of total export (≈ 1%). Total exports are the sum of exports to China and to the rest of the world, and are strongly connected to the price of exports and the orientation towards China. The sectors with the largest export shares to China (mining and other industries) are found to have the greatest increase in total exports.
In the China-oriented sectors with large total export shares (agriculture and mining), producers reorient their local sales toward the export market (Table 7).
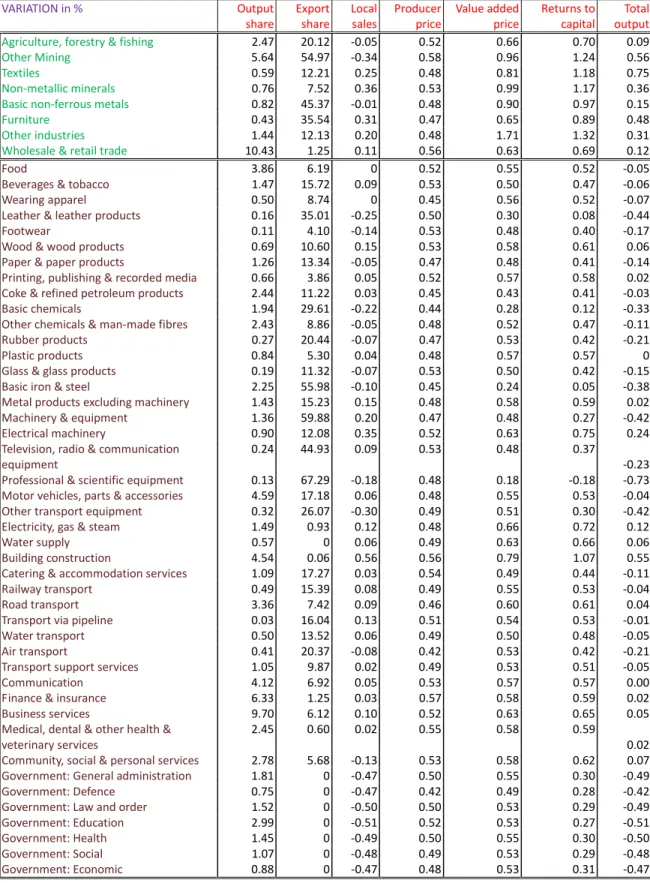
Table 7: Effects of Sectorial output (See Annexes)
Following this change, total output has a very slow increase <1%. As already mentioned, he sectors with large export shares to China post the greatest output increase.
The government sectors post, the strongest output volume reductions. Total government spending is fixed in value and since prices have increased, the output volumes must fall.
In contrast, the total output of construction increases 0.55% from an improvement of government savings (see discussion below), which drives total investment upward.
20
There has been a growth in government income from the increased (Chinese) export tax revenue and direct tax revenue from households and firms (Table 8).Given fixed
government spending, the public deficit falls. Other sources of savings rise moderately (household/firm savings) or remain constant (foreign savings).Consequently, total investment (savings-driven) increases.
Given fixed factor endowments and productivity in the economy, total GDP changes slightly (0.16%). Because there is an increase in export demand for labour, average wages rise by 0.57%. This, along with increased returns to capital (Table 7), leads to an increase in nominal household income and consumption. Real household consumption rises (channel 4) significantly less once the inflation of consumer prices (0.45%) is taken into account.
Table 8: Macroeconomic impacts (See Annexes)
Simulation results from a reduction of 10% in the world prices of
Chinese imports
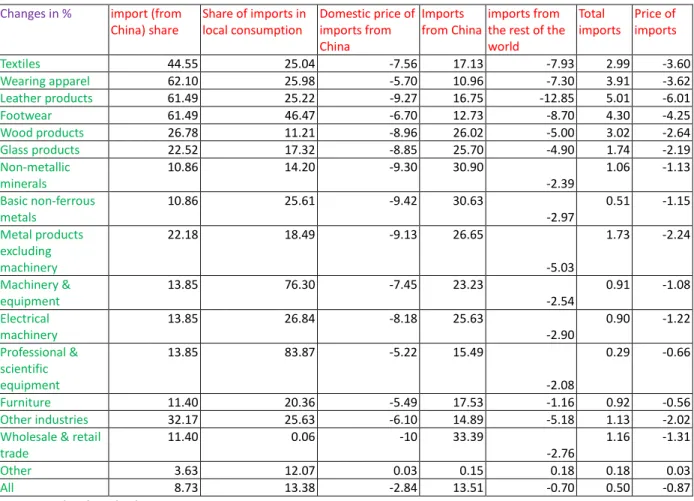
There are fifteen sectors that import more than 10% of their total imports from the Chinese market (Table 9). We will refer to these as the “China-oriented” sectors in what follows. Our second simulation consists in a 10% decrease in world prices of Chinese imports for the fifteen China-oriented sectors.
With decreased world prices of Chinese imports, we also observe a decrease in the domestic prices (including margins) of imports from China (Table 9). For sectors with high transport margins – e.g. wearing apparel and other manufacturing products – the fall in domestic prices is smaller. The sectors with the greatest price decreases naturally have the strongest import response. Quantities increase more than prices fall, given the
21
high elasticity of supply (3) we have assumed between Chinese and other imports markets. We can note that there is little impact on the quantity and price of imports originating from China in the other sectors.
Table 9: Effects of Sectorial imports (See Annexes)
South African importers in China-oriented sectors reduced imports from several global export markets in order to increase imports from China. This had a consequence in imports from the rest of the world markets in terms of drops in these sectors (table 9). The China-oriented sectors that have the greatest reductions in the prices of Chinese imports and the highest shares of imports originating in China have the greatest reduction in the imports from the rest of the world markets. As mentioned, the other (non China-oriented) sectors are generally not affected.
Following these changes of imports from China and the rest of the world markets, there has been little increase of total imports in the China-oriented sectors. Total import is the sum of imports from China and from the rest of the world markets.
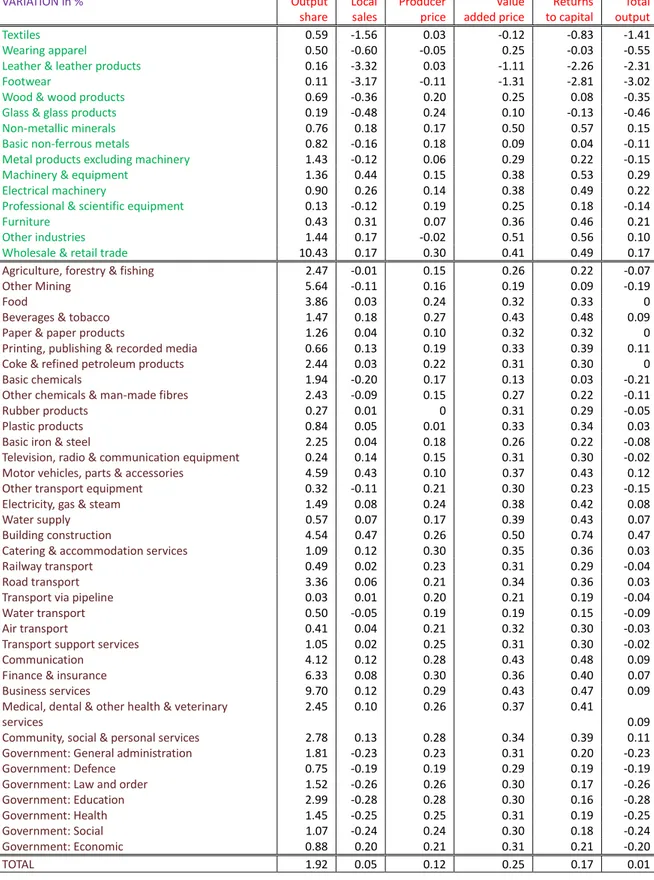
In most of the China-oriented sectors, local sales and total output fall (channel 1 in the introduction) in the midst of falling Chinese import prices (Table 10). The sectors with large import shares from China post the greatest output decrease. Nominal prices generally rise, as the fall in import prices leads to a real exchange rate appreciation (the nominal exchange rate is the numeraire). Value added prices increase more, given the reduction in the cost of imported inputs (Channel 3). The China-oriented sectors generally experience a fall in relative prices (producer and value added prices rise less than the other sectors).
The government sectors also post output volume reductions. We can assume that when total government spending is fixed in value and their prices have increased, then output volumes must fall.
22
In contrast, total output of construction increases 0.47%, because there has been an improvement of government income and savings (see discussion below), which drives total investment upward.
Table 10: Effects of Sectorial output (See Annexes)
There has been a growth in government income, primarily due to the increase in nominal household and firm income and the direct taxes they generate (Table 11). Given fixed government spending, the public deficit diminishes. The other sources of savings rise moderately or remain constant. As a consequence, total investment increases 1.22%.
Given fixed factor endowments and productivity in the economy, total GDP changes little (0.24%). Given the above-mentioned real exchange rate appreciation, nominal wage rates rise by 0.32%. This, in combination with the increase in sectorial returns to capital (Table 10), raises nominal household income/consumption (0.31%). Real
household consumption rises less due to the inflation of consumer prices from the real exchange rate appreciation (channel 4).
23
IV. Conclusion
The study focuses on the impacts of changes in the world import prices from China and the world export prices to China. The transmission channels are complex
In terms of import, the growth of Chinese imports makes the total South African imports from China rise, so the demand for South African local products would fall. Hence the price of the product sold on the local market reduces the price of intermediate consumption and capital products would go down accordingly.
In terms of export, the rise of South Africa’s export to China pushes the total exports of South Africa up. Yet, South Africa has lost market share to Chinese enterprises in other export markets.
In relation to exports: after running a simulation of an increase of 20% in Chinese demand for exports, an increase occurs in export quantities and prices. South African exporters discontinue several exports away from the global export markets to China in order to gain more profit. Exports to the rest of the world (except China) drop, which, then has slightly increased the price of South African exports to the rest of the world markets. In addition, there has been little growth of total exports.
In the China-oriented sectors with large total export shares, producers reorient their local sales towards the export market. Consequently, total industrial output has only slightly increased. There has been an observed growth in government income from increased (Chinese) export tax revenue and direct tax revenue from households and firms. Given fixed government spending, the public deficit then drops. The government sectors have been among the strongest output volume reductions. In addition to this, and due to the fixed nominal value of government expenses and increased prices, output volumes fall and the public deficit drops. The other sources of savings rise
24
moderately or remain constant. Total investment – which is savings-driven – increases, total GDP changes slightly, average wages rise, and there is an increase in nominal household income and consumption. Real household consumption also rises.
In relation to imports: after running a simulation of a reduction of 10% in the world prices of Chinese imports, we can observe a decrease in domestic prices (including margins) of imports from China, and quantities increase more than prices fall. The sectors with the greatest decreased prices naturally have the strongest import response.
South African importers in China-oriented sectors discontinue several imports from global export markets in order to import more from China. Therefore, imports from the rest of the world markets drop in these sectors. The China-oriented sectors that have the greatest reductions in the Chinese import prices and the highest shares of imports oriented toward the Chinese market have the greatest reduction in the imports from the rest of the world markets. In addition to this, there has been a slight growth of total import in the China-oriented sectors. The fall in Chinese import prices, also, leads to a decrease in overall import prices.
In most of the China-oriented sectors, local sales and total output fall. The sectors with large import shares from China post the greatest output decreases. Nominal prices generally raise, as the fall in import prices leads to a real exchange rate appreciation. Value added prices increase more, given the reduction in the cost of imported inputs. The China-oriented sectors generally experience a fall in relative prices. The government sectors also post output volume reductions. If we assume that total government spending is fixed in value and their prices have increased, then we can conclude that output volumes fall and the public deficit. There has been a growth in government income. The other sources of savings rise moderately or remain constant. As a consequence to this, however, total investment increases, total GDP increases slightly, average wages rise, and there is an increase in nominal household income and consumption. And lastly, real household consumption rises.
25
The key of this research has been to analyze the impact of the emergence of China’s economy on South Africa. There are many complex channels that can affect South Africa’s economy and in many different ways. It requires the computable general-equilibrium (CGE) model. By adopting the nested CET/Armington framework, this study moves forward to explore the consequences and the solutions. The next steps will be to obtain the data required to construct the CGE model for South Africa and decompose its Chinese and other external markets, conducting simulations of China’s growth and interpret the results.
27 References
1) Bal M. , Valentin L. (2008) “La stratégie de puissance de la Chine en Afrique”, Base de Connaissance AEGE : http://bdc.aege.fr.
2) Biggeri M., Sanfilippo M.(2009) “Understanding China's move into Africa: an empirical analysis”, Journal of Chinese Economic and Business Studies, page 31-54.
3) Decaluwé B., Martens A., Savard L.(2001) “La politique économique du développement et ls modèles d’équilibre général calculable”, Canada, les Presses de l’Université de Montréal.
4) Dollar D. (2008) “Lessons from China for Africa”, The World Bank, (http: //econ.worldbank.org.), Policy Research Working Paper 4531.
5) Greene M., Dihel N., Kowalski P. and Lippoldt D.(2006) “China's trade and
growth: impact on selected OECD countries” Available at
http://www.oecd.org/trade .
6) Kaplinsky R (2008). “What Does the Rise of China Do for Industrialisation in Sub-Saharan Africa? Review of African Political Economy”, http://www.roape.org/cgi-bin/roape/show/11502.html, Review of African Political Economy, 35(115), page. 7–22.
7) Kaplinsky R., McCormick D., and Morris M. (2010) “Impacts and Challenges of a Growing Relationship between China and Sub Saharan Africa”, London: Routledge (2010 forthcoming), published in V. Padayachee (ed.), “The Political Economy of Africa”.
8) Norman V. D. (1990) “Assessing trade and welfare effects of trade liberalization---A comparison of alternative approaches to CGE modelling with imperfect competition”, North-Holland, European Economic Review 34 (1990), 725-751. 9) Prasad E. (2004), “China’s growth and integration into the world economy:
28
Prospects and challenges”, Washington DC, International Monetary Fund.
10) Sandrey R. and Edinger H. (2009) “Examining the South Africa–China Agricultural Trading Relationship”, ISSN 1104-8417, Discussion Paper 4 2, Uppsala.
11) Zafar A.(2007) “The Growing Relationship Between China and Sub-Saharan Africa: Macroeconomic, Trade, Investment, and Aid Links”, Oxford University Press.
12) Zhang, X.G.(2006), “Armington Elasticities and Terms of Trade Effects in Global CGE Models”, Melbourne, Productivity Commission Staff Working Paper.
29
Annexes
Table 1. China’s Exports from/ Import to South Africa (US dollars, millions)
(From IMF DATA)
Table 2. Gross Domestic Product (in Billions, US dollars) of South Africa
2009 2010 2011 2012 2013
GDP 273.14 284.18 365.21 403.89 382.34
(From International Financial Statistics (IFS))
Table 3. recent economic situation of China and South Africa
Country South Africa China
Population 51,770,560 1,354,040,000
GDP (nominal)1 $390.9 $8,250.2
HFCE1(Household final consumption expenditure) $173.8 $1,835.3 Government spending1 $95.27 $2,031.0 Exports1 $101.2 $2,021.0 Imports1 $106.8 $1,780.0 GDP per capita $11,300 $9,100 Literacy rate 86.4% 92.2% Life expectancy 51.2 72.7 HDI(Human Development Index) .629 (Medium) .699 (Medium) (from Wikipedia.org) *1$US billions China, P.R: Mainland 2005 2006 2007 2008 2009 2010 2011 export 1376.10 2085.13 4166.58 4383.69 5626.69 10385.08 12423.69 import 5421.51 7494.81 9443.94 11010.17 12694.28 11887.90 15629.98
30
Table 4. South Africa's main imports of Chinese products
Categories 2009(Million
dollars)
Share in South Africa’s imports from China
Total value 8494 100%
Engine, electrical, audio-visual equipment and spare parts
1895 22.3%
Nuclear reactors, boilers, machinery and mechanical appliances
1841 21.7%
Footwear, gaiters and similar articles, and parts thereof
417 4.9%
Clothing and accessories not knitted 360 4.2%
Knitted garments and accessories 315 3.7%
Steel products 255 3.0%
Toys, games and sporting goods and spare parts
240 2.8%
Furniture, bedding, lamps 231 2.7%
Plastics and articles thereof 210 2.5%
Organic chemicals 199 2.3%
Vehicles and spare parts 176 2.1%
Steel and cast iron 165 1.9%
Optical photography, medical equipment and spare parts
125 1.5%
Leather goods, travel bags 124 1.5%
Rubber and articles thereof 116 1.4%
Ceramic products 113 1.3%
Inorganic chemicals, precious metal compounds
107 1.3%
Various base metals 83 1.0%
Other textile products 79 0.9%
31
Table 5. South Africa’s main exports to China
Categories 2009(Million
dollars)
Share in South Africa’s exports to China
Total value 5798 100%
Sand ore crushed, 3463 59.7%
Steel and cast iron 1044 18.0%
Jewelry, precious metals, coins 243 4.2%
Mineral fuels, mineral oils and products of asphalt
213 3.7%
Wool and other animal hair; son and tissues 129 2.2%
Copper and articles thereof 110 1.9%
Plastics and products made from these materials
95 1.7%
Aluminium and articles thereof 87 1.5%
Nickel and articles thereof 82 1.4%
Wood pulp and other fibrous cellulosic material, waste paper and cardboard
79 1.4%
Organic chemicals 50 0.9%
Inorganic chemicals, precious metal compounds
40 0.7%
Nuclear reactors, boilers, machinery and mechanical appliances
27 0.5%
Leather 18 0.3%
Salt, sulfur, earths and stone, lime and cement
16 0.3%
Various chemicals 12 0.2%
32
Table 6: Effects of Sectorial exports
Changes in % export (to China) share Variation in demand Exports to China FOB price for exports to China Exports to the rest of the world
FOB price for exports to the rest of the world Total exports Price of exports
Agriculture, forestry & fishing 13.37 20 11.96 2.34 -1.14 0.38 0.62 0.67
Gold 28.87 20 9.64 -0.23 -2.90 0.99 0.75 1.61
Other Mining 28.87 20 10.86 2.67 -1.91 0.64 1.81 1.27
Textiles 44.55 20 11.84 2.37 -1.77 0.60 4.33 1.63
Non-metallic minerals 10.63 20 11.98 2.33 -1.05 0.35 0.35 0.58
Basic non-ferrous metals 10.63 20 11.83 2.38 -1.05 0.35 0.33 0.58
Furniture 12.85 20 13.26 1.94 -0.75 0.25 0.79 0.24
Other industries 18.49 20 12.65 2.13 -1.57 0.53 1.08 0.97
Wholesale & retail trade 12.85 20 11.57 2.46 -1.20 0.40 0.46 0.68
Other 1.61 0 -0.72 0.26 -0.59 0.20 -0.58 0.17
All 8.81 9.41 0.58 -0.92 0.25 0.00 0.30
33
Table 7: Effects of Sectorial output
VARIATION in % Output share Export share Local sales Producer price Value added price Returns to capital Total output
Agriculture, forestry & fishing 2.47 20.12 -0.05 0.52 0.66 0.70 0.09
Other Mining 5.64 54.97 -0.34 0.58 0.96 1.24 0.56
Textiles 0.59 12.21 0.25 0.48 0.81 1.18 0.75
Non-metallic minerals 0.76 7.52 0.36 0.53 0.99 1.17 0.36
Basic non-ferrous metals 0.82 45.37 -0.01 0.48 0.90 0.97 0.15
Furniture 0.43 35.54 0.31 0.47 0.65 0.89 0.48
Other industries 1.44 12.13 0.20 0.48 1.71 1.32 0.31
Wholesale & retail trade 10.43 1.25 0.11 0.56 0.63 0.69 0.12
Food 3.86 6.19 0 0.52 0.55 0.52 -0.05
Beverages & tobacco 1.47 15.72 0.09 0.53 0.50 0.47 -0.06
Wearing apparel 0.50 8.74 0 0.45 0.56 0.52 -0.07
Leather & leather products 0.16 35.01 -0.25 0.50 0.30 0.08 -0.44
Footwear 0.11 4.10 -0.14 0.53 0.48 0.40 -0.17
Wood & wood products 0.69 10.60 0.15 0.53 0.58 0.61 0.06
Paper & paper products 1.26 13.34 -0.05 0.47 0.48 0.41 -0.14
Printing, publishing & recorded media 0.66 3.86 0.05 0.52 0.57 0.58 0.02
Coke & refined petroleum products 2.44 11.22 0.03 0.45 0.43 0.41 -0.03
Basic chemicals 1.94 29.61 -0.22 0.44 0.28 0.12 -0.33
Other chemicals & man-made fibres 2.43 8.86 -0.05 0.48 0.52 0.47 -0.11
Rubber products 0.27 20.44 -0.07 0.47 0.53 0.42 -0.21
Plastic products 0.84 5.30 0.04 0.48 0.57 0.57 0
Glass & glass products 0.19 11.32 -0.07 0.53 0.50 0.42 -0.15
Basic iron & steel 2.25 55.98 -0.10 0.45 0.24 0.05 -0.38
Metal products excluding machinery 1.43 15.23 0.15 0.48 0.58 0.59 0.02
Machinery & equipment 1.36 59.88 0.20 0.47 0.48 0.27 -0.42
Electrical machinery 0.90 12.08 0.35 0.52 0.63 0.75 0.24
Television, radio & communication equipment
0.24 44.93 0.09 0.53 0.48 0.37
-0.23 Professional & scientific equipment 0.13 67.29 -0.18 0.48 0.18 -0.18 -0.73
Motor vehicles, parts & accessories 4.59 17.18 0.06 0.48 0.55 0.53 -0.04
Other transport equipment 0.32 26.07 -0.30 0.49 0.51 0.30 -0.42
Electricity, gas & steam 1.49 0.93 0.12 0.48 0.66 0.72 0.12
Water supply 0.57 0 0.06 0.49 0.63 0.66 0.06
Building construction 4.54 0.06 0.56 0.56 0.79 1.07 0.55
Catering & accommodation services 1.09 17.27 0.03 0.54 0.49 0.44 -0.11
Railway transport 0.49 15.39 0.08 0.49 0.55 0.53 -0.04
Road transport 3.36 7.42 0.09 0.46 0.60 0.61 0.04
Transport via pipeline 0.03 16.04 0.13 0.51 0.54 0.53 -0.01
Water transport 0.50 13.52 0.06 0.49 0.50 0.48 -0.05
Air transport 0.41 20.37 -0.08 0.42 0.53 0.42 -0.21
Transport support services 1.05 9.87 0.02 0.49 0.53 0.51 -0.05
Communication 4.12 6.92 0.05 0.53 0.57 0.57 0.00
Finance & insurance 6.33 1.25 0.03 0.57 0.58 0.59 0.02
Business services 9.70 6.12 0.10 0.52 0.63 0.65 0.05
Medical, dental & other health & veterinary services
2.45 0.60 0.02 0.55 0.58 0.59
0.02 Community, social & personal services 2.78 5.68 -0.13 0.53 0.58 0.62 0.07
Government: General administration 1.81 0 -0.47 0.50 0.55 0.30 -0.49
Government: Defence 0.75 0 -0.47 0.42 0.49 0.28 -0.42
Government: Law and order 1.52 0 -0.50 0.50 0.53 0.29 -0.49
Government: Education 2.99 0 -0.51 0.52 0.53 0.27 -0.51
Government: Health 1.45 0 -0.49 0.50 0.55 0.30 -0.50
Government: Social 1.07 0 -0.48 0.49 0.53 0.29 -0.48
34
TOTAL 1.92 11.97 -0.04 0.49 0.57 0.54 0.01
From Author’s calculation
Table 8: Macroeconomic impacts
% Variation Government income 0.58 Public deficit -14.24 Firm savings 0.64 Household savings 0.58 Foreign savings 0
Total investment expenditures 0.67
Real GDP at market prices 0.16
Wage rate 0.57
Nominal household income/consumption 0.58
Consumer price index 0.45
Real household consumption 0.14
From Author’s calculation
Table 9: Effects of Sectorial imports
Changes in % import (from
China) share Share of imports in local consumption Domestic price of imports from China Imports from China imports from the rest of the world Total imports Price of imports Textiles 44.55 25.04 -7.56 17.13 -7.93 2.99 -3.60 Wearing apparel 62.10 25.98 -5.70 10.96 -7.30 3.91 -3.62 Leather products 61.49 25.22 -9.27 16.75 -12.85 5.01 -6.01 Footwear 61.49 46.47 -6.70 12.73 -8.70 4.30 -4.25 Wood products 26.78 11.21 -8.96 26.02 -5.00 3.02 -2.64 Glass products 22.52 17.32 -8.85 25.70 -4.90 1.74 -2.19 Non-metallic minerals 10.86 14.20 -9.30 30.90 -2.39 1.06 -1.13 Basic non-ferrous metals 10.86 25.61 -9.42 30.63 -2.97 0.51 -1.15 Metal products excluding machinery 22.18 18.49 -9.13 26.65 -5.03 1.73 -2.24 Machinery & equipment 13.85 76.30 -7.45 23.23 -2.54 0.91 -1.08 Electrical machinery 13.85 26.84 -8.18 25.63 -2.90 0.90 -1.22 Professional & scientific equipment 13.85 83.87 -5.22 15.49 -2.08 0.29 -0.66 Furniture 11.40 20.36 -5.49 17.53 -1.16 0.92 -0.56 Other industries 32.17 25.63 -6.10 14.89 -5.18 1.13 -2.02
Wholesale & retail trade 11.40 0.06 -10 33.39 -2.76 1.16 -1.31 Other 3.63 12.07 0.03 0.15 0.18 0.18 0.03 All 8.73 13.38 -2.84 13.51 -0.70 0.50 -0.87
35
Table 10: Effects of Sectorial output
VARIATION in % Output share Local sales Producer price Value added price Returns to capital Total output Textiles 0.59 -1.56 0.03 -0.12 -0.83 -1.41 Wearing apparel 0.50 -0.60 -0.05 0.25 -0.03 -0.55
Leather & leather products 0.16 -3.32 0.03 -1.11 -2.26 -2.31
Footwear 0.11 -3.17 -0.11 -1.31 -2.81 -3.02
Wood & wood products 0.69 -0.36 0.20 0.25 0.08 -0.35
Glass & glass products 0.19 -0.48 0.24 0.10 -0.13 -0.46
Non-metallic minerals 0.76 0.18 0.17 0.50 0.57 0.15
Basic non-ferrous metals 0.82 -0.16 0.18 0.09 0.04 -0.11
Metal products excluding machinery 1.43 -0.12 0.06 0.29 0.22 -0.15
Machinery & equipment 1.36 0.44 0.15 0.38 0.53 0.29
Electrical machinery 0.90 0.26 0.14 0.38 0.49 0.22
Professional & scientific equipment 0.13 -0.12 0.19 0.25 0.18 -0.14
Furniture 0.43 0.31 0.07 0.36 0.46 0.21
Other industries 1.44 0.17 -0.02 0.51 0.56 0.10
Wholesale & retail trade 10.43 0.17 0.30 0.41 0.49 0.17
Agriculture, forestry & fishing 2.47 -0.01 0.15 0.26 0.22 -0.07
Other Mining 5.64 -0.11 0.16 0.19 0.09 -0.19
Food 3.86 0.03 0.24 0.32 0.33 0
Beverages & tobacco 1.47 0.18 0.27 0.43 0.48 0.09
Paper & paper products 1.26 0.04 0.10 0.32 0.32 0
Printing, publishing & recorded media 0.66 0.13 0.19 0.33 0.39 0.11
Coke & refined petroleum products 2.44 0.03 0.22 0.31 0.30 0
Basic chemicals 1.94 -0.20 0.17 0.13 0.03 -0.21
Other chemicals & man-made fibres 2.43 -0.09 0.15 0.27 0.22 -0.11
Rubber products 0.27 0.01 0 0.31 0.29 -0.05
Plastic products 0.84 0.05 0.01 0.33 0.34 0.03
Basic iron & steel 2.25 0.04 0.18 0.26 0.22 -0.08
Television, radio & communication equipment 0.24 0.14 0.15 0.31 0.30 -0.02
Motor vehicles, parts & accessories 4.59 0.43 0.10 0.37 0.43 0.12
Other transport equipment 0.32 -0.11 0.21 0.30 0.23 -0.15
Electricity, gas & steam 1.49 0.08 0.24 0.38 0.42 0.08
Water supply 0.57 0.07 0.17 0.39 0.43 0.07
Building construction 4.54 0.47 0.26 0.50 0.74 0.47
Catering & accommodation services 1.09 0.12 0.30 0.35 0.36 0.03
Railway transport 0.49 0.02 0.23 0.31 0.29 -0.04
Road transport 3.36 0.06 0.21 0.34 0.36 0.03
Transport via pipeline 0.03 0.01 0.20 0.21 0.19 -0.04
Water transport 0.50 -0.05 0.19 0.19 0.15 -0.09
Air transport 0.41 0.04 0.21 0.32 0.30 -0.03
Transport support services 1.05 0.02 0.25 0.31 0.30 -0.02
Communication 4.12 0.12 0.28 0.43 0.48 0.09
Finance & insurance 6.33 0.08 0.30 0.36 0.40 0.07
Business services 9.70 0.12 0.29 0.43 0.47 0.09
Medical, dental & other health & veterinary services
2.45 0.10 0.26 0.37 0.41
0.09
Community, social & personal services 2.78 0.13 0.28 0.34 0.39 0.11
Government: General administration 1.81 -0.23 0.23 0.31 0.20 -0.23
Government: Defence 0.75 -0.19 0.19 0.29 0.19 -0.19
Government: Law and order 1.52 -0.26 0.26 0.30 0.17 -0.26
Government: Education 2.99 -0.28 0.28 0.30 0.16 -0.28
Government: Health 1.45 -0.25 0.25 0.31 0.19 -0.25
Government: Social 1.07 -0.24 0.24 0.30 0.18 -0.24
Government: Economic 0.88 0.20 0.21 0.31 0.21 -0.20
36
From Author’s calculation
Table11: Macroeconomic impacts
% Variation
Government income 0.28
Public deficit -8.10
Savings of type businesses 0.33
Savings of type households 0.31
Rest-of-the-world savings 0
Total investment expenditures 1.22
Real GDP at market prices 0.24
Wage rate 0.32
Nominal household income/consumption 0.31
Consumer price index 0.08
Real household consumption 0.22