Direct visualization of the Campbell regime in superconducting stripes
R. B. G. Kramer, G. W. Ataklti, V. V. Moshchalkov, and A. V. SilhanekInstitute for Nanoscale Physics and Chemistry (INPAC), Nanoscale Superconductivity and Magnetism Group, K.U.Leuven, Celestijnenlaan 200D, B-3001 Leuven, Belgium
共Received 23 February 2010; published 19 April 2010兲
A combination of scanning Hall microscopy and scanning ac-susceptibility measurements in superconduct-ing stripes共ribbons兲 of width w⬍10 m was used to observe the dimensional phase transitions of the vortex lattice and its stability under alternating fields. At low dc magnetic fields applied perpendicularly to the plane of the stripes, vortices form a one-dimensional chain at the center of the stripes. Above a certain field Hⴱ共w兲, the vortex chain splits in two parallel rows displaced laterally in such a way that a zigzag vortex pattern is observed. By shaking the vortices with an external magnetic ac field and detecting their in-phase motion locally, we can identify the degree of mobility of each individual vortex. This technique allows us共i兲 to directly visualize the transition from intravalley共Campbell regime兲 to intervalley vortex motion as the amplitude of the ac modulation is increased and共ii兲 to accurately determine the temperature at which the vortex lattice freezes in a field-cooling experiment.
DOI:10.1103/PhysRevB.81.144508 PACS number共s兲: 74.78.Na, 74.25.N⫺
The hallmark of type II superconductivity is the presence of quantized magnetic flux encircled by a rotating conden-sate of paired electrons when a sufficiently strong magnetic field is applied. The free motion of these fluxons leads to dissipation thus destroying the perfect conductivity of the system. The ever growing electricity demand has motivated for several decades a fierce strive for understanding, improv-ing, and optimizing the mechanisms to prevent the fluxon’s motion by introducing a rich diversity of pinning centers.1
Among the most powerful experimental methods used to determine the efficiency of pinning sites is the ac-susceptibility technique which consist of shaking the flux-line lattice with a small alternating magnetic field while recording its in-phase magnetic response.2 Pioneering
theo-retical works by Campbell and co-workers substantially con-tributed to comprehend and interpret the ac response of a superconducting system.3,4 In the most simple version, two
different regimes with distinctive ac responses can be iden-tified. For a gentle ac shacking, flux lines oscillate inside the pinning potential following a reversible and low dissipative motion共Campbell regime兲. By increasing the strength of the ac excitation, the intravalley vortex motion first senses the anharmonicities of the potential well and eventually switches to an intervalley motion where vortices can hop from one pinning site to another.5
So far, all the experimental and theoretical reports are focused on global ac-susceptibility investigations where the recorded signal represents an average over millions of flux lines each of which trapped in a different pinning potential and subjected to a different environment.6–8In this paper, we
introduce a local vortex imaging technique with single-vortex resolution which allows us to directly visualize the oscillatory motion of individual vortices submitted to har-monic ac excitations. The system to investigate consists of superconducting ribbons which, due to the proximity of the flux lines to the border, are particularly suitable for an effi-cient vortex shaking with an alternating external field. Scan-ning Hall microscopy characterization of the superconduct-ing stripes done after field-coolsuperconduct-ing procedure shows that at low fields, vortices sit at the center of the stripes forming a
one-dimensional chain. At higher fields, this chain becomes unstable due to the strong vortex-vortex interaction and it splits in two lines of vortices. By scanning ac-susceptibility microscopy 共SSM兲, we demonstrate that, due to symmetry considerations, vortices located at the center of the stripe cannot be displaced by the external ac field. In contrast to that, off-center vortices which are either trapped by a pinning center or due to a zigzag vortex configuration, can be easily excited by the external ac field. We present direct observa-tion of the transiobserva-tion from intravalley to intervalley vortex motion by performing SSM at different ac amplitudes. Fur-thermore, this technique also allows us to unambiguously determine the temperature at which the flux-line lattice is frozen in a typical field-cooling procedure.
The investigated samples consist of Pb ribbons 0.5 mm long, 50 nm thick, and width ranging from 4 to 9 m in steps of 1 m. The patterning was performed by e-beam lithography onto a SiO2 substrate covered with a double resist layer. The Pb deposition was done via electron-beam evaporation at 10−8 Torr nominal pressure while cooling the substrate with liquid nitrogen. The resulting stripes exhibit a superconducting transition at Tc= 7.20 K
with a residual resistivity 0= 1.75 ⍀ cm. From the slope of the superconducting-normal phase boundary and 0, we estimate, following Ref. 9, a superconducting coherence length at zero temperature 共0兲⬃34 nm and penetration depth 共0兲⬃52 nm.
In order to identify the field at which vortices first pen-etrate into the superconducting stripes and the different vor-tex configurations occurring at higher fields, we first ac-quired a series of scanning Hall-probe microscopy 共SHPM兲 images using a modified low-temperature scanning Hall-probe microscope from Nanomagnetics Instruments.10 In all
cases, a field-cooling procedure is made before scanning the Hall probe at a scan speed of 60 m/s. Figure1summarizes the different vortex configurations obtained at different fields and for several widths w of the Pb ribbons. Two characteris-tic fields, Hp and Hⴱ, are indicated in this figure. For H
⬍Hp, the stripe is in the Meissner state as shown in Fig.1共a兲
for the 5-m-wide sample. At H = Hp, the first vortex enters
PHYSICAL REVIEW B 81, 144508共2010兲
into the stripe 关see Fig.1共b兲and the corresponding point in the main panel兴. Further increasing the field leads to the pen-etration of additional vortices and consequently to a progres-sive compression of the vortex row 关Figs.1共c兲–1共g兲兴. At H = Hⴱ, the vortex row undergoes a buckling transition and splits in two chains forming a zigzag pattern关Fig.1共h兲兴. As expected, the wider the stripe the shallower the confining potential and therefore the smaller Hⴱ.11Interestingly, further
increasing the field, first an almost square array of vortices is observed12 before a more disordered configuration is
achieved. The field Hpat which the first vortex penetrates in
narrow stripes and the formation of different vortex patterns have been previously investigated both theoretically12–20and
experimentally.21–28Similarly to early scanning Hall
experi-ments performed by Stan et al.27 in Nb stripes, our
determi-nation of Hpis about four times larger than the one predicted
theoretically.
In order to investigate the stability of the different vortex configurations under small ac excitations, we used a technique29 consisting of picking up the local ac signal with
the Hall cross at the same frequency than the oscillating field
hac. Figure 2共a兲shows the in-phase signal共
⬘
兲 and theout-of-phase signal共
⬙
兲 as a function of temperature T when the Hall cross is situated at the center of a 7-m-wide ribbon atH = 0 G, ac amplitude hac= 1 G and frequency f = 77.5 Hz.
As in the standard ac-susceptibility technique,
⬘
accounts for the ability of the system to screen out the oscillating field whereas⬙
is related to the irreversibilities. For demonstra-tion of the working principle, we performed SHPM 关Figs.2共b兲 and2共c兲兴 and SSM 关Fig.2共d兲兴 at the extreme end of a 9-m-wide Pb stripe after field cooling at H = 1.3 G down to
T = 7 K.
The two circles in Figs.2共b兲and2共c兲indicate the position of the vortices after field cooling. Figure2共b兲 was then
ob-tained at the maximum of a hac= 1 G ac oscillation, i.e., H
+ hac⬃2.3 G whereas Fig. 2共c兲 was recorded at the
mini-mum of the oscillation H − hac⬃0.3 G. The relative
dis-placement of the vortices with respect to the equilibrium position becomes apparent. The scanning ac-susceptibility microscopy image obtained under the same ac excitation 关Fig. 2共d兲兴 shows that the resulting periodic oscillation of these vortices gives rise to two distinct spots corresponding to positive 共yellowish or brighter兲 and negative 共blue or darker兲 pickup ac signal. The physical origin of these two spots can be directly correlated with the images in Figs.2共a兲
and2共b兲. When the external field is increased, the screening currents push the vortices toward the center of the sample and consequently the Hall signal increases when scanning in those areas where vortices move into. At the same time, i.e., while hac共t兲 is increasing, the signal decreases near the
bor-der of the sample. This decrease in the signal is 180° out-of-phase with respect to the excitation and therefore appears as a dark spot. The SSM signal not only detects the motion of vortices but also the oscillation of the screening current next to the sample border. This is clearly seen in Fig.2共e兲where a cross section of the SSM image is shown along the dotted black line indicated in Fig.2共d兲. Notice that the amplitude of the susceptibility vs position exhibits two peaks at the samples’ borders. These peaks are surprising since they seem to indicate a negative screening. However, it is easy to show that they arise from an amplification of the fields at the samples’ borders due to demagnetization effects.
In Fig.3, we illustrate further the power of this technique for visualizing the vortex mobility at different vortex
con-3 4 5
H
* H (G ) (b) (c) (d) (e) (f) (g) (d) (e) (f) (g) (h) 7 µm 4 5 6 7 8 9 10 1 2H
pH
w(µm) (a) (h) (a) (c) (b) ( )FIG. 1. 共Color online兲 Main panel: transition field, Hp, from
Meissner state to vortex penetration and from single-to-double-row vortex configuration, Hⴱ, as a function of stripe width w. The lines are a guide to the eyes. The insets show scanning Hall-probe mi-croscopy images in a 7⫻14 m2 area for the 5-m-wide stripe obtained at 4.2 K after field cooling. Insets 共a兲–共h兲 correspond to different fields as indicated by square open symbols in the main panel.
(a)
(b)
(e)
(c)
(d)
FIG. 2.共Color online兲 共a兲 In-phase 共⬘兲 and out-of-phase 共⬙兲 ac signal picked up by the Hall cross located at the center of a 7 m stripe, using an ac amplitude of 1 G and a frequency of f = 77.5 Hz.共b兲 and 共c兲 Scanning Hall-probe images of a 9-m-wide stripe field cooled at H = 1.3 G to 7 K and then applying 2.3 G and 0.3 G, respectively.共d兲 Scanning ac-susceptibility image acquired at 7 K with ac amplitude 1 G and frequency f = 77.5 Hz. Dots in 共b兲–共d兲 indicate the average vortex position. The image size is 14⫻14 m2.共e兲 ac-susceptibility line profile along the dashed line in panel共d兲.
KRAMER et al. PHYSICAL REVIEW B 81, 144508共2010兲
figurations, i.e., dc fields, for the 9 m stripe at 4.2 K. The upper row shows the SHPM images whereas the bottom row shows the simultaneously acquired SSM pictures. In order to stress the contrast due to the vortex motion, in the SSM images we have subtracted the smooth background produced by the screening currents. The leftmost column of Fig. 3, obtained at H = 1 G, shows a single vortex located at the equator of the stripe. This very symmetric position makes that the force produced by the Meissner currents running at the upper edge of the stripe cancel out the force due to the supercurrents at the lower edge of the stripe, thus leading to an almost undetectable ac signal in the SSM image. In this case, the symmetry is only broken by the current bending at the end of the stripe which induces a vortex displacement mainly in the east-west direction.
The middle column in Fig.3 shows a five-vortex pattern obtained after field cooling at H = 1.3 G forming an inverted N-shape structure which appears as a precursor of the zigzag pattern. Interestingly, only four out of five vortices seem to move as a response to the external oscillatory field. This lack of motion of the central vortex can be understood as a result of a highly symmetric environment of both, the Meissner screening currents and the surrounding vortices. The right-most column of Fig. 3 shows a disordered vortex zigzag pattern obtained at H = 2.5 G. The most obvious feature of this figure is the alternating vortex lattice compression and decompression in the direction perpendicular to the sample’s borders as a result of the oscillating ac field. Notice that both the fully compressed and decompressed lattices still retain the zigzag structure, pointing out to the robust stability of this particular vortex distribution. This is in agreement with the wide range of field where this particular vortex pattern is observed.
As already pointed out by Campbell, vortex shaking in-side the pinning potential well can only occur for moderate ac amplitudes hac. In other words, beyond a certain
oscilla-tion amplitude, vortices can make excursions out of the pin-ning range. The most distinctive feature of this transition from intravalley to intervalley vortex motion is that the
low-amplitude phase retains the original vortex configuration whereas in the latter, the initial vortex distribution can be altered. In order to observe this transition with single-vortex resolution, we performed a series of SHPM and SSM in the 9 m sample at fixed temperature T = 7 K and field H = 1.3 G while sweeping the ac amplitude hacfrom 0 to 2 G
in steps of 0.1 G. A summary of the results is shown in Fig.
4 where the upper row shows the SHPM images and the lower row shows the SSM frames. It is worth mentioning that the initial vortex distribution is obtained via a field-cooling process thus forcing the vortices to nucleate at the pinning sites. At low amplitudes共first column兲, a very weak SSM contrast evidences the small amplitude of oscillation of the vortex motion inside the pinning potential. For hac
= 0.7 G 共second column兲, the oscillatory motion of the two vortices, toward the center of the sample and perpendicular to the end of the stripe, is apparent. This oscillatory motion around the pinning potential corresponds to the Campbell regime. At hac= 1.2 G共third column兲, a sudden loss of
con-trast in the SSM image results from the rearrangement of the vortex distribution to a more symmetric state. This transition which involves the depinning of vortices can be regarded as a local dynamically induced vortex ordering. For even higher ac amplitudes共fourth column兲, it is even possible to remove one of the vortices away from the sample.
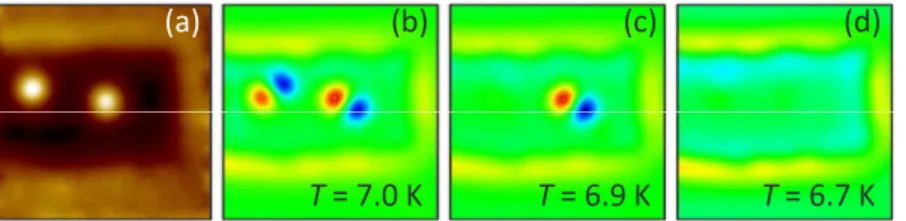
It is worth noticing that in order to be able to obtain a detectable SSM signal, the scanning has to be carried out at high temperatures where pinning is relatively weak. This is at odds with the standard SHPM for which the contrast is highly improved as temperature is lowered. The question now arises at which temperature the vortex lattice is frozen in a field-cooling experiment? This is a relevant question for several techniques where field-cooling processes are typi-cally used such as Bitter decoration or scanning Hall-probe microscopy.10,30 In order to address this issue, we investi-gated the vortex mobility via SSM in the 9 m sample, at
H = 1.3 G using hac= 1 G while decreasing temperature in
steps of 0.1 K. The main results are shown in Fig.5 where panel共a兲 shows the SHPM image after field cooling at 4.2 K indicating the frozen vortex pattern, and panels共b兲–共d兲 show SSM images for different temperatures. At T = 7 K, both vor-H = 1 G H = 1.3 G H = 2.5 G Sc anning Hall Sc anning χac
FIG. 3. 共Color online兲 Scanning Hall-probe microscopy 共upper row兲 and simultaneously obtained scanning ac-susceptibility mi-croscopy共bottom row兲 images for three different fields 共different columns兲 for the 9-m-wide stripe at T=7 K.
hac= 0.1 G hac= 0.7 G hac= 1.2 G hac= 1.7 G Sc anning Ha ll Sc anning χac
FIG. 4. 共Color online兲 Vortex oscillation as a function of the ac amplitude hac. The upper row shows the scanning Hall microscopy images obtained at the end of a 9 m stripe, at T=7 K and H = 1.3 G. The lower row shows the simultaneously acquired scan-ning ac-susceptibility microscopy images. Different columns corre-spond to different hacalways at a frequency f = 77.5 Hz.
DIRECT VISUALIZATION OF THE CAMPBELL REGIME… PHYSICAL REVIEW B 81, 144508共2010兲
tices follow the ac excitation. This situation changes at T = 6.9 K where one of the vortices is able to oscillate inside the pinning potential whereas the other remains nearly still. At T = 6.7 K, two weak spots are indicative of very small vortex mobility. From this panels, we can unambiguously determine that the freezing temperature is about 6.8 K in the case of an ac excitation hac= 1 G. As expected, lower
ampli-tudes lead to higher freezing temperatures.
It is important to mention that attempts to measure the dependence of the vortex oscillation amplitude with hacshow
almost no dependence but rather a change in the contrast as shown in Fig. 4. This might indicate that the size of the pinning center is much smaller than the superconducting co-herence length.
In summary, we have introduced a technique, scanning ac-susceptibility microscopy, which permitted us to directly image the oscillatory motion of individual vortices under an external ac-field modulation. We show clear evidence that the transition from intravalley vortex motion 共Campbell re-gime兲 to intervalley vortex motion passes through a dynamic
ordering of the vortex lattice. Furthermore, we show that in a field-cooling experiment, the vortex lattice freezes at tem-perature very close to the critical temtem-perature. This tempera-ture could be determined accurately for 1 G modulation field. Despite the fact that superconducting stripes have been stud-ied intensively during the last decades, we provide different insights in the vortex patterns formation and their stability. The ac-susceptibility microscopy technique has been demon-strated to be a very powerful and promising tool that could be used, for instance, to directly visualize the length scale where ac fields penetrate in a superconducting sample 共Campbell penetration depth, critical state penetration depth, etc.兲
This work was supported by Methusalem Funding of the Flemish government, FWO-Vlaanderen, and the Belgian Inter-University Attraction Poles IAP Programmes. A.V.S. is grateful for the support from the FWO-Vlaanderen. The au-thors would like to thank Werner Gillijns for the critical reading of the manuscript.
1B. Maiorov, S. A. Baily, H. Zhou, O. Ugurlu, J. A. Kennison, P. C. Dowden, T. G. Hoelesinger, S. R. Foltyn, and L. Civale,
Nature Mater. 8, 398共2009兲.
2F. Gömöry,Supercond. Sci. Technol. 10, 523共1997兲. 3A. M. Campbell,J. Phys. C 4, 3186共1971兲.
4A. M. Campbell and J. E. Evetts,Adv. Phys. 21, 199共1972兲. 5C. J. van der Beek, V. B. Geshkenbein, and V. M. Vinokur,Phys.
Rev. B 48, 3393共1993兲.
6G. Pasquini, P. Levy, L. Civale, G. Nieva, and H. Lanza,Physica
C 274, 165 共1997兲; S. Raedts, A. V. Silhanek, V. V. Mosh-chalkov, J. Moonens, and L. H. A. Leunissen,Phys. Rev. B 73, 174514共2006兲.
7J. R. Clem and A. Sanchez,Phys. Rev. B 50, 9355共1994兲. 8E. H. Brandt,Phys. Rev. B 49, 9024共1994兲.
9P. H. Kes and C. C. Tsuei,Phys. Rev. B 28, 5126共1983兲. 10S. J. Bending,Adv. Phys. 48, 449共1999兲.
11A. J. Drew, M. W. Wisemayer, D. O. G. Heron, S. Lister, S. L. Lee, A. Potenza, C. H. Marrows, R. M. Dalgliesh, T. R. Charl-ton, and S. Langridge,Phys. Rev. B 80, 134510共2009兲.
12D. A. Luzhbin,Phys. Solid State 43, 1823共2001兲.
13C. Bolech, G. C. Buscaglia, and A. Lopez, Phys. Rev. B 52,
R15719共1995兲.
14G. Carneiro,Phys. Rev. B 57, 6077共1998兲.
15I. L. Maksimov and G. M. Maksimova, Pis’ma Zh. Eksp. Teor. Fiz. 65, 405共1997兲.
16G. M. Maksimova,Phys. Solid State 40, 1607共1998兲. 17J. J. Palacios,Phys. Rev. B 57, 10873共1998兲.
18E. Sardella, M. M. Doria, and P. R. S. Netto,Phys. Rev. B 60,
13158共1999兲.
19C. C. de Souza and J. A. Aguiar,Physica C 388-389, 673共2003兲. 20E. Bronson, M. P. Gelfand, and S. B. Field,Phys. Rev. B 73,
144501共2006兲.
21J. Guimpel, L. Civale, F. de la Cruz, J. M. Murduck, and I. K. Schuller,Phys. Rev. B 38, 2342共1988兲.
22S. H. Brongersma, E. Verweij, N. J. Koeman, D. G. de Groot, R. Griessen, and B. I. Ivlev,Phys. Rev. Lett. 71, 2319共1993兲.
23G. Karapetrov, J. Fedor, M. Iavarone, D. Rosenmann, and W. K. Kwok,Phys. Rev. Lett. 95, 167002共2005兲.
24A. Pan, M. Ziese, R. Hohne, P. Esquinazi, S. Knappe, and H. Koch,Physica C 301, 72共1998兲.
25U. Patel, S. Avci, Z. L. Xiao, J. Hua, S. H. Yu, Y. Ito, R. Divan, L. E. Ocola, C. Zheng, H. Claus, J. Hiller, U. Welp, D. J. Miller, and W. K. Kwok,Appl. Phys. Lett. 91, 162508共2007兲.
26B. L. T. Plourde, D. J. Van Harlingen, R. Besseling, M. B. S. Hesselberth, and P. H. Kes,Physica C 341-348, 1023共2000兲.
27G. Stan, S. B. Field, and J. M. Martinis, Phys. Rev. Lett. 92,
097003共2004兲.
28M. Ziese, P. Esquinazi, P. Wagner, H. Adrian, S. H. Brongersma, and R. Griessen,Phys. Rev. B 53, 8658共1996兲.
29M. P. DeFeo and M. Marchevsky, Phys. Rev. B 73, 184409
共2006兲.
30Y. Fasano and M. Menghini, Supercond. Sci. Technol. 21,
023001共2008兲.
(a)
(b)
(c)
(d)
T = 7.0 K
T = 6.9 K
T = 6.7 K
FIG. 5. 共Color online兲 Scanning Hall-probe microscopy image of a 9-m-wide stripe obtained at 4.2 K and H = 1.3 G, after field cooling 共a兲. Panels 共b兲–共d兲 show scanning ac-susceptibility microscopy images for the same vortex configuration than 共a兲, at three different temperatures.
KRAMER et al. PHYSICAL REVIEW B 81, 144508共2010兲