HAL Id: hal-02518263
https://hal.archives-ouvertes.fr/hal-02518263
Submitted on 20 Nov 2020
HAL is a multi-disciplinary open access
archive for the deposit and dissemination of
sci-entific research documents, whether they are
pub-lished or not. The documents may come from
teaching and research institutions in France or
abroad, or from public or private research centers.
L’archive ouverte pluridisciplinaire HAL, est
destinée au dépôt et à la diffusion de documents
scientifiques de niveau recherche, publiés ou non,
émanant des établissements d’enseignement et de
recherche français ou étrangers, des laboratoires
publics ou privés.
CrohnIPI: An endoscopic image database for the
evaluation of automatic Crohn’s disease lesions
recognition algorithms
Rémi Vallée, Astrid de Maissin, Antoine Coutrot, Harold Mouchère, Arnaud
Bourreille, Nicolas Normand
To cite this version:
Rémi Vallée, Astrid de Maissin, Antoine Coutrot, Harold Mouchère, Arnaud Bourreille, et al..
CrohnIPI: An endoscopic image database for the evaluation of automatic Crohn’s disease lesions
recog-nition algorithms. SPIE Medical Imaging, Feb 2020, Houston, France. pp.61, �10.1117/12.2543584�.
�hal-02518263�
CrohnIPI: An endoscopic image database for the evaluation
of automatic Crohn’s disease lesions recognition algorithms
R. Vall´
ee
a, A. De Maissin
b, A. Coutrot
a, H. Mouch`
ere
a, A. Boureille
b, and N. Normand
a aUniversit´
e de Nantes, CNRS, LS2N, F-44000 Nantes, France
b
CHU Nantes, Institut des Maladies de l’Appareil Digestif, CIC Inserm 1413, Universit´
e de
Nantes, Nantes, France
ABSTRACT
Wireless capsule endoscopy (WCE) allows medical doctors to examine the interior of the small intestine with a noninvasive procedure. This methodology is particularly important for Crohn’s disease (CD), where an early diagnosis improves treatment outcomes. The counting and identification of CD lesions in WCE videos is a time-consuming process for medical experts. In the era of deep-learning many automatic WCE lesion classifiers, requiring annotated data, have been developed. However, benchmarking classifiers is difficult due to the lack of standard evaluation data. Most detection algorithms are evaluated on private datasets or on unspecified subsets of public databases. To help the development and comparison of automatic CD lesion classifiers, we release CrohnIPI, a dataset of 3498 images, independently reviewed by several experts. It contains 60.55% of non-pathological images and 38.85% of pathological images with 7 different types of CD lesions. A part of these images are multilabeled. The dataset is balanced between pathological images and non-pathological ones and split into two subsets for training and testing models. This database will progressively be enriched over the next few years in aim to make the automatic detection algorithms converge to the most accurate system possible and to consolidate their evaluation.
Keywords: Dataset, Video Capsule Endoscopic, Deep learning, Crohn’s disease
1. INTRODUCTION
Since the mid-1990s, the development of wireless capsule endoscopy (WCE) improves the diagnosis of the Crohn’s disease (CD) and its early treatment.1 This minimally invasive technology offers significant diagnostic perfor-mance due to its ability to fully explore the 3 to 4 metres of the small bowel. It is now well accepted by the entire scientific community.2 The diagnosis of CD is based on two scores: the Capsule Endoscopy Crohn’s Disease Activity Index (CECDAI)3and Lewis’ score.4 These indicators depend on the number of lesions, their types and locations in the small bowel. As these scores are related to the number and precise identification of the lesions, it is necessary for gastroenterologists to view all 50,000 images generated by the WCE for each patient, which can be very time-consuming (30-60 minutes per read in most studies5).
Various systems have been developed to limit the time required for gastroenterologists to analyze the WCE data. These systems can be classified into 2 main categories. First, algorithms based on the extraction of well-identified features based on SVM.6–21 Second, algorithms based on deep neural networks.22–27 The latter obtain better classification performance but need more data in order to be trained properly. However, there is currently no public database to benchmark these algorithms. They are currently evaluated on different personal databases. The release of CrohnIPI comes to challenge this problem with 3498 carefully annotated images.
Collecting large scale medical databases is difficult due to the limited number of available experts able to deliver reliable annotations. The CrohnIPI database has been designed to compensate for this lack of precious resource, making available the WCE images along with multi-label, multi-expert annotations.
Further author information: (Send correspondence to R. Vall´ee and H. Mouch`ere) R. Vall´ee: E-mail: [email protected]
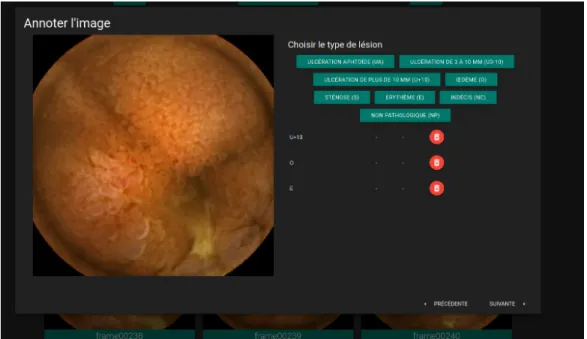
Figure 1. Annotation application screenshot
2. DATABASE DESCRIPTION
2.1 Method
The images that make up the database were collected using the PillCam3 and come from 63 different patients from the Nantes University Hospital. Their resolution is 320px by 320px. Table1describes the characteristics of the patients included in this database.
Table 1. Patient characteristics.
Patients, n 63
Women, n (%) 37 (40)
Age, median (IQR) 39 (28-49) Duration of illness in years, median (IQR) 9.7 (2-16)
The various examinations required to monitor Crohn’s disease were carried out using the PillCam3 video capsule, and generated approximately one million images. These images were initially reviewed during the clinical examination by the referring gastroenterologist of each patient. Then, in a second step, an external expert reviewed the videos and annotated certain images, with the aim of selecting images that varied both in terms of pathologies they contained and in term of viewing conditions (images containing bubbles, blurred, with lesions at the edge of focal fields, etc). In order to be able to train deep neural networks more easily, the expert selected, to the best of their knowledge, the same quantity of pathological and non-pathological images. The images reviewed during this second phase were reviewed in their context, i.e. in the full video stream. Thus the expert could use previous and future frames to annotate the current frame.
During this second phase, 3498 images have been annotated. In order to consolidate the annotations obtained, they were then reviewed by 3 independent experts thanks to an application developed by our team (see fig.1). In this last annotation phase, the images were seen out of context. Each image was reviewed independently of the previous and following images, and without any idea of the patient undergoing the examination.
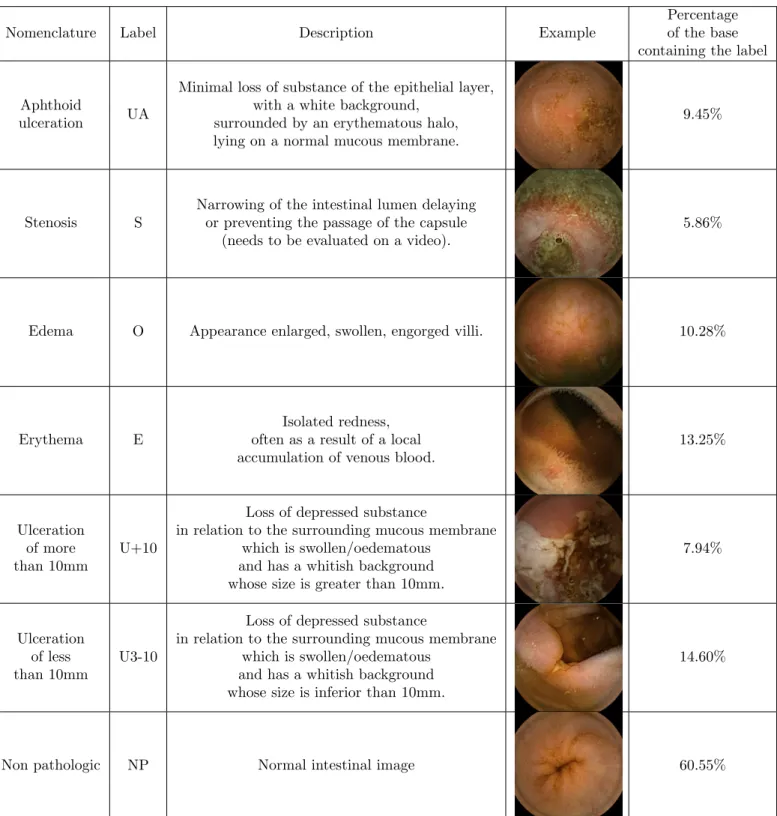
In both annotation phases the experts had the choice between 7 different non-exclusive labels. These different labels and their associated descriptions are presented in Table2. The possibility to answer “I don’t know” was also possible and referenced by the NC label.
Table 2. Label description and distribution in the database. 14% of the images have multiple labels (1.2 labels/image in average).
Nomenclature Label Description Example
Percentage of the base containing the label
Aphthoid
ulceration UA
Minimal loss of substance of the epithelial layer, with a white background,
surrounded by an erythematous halo, lying on a normal mucous membrane.
9.45%
Stenosis S
Narrowing of the intestinal lumen delaying or preventing the passage of the capsule
(needs to be evaluated on a video).
5.86%
Edema O Appearance enlarged, swollen, engorged villi. 10.28%
Erythema E
Isolated redness, often as a result of a local accumulation of venous blood.
13.25%
Ulceration of more than 10mm
U+10
Loss of depressed substance
in relation to the surrounding mucous membrane which is swollen/oedematous
and has a whitish background whose size is greater than 10mm.
7.94%
Ulceration of less than 10mm
U3-10
Loss of depressed substance
in relation to the surrounding mucous membrane which is swollen/oedematous
and has a whitish background whose size is inferior than 10mm.
14.60%
2.2 Dataset content
The proportion of each class is available in Table2. Frames containing the labels UA, U+10, U3-10, E, O and S have been grouped into a so-called pathological class. Once the different classes of CD lesion have been grouped in a single pathological class, we aggregate the votes of the 3 annotators of the third phase, as shown in Table3.
Table 3. Class distribution.
Label Non pathologic Pathologic Don’t know Total Selector 49.57% (1734 ) 46.60% (1630) 3.83% (134) 100% (3498) 3 annotators 60.55% (2118) 38.85% (1359) 0.60 % (21) 100% (3498)
We made the choice to provide all users with the raw data, i.e. with the labels provided by each annotator on each image. We hope that this will allow the development of techniques for merging label and multi-annotator annotations, in order to improve the automatic classification of pathological images.
Table 4. Agreement rate for the two classes “Pathological” and ”Non Pathological”.
Number of frame Percentage Complete agreement 2952 84.39%
2 vs 1 528 15.09%
Disagreement 18 0.51%
We calculated the agreements based on Fleiss’ kappa.28 We obtained an overall score of 78.35%, which corresponds to a good agreement rate. Table 4shows the percentage of the base where all three experts agree, almost agree ( 2 vs 1), and completely disagree (all different).
3. RESULTS
In this part we show the results obtained with state-of-the-art deep neural networks to establish a baseline. To evidence the importance of multi-expert annotation, we compare the results obtained by a model trained with a dataset annotated by a single annotator (the selector) to a model trained on a dataset annotated by several annotators. Most medical imaging databases rely on the diagnosis of only one annotator at a time. In order to evaluate the influence of a multi-expert annotation, we trained and tested state-of-the-art neural networks on the selector database and then trained and tested on the multi-annotation database. The results are presented in Table5and Table6. Images containing the label “Don’t know” (3.83%) have been excluded from the training and testing sets. To balance the sample size between the two sets of data, we removed from the multi-annotated database 134 images with the label “I don’t know” annotated by the selector, as the number of images with the “I don’t know” label is greater in the selector database than in the multi-annotated one.
Table 5. Results of different cross-validated training (5 folds) with only selector labels.
2 classes
Accuracy F1 score Precision Recall AUC ResNet3429 93.67% 93.39% 94.42% 92.39% 97.87%
ResNext30 93.01% 92.78% 93.10% 92.58% 97.82% VGG1931 92.60% 92.32% 93.21% 91.49% 97.15% VGG1631 92.48% 92.20% 92.83% 91.61% 97.55%
Table 6 shows that an increase in the quality of the annotations leads to a better performance for each network on each of the metrics. This improves the model in every way, as both the number of false positives and false negatives in the database are reduced. By merging the annotations by voting, the labels on each image become more robust. This makes it easier for the model to be trained, as the number of false positives and false negatives in the database is reduced.
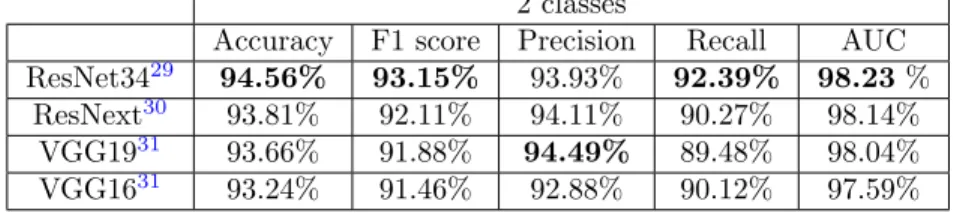
Table 6. Results of different cross-validated training (5 folds) with merged labels.
2 classes
Accuracy F1 score Precision Recall AUC ResNet3429 94.56% 93.15% 93.93% 92.39% 98.23 %
ResNext30 93.81% 92.11% 94.11% 90.27% 98.14% VGG1931 93.66% 91.88% 94.49% 89.48% 98.04% VGG1631 93.24% 91.46% 92.88% 90.12% 97.59%
The best performance is obtained with the ResNet34 network on the multi-annotation database, with an accuracy of 94.56% and a AUC (Area Under ROC Curve) of 98.23%.
4. CONCLUSION
We provide a dataset with 3498 WCE images independently reviewed by several gastroenterologist experts. 60.55% are non pathological, 38.85% present at least one of 7 different type of CD lesions. We chose to provide the raw annotated data, showing potential classification discrepancies between experts for some particularly ambiguous images. This approach repositions data quality at the center of the problem of evaluating deep learning algorithms in medical imaging. More specifically, it raises the question of handling label, multi-expert annotations for the training of models for the detection and identification of CD lesions. Such uncertainty, far from adding noise to the results, constitutes valuable information that the model can use to improve its performance.
This database will be further improved by carrying out a final phase of consensus building among the different experts to assign a final label to each litigious images. We will also continue to progressively enrich the database with new WCE images, and more labels assigned by more gastroenterologist experts. We hope that this database will become the gold standard for the evaluation of CD lesion detection algorithms
Data availability
Instructions to download the CrohnIPI dataset are available athttps://crohnipi.ls2n.fr/.
Acknowledgments
This work was supported in part by an unrestricted grant from the IBD patient’s association Fran¸cois Aupetit and the interdisciplinary project CrohnIPI of Nantes university (https://www.afa.asso.fr/).
REFERENCES
[1] Eliakim, R., “The impact of panenteric capsule endoscopy on the management of Crohn’s disease,” Thera-peutic Advances in Gastroenterology 10(9), 737–744 (2017).
[2] Luj´an-Sanchis, M., Sanchis-Artero, L., Larrey-Ruiz, L., Pe˜no-Mu˜noz, L., N´u˜nez-Mart´ınez, P., Castillo-L´opez, G., Gonz´alez-Gonz´alez, L., Clemente, C. B., Albert Antequera, C., Dur´a-Ayet, A., and Sempere-Garcia-Arg¨uelles, J., “Current role of capsule endoscopy in Crohn’s disease.,” World journal of gastroin-testinal endoscopy 8(17), 572–83 (2016).
[3] Gal, E., Geller, A., Fraser, G., Levi, Z., and Niv, Y., “Assessment and Validation of the New Capsule Endoscopy Crohn’s Disease Activity Index (CECDAI),” Digestive Diseases and Sciences 53(7), 1933–1937 (2008).
[4] Gralnek, I. M., Defranchis, R., Seidman, E., Leighton, J. A., Legnani, P., and Lewis, B. S., “Development of a capsule endoscopy scoring index for small bowel mucosal inflammatory change,” Alimentary Pharmacology & Therapeutics 27(2), 146–154 (2007).
[5] McAlindon, M. E., Ching, H.-L., Yung, D., Sidhu, R., and Koulaouzidis, A., “Capsule endoscopy of the small bowel,” Annals of Translational Medicine 4(19) (2016).
[6] Bejakovic, S., Kumar, R., Dassopoulos, T., Mullin, G., and Hager, G., “Analysis of crohn’s disease lesions in capsule endoscopy images,” in [2009 IEEE International Conference on Robotics and Automation ], 2793– 2798 (May 2009).
[7] Karargyris, A. and Bourbakis, N., “Identification of ulcers in wireless capsule endoscopy videos,” in [2009 IEEE International Symposium on Biomedical Imaging: From Nano to Macro ], 554–557 (2009).
[8] Girgis, H. Z., Mitchell, B. R., Dassopoulos, T., Mullin, G., and Hager, G., “An intelligent system to detect crohn’s disease inflammation in wireless capsule endoscopy videos,” 1373–1376 (2010).
[9] Jebarani, W. S. L. and Daisy, V. J., “Assessment of crohn’s disease lesions in wireless capsule endoscopy images using svm based classification,” in [2013 International Conference on Signal Processing , Image Processing Pattern Recognition ], 303–307 (2013).
[10] Hajo-Maghsoudi, O., Talebpour, A., Soltanian-Zadeh, H., and Haji-Maghsoodi, N., “Segmentation of crohn, lymphangiectasia, xanthoma, lymphoid hyperplasia and stenosis diseases in wce.,” Studies in health tech-nology and informatics 180, 143–7 (2012).
[11] Chen, Y. and Lee, J., “Ulcer detection in wireless capsule endoscopy video,” MM 2012 - Proceedings of the 20th ACM International Conference on Multimedia , 1181–1184 (2012).
[12] Charisis, V. S., Hadjileontiadis, L. J., Liatsos, C. N., Mavrogiannis, C. C., and Sergiadis, G. D., “Capsule endoscopy image analysis using texture information from various colour models,” Computer Methods and Programs in Biomedicine 107(1), 61–74 (2012).
[13] Eid, A., Charisis, V. S., Hadjileontiadis, L. J., and Sergiadis, G. D., “A curvelet-based lacunarity approach for ulcer detection from wireless capsule endoscopy images,” in [Proceedings of the 26th IEEE International Symposium on Computer-Based Medical Systems ], 273–278 (2013).
[14] Szczypi´nski, P., Klepaczko, A., Pazurek, M., and Daniel, P., “Texture and color based image seg-mentation and pathology detection in capsule endoscopy videos,” Computer Methods and Programs in Biomedicine 113(1), 396–411 (2014).
[15] Yeh, J.-Y., Wu, T.-H., and Tsai, W.-J., “Bleeding and ulcer detection using wireless capsule endoscopy images,” Journal of Software Engineering and Applications 07, 422–432 (2014).
[16] Iakovidis, D. and Koulaouzidis, A., “Automatic lesion detection in capsule endoscopy based on color saliency: Closer to an essential adjunct for reviewing software,” Gastrointestinal Endoscopy (2014).
[17] Yuan, Y., Wang, J., Li, B., and Meng, M. Q. ., “Saliency based ulcer detection for wireless capsule endoscopy diagnosis,” IEEE Transactions on Medical Imaging 34(10), 2046–2057 (2015).
[18] Charisis, V. S. and Hadjileontiadis, L. J., “Use of adaptive hybrid filtering process in crohn’s disease lesion detection from real capsule endoscopy videos,” Healthcare Technology Letters 3(1), 27–33 (2016).
[19] Liaqat, A., Khan, M. A., Shah, J. H., Sharif, M., Yasmin, M., and Fernandes, S. L., “Automated ulcer and bleeding classification from wce images using multiple features fusion and selection,” Journal of Mechanics in Medicine and Biology 18(04), 1850038 (2018).
[20] Alotaibi, S., Qasim, S., Bchir, O., and Ben Ismail, M. M., “Empirical comparison of visual descriptors for multiple bleeding spots recognition in wireless capsule endoscopy video,” in [Computer Analysis of Images and Patterns ], Wilson, R., Hancock, E., Bors, A., and Smith, W., eds., 402–407, Springer Berlin Heidelberg, Berlin, Heidelberg (2013).
[21] Souaidi, M. and Ansari, M. E., “Multi-scale analysis of ulcer disease detection from WCE images,” IET Image Processing 13(12), 2233–2244 (2019).
[22] Georgakopoulos, S. V., Iakovidis, D. K., Vasilakakis, M., Plagianakos, V. P., and Koulaouzidis, A., “Weakly-supervised convolutional learning for detection of inflammatory gastrointestinal lesions,” in [2016 IEEE International Conference on Imaging Systems and Techniques (IST) ], 510–514 (2016).
[23] Fan, S., Xu, L., Fan, Y., Wei, K., and Li, L., “Computer-aided detection of small intestinal ulcer and erosion in wireless capsule endoscopy images,” Physics in Medicine and Biology 63 (2018).
[24] Aoki, T., Yamada, A., Aoyama, K., Saito, H., Tsuboi, A., Nakada, A., Niikura, R., Fujishiro, M., Oka, S., Ishihara, S., Matsuda, T., Tanaka, S., Koike, K., and Tada, T., “Automatic detection of erosions and ulcer-ations in wireless capsule endoscopy images based on a deep convolutional neural network,” Gastrointestinal Endoscopy 89(2), 357 – 363.e2 (2019).
[25] Haya, A., Hussain, A., Al-Aseem, N., Liatsis, P., and Al-Jumeily, D., “Application of convolutional neural networks for automated ulcer detection in wireless capsule endoscopy images,” Sensors 19, 1265 (2019). [26] de Maissin, A., Gomez, T., Le Berre, C., Normand, N., Mouchere, H., Trang, C., and Bourreille, A., “P161
Computer aided detection of Crohn’s disease small bowel lesions in wireless capsule endoscopy,” Journal of Crohn’s and Colitis 12, S178–S179 (2018).
[27] Vall´ee, R., de Maissin, A., Coutrot, A., Normand, N., Bourreille, A., and Mouch`ere, H., “Accurate small bowel lesions detection in wireless capsule endoscopy images using deep recurrent attention neural network,” 2019 IEEE 21st International Workshop on Multimedia Signal Processing (MMSP) , 1–5 (2019).
[28] McHugh, M., “Interrater reliability: The kappa statistic,” Biochemia medica : ˇcasopis Hrvatskoga druˇstva medicinskih biokemiˇcara / HDMB 22, 276–82 (2012).
[29] He, K., Zhang, X., Ren, S., and Sun, J., “Deep residual learning for image recognition,” Computing Research Repository abs/1512.03385 (2015).
[30] Xie, S., Girshick, R. B., Doll´ar, P., Tu, Z., and He, K., “Aggregated residual transformations for deep neural networks,” Computing Research Repository abs/1611.05431 (2016).
[31] Simonyan, K. and Zisserman, A., “Very deep convolutional networks for large-scale image recognition,” Computing Research Repository abs/1409.1556 (2014).