Protein adsorption on preadsorbed polyampholytic monolayers
MAHLTIG B[1],WERNER C[1], MÜLLER M[1] JEROME R[2] ,STAMM M[1]
[1]
Institut für Polymer for schung Dresden e.V, Hohe Straβe 6, D-01069 Dresden, Germany
[2]
Centre for Education and Research on Macromolecules, University of Liège, Sart-Tilman B6, B-4000 Liège, Belgium
Abstract
The adsorption behaviour of five different globular proteins on pure silicon substrates and on
preadsorbed polyampholytic monolayers has been investigated as a function of protein concentration.. The prelayers were prepared by adsorption of the ampholytic diblock copolymer poly(methacrylic acid)-block-poly((dimethylamino)ethyl methactylate) (PMAA-b-PDMAEMA). This polyampholyte adsorbs in densely packed micelles directly from aqueous solution. Ellipsome-try was used to determine the amount of adsorbed polyampholyte and protein While ATR-IR spectroscopy gives information about the adsorption and desorption behaviour of the preadsorbed polyam-pholytic layer, the lateral structures of the dried films were investigated by scanning force microscopy (SFM). The amount of protein adsorbed was found to be strongly influenced by the preadsorbed polyampholyte compared to the adsorption on the pure silicon substrates. No displacement of the poly ampholyte by the proteins was detected. In most cases the protein adsorption was reduced by the preadsorbed polyampholytic layer. The observed trends are explained by the change in electrostatic and hydrophilic characteristics of the substrates. Furthermore, the entropy of adsorption has to be taken into account
Key words: Polyampholyte; protein; adsorption; ellipsometry; ATR-IR spectroscopy; SFM..
1. Introduction
Surface modification via adsorption of polyelectrolytes has been investigated by many groups in the last few years [1-3]. It is known that protein adsorption is strongly influenced by the properties of the substrate surface [4, 5]. Therefore, the protein adsorption on substrates modified by preadsorption of poly electrolytes shows a completely different behaviour compared with the unmodified substrates [6, 7]. Analogous effects were also found for surfaces carrying grafted polymers [8-10]. Instead of using single poly electrolytes for surface modification polyampholytes can also be used Polyampholytes are poly electrolytes consisting of oppositely-charged structural units.
This paper concerns protein adsorption on the preadsorbed diblock polyampholyte poly(methacrylic acid)-block-poly((dimethylamino)ethyl methacrylate) (PMAA-b-PDMAEMA), The behaviour in aqueous solutions [11, 12] and the adsorption on silicon surfaces [13-16] of this new polyampholyte system have been studied intensively before. The structure formation at the surface is characterized by the adsorption of whole micelles or bigger agglomerates directly from solution [14, 16].
Altogether, our experiments concern the adsorption of five different proteins from aqueous solutions on pure silicon substrates and substrates carrying preadsorbed polyampholytes. The
subsequently-adsorbed proteins were selected in order to probe the impact of different protein characteristics on the amount adsorbed at the solid/liquid interface. The investigations on the adsorbed polymers were performed by ellipsometry, attenuated total reflection (ATR)-IR spectroscopy, and scanning force microscopy (SFM).
2. Experimental
2.1. Polymers and proteins
Protein adsorption was performed on silicon substrates with and without a pread-sorbed polyampholyte layer,. All prelayers were formed via the adsorption of the amphilic diblock copolymer PMAA-b-PDMAEMA. The molecular weight of this polymer was 15 kD and the weight ratio of the two blocks
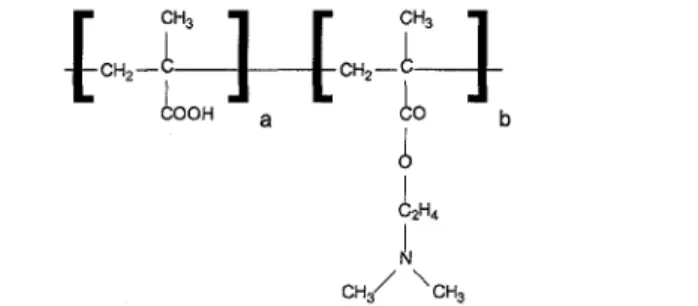
PMAA to PDMAEMA was 33:67 (Fig. 1). The polyampholyte was synthesized by a sequential anionic polymerization and characterized by gel permeation chromatography and 'H-NMR spectroscopy, as described in the literature [17—19]. The structure of adsorbed poly ampholyte contained a high regularity caused by the adsorption of whole polyampholytic micelles directly from solution. A monolayer of densely packed adsorbed micelles caused a complete coverage of the silicon substrate [20, 21], For all adsorption experiments the five proteins fibrinogen, ribonuclease, lysozyme, a-lactalbumin, and myoglobin (Sigma) were used. Some relevant characteristics of these proteins are shown in Table 1.
Figure 1. Schematic drawing of the polyampholyte structural units PMAA and PDMAEMA
Table 1. The secondary adsorbed proteins
Protein Molecular weight (D) pHIEP Mass density δ (gl-1) Fibrinogen 340000 5.5 [21] 0.72 [22] α-Lactalbumin 14200 4 .3 [4] 0.74 [23] Lysozyme 14 300 11.1 [4] 0.70 [23] Myoglobin 17 800 7.0 [4] 0 .75 [24] Ribonuclease 13 680 9.4 [4] 0.69 [23] 2.2. Sample preparation
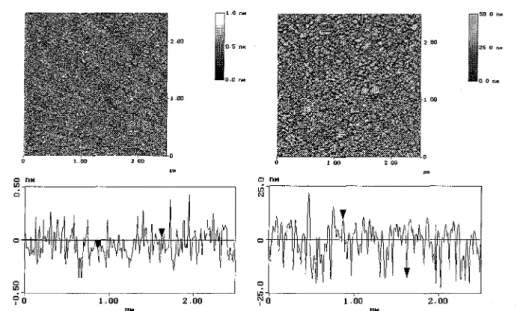
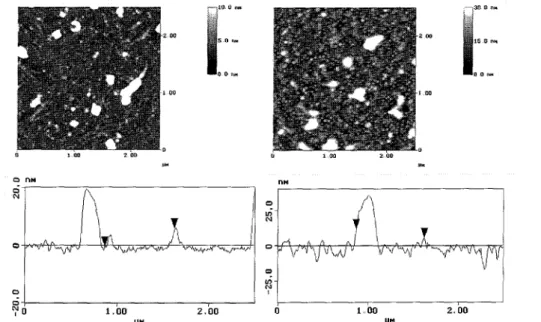
For all adsorption experiments silicon wafers with a native siliconoxide layer of approximately 2 nm thickness were used. These wafers were cleaned using an alkaline cleaning procedure, which determines the IEP of the silicon wafer to pHIEP = 3.8 [16], To adsorb the first polyampholyte layer, the cleaned wafers were placed for at least 10 h in an aqueous solution with 0.13 gl-1 poly ampholyte, 10 ΠI mMNaCl, and a pH of around 6.5, Afterwards the silicon wafers were taken out of the solution, rinsed with Milli-Pore water several times, and dried with nitrogen. Using these preparation conditions, the adsorbed amount of polyampholyte reached 15 mgm-2 and the substrates received an IEP of pHIEP = 8.3 [21]. Both types of substrates were characterized using ellipsometry and SFM, The SFM images of the substrates before protein adsorption are shown in Fig. 2, The rms-roughness of the substrates determined by SFM is around 0.1 nm after the alkaline treatment and around 10 nm for substrates covered with the polyampholyte layer.
The secondary protein adsorption was performed both on pure silicon substrates after the alkaline treatment and on preadsorbed polyampholytic layers. For these adsorption experiments the different prepared silicon substrates were placed in phosphate buffered (pH = 7,4) protein solutions for at least 10 h The experiments were carried out with different phosphate buffer concentrations from 1 up to 10
IΠM.The protein concentrations were set from 0.1 mg 1-1 up to 1.0 g 1-1.
Kinetic adsorption measurements were performed in a specially-designed glass cell (Hellma GmbH, Germany) by ellipsometry, First the cell with the silicon substrate inside was filled with an aqueous solution of 10 mM NaCl and the ellipsomet-ric angles recorded with time. After reaching constancy the polyampholyte adsorption was started by injection of an aqueous poly ampholyte solution. The
ellipsomet-tic angles were detected every 5 s until the adsorption process was finished, Then the polyampholyte solution was changed by a phosphate buffered protein solution and the ellipsometric angles were recorded again every 5 s.
Figure 2. SFM image of a pure alkaline pretreated silicon substrate without any protein treatment at a scan area of 2.5 µ.m x 2.5 µm (rms-roughness around 0.1 nm) and an SFM image of a silicon substrate containing an adsorbed polyampholyte layer without any protein treatment at a scan area of 2.5 µm x2.5 µm (rms-roughness around 10 nm). The adsorbed polyampholyte amount on this sample was ellipsometrically determined to be A = 15.6 mgm-2. Cross-sections of both SFM figures are shown below these images.
2.3. Ellipsometry
The amount of adsorbed polymer was determined using a computer controlled null ellipsometer in a polarizer-compensator-sample-analyser (PCSA) arrangement (Multiskop, Optrel, Berlin, Germany) [26]. A He-Ne laser with λ = 632.8 nm was used as a light source, The angle of incidence was set to 70 deg. The thickness of the adsorbed polymer layer d was calculated from the ellipsometric angles φ and ∆ using a multilayer model for a homogeneous film on top of the silicon wafer [27, 28].. The adsorbed amount A was calculated from the layer thickness d determined in air after the adsorption process by A = δd, where δ is the mass density of the adsorbed polymer layer and is 1.27 gl-1 for the polyampholyte, The mass densities of the different investigated proteins are reported in Table 1. For kinetic
measurements in aqueous solution the amount adsorbed was calculated using the de Feijter equation [29]:
(1)
n1 and n0are the refractive indices of the polymer layer and the aqueous polymer solution. The increment of the refractive index is dn/dc = 0,12.5 mlg-1 for polyampholyte and 0.183 mlg-1 for fibrinogen.
2.4. ATR-IR spectroscopy
The attenuated total reflection (ATR)-IR spectroscopy was used to monitor the adsorption of polyampholyte and protein seperately. All measurements were performed on the ATR-FTIR
Attachment for Sorption Measurements (OPTIS-PEC, Zurich, Switzerland), which consists of a special mirror setup and an ATR sorption cell surrounding a trapezoidal silicon crystal [30], The ATR-IR spectra were recorded using a FT Spectrometer (IFS 55, Bruker)
During the measurements the intensity spectra of the sample Is and the reference IR were alternatingly recorded and calculated to the absorption spectra A:
2.5. Scanning force microscopy (SFM)
Scanning force microscopy (SFM) was used to study the lateral structures of the dried adsorbed polymer films. All investigations were performed with a commercially available SFM (Multimode Nanoscope Ill/Digital Instruments). SFM topographies were taken in the tapping mode™ to minimize any damage to the polymer layer caused by tip contact. The measurement frequency was set from 280 to 330 kHz. The used tips were made from microfabricated silicon.
3. Results and discussion
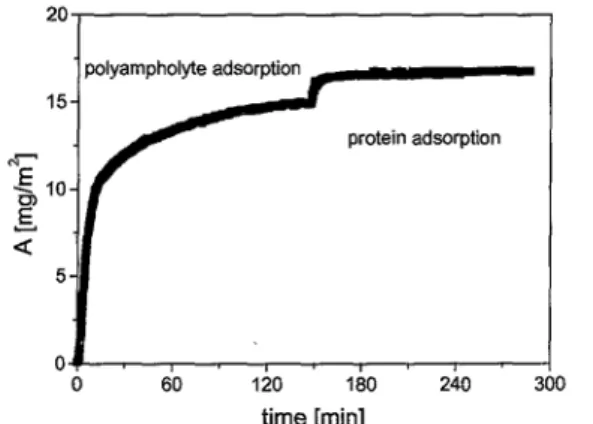
To investigate the protein adsorption on the polyampholytic prelayer as a function of time, the adsorption of fibrinogen was carried out in situ after monitoring the adsorption of the polyampholyte layer (Fig. 3). For this experiment the concentration of fibrinogen was set to 0.07 gl-1 in a 10 mM phosphate buffered solution. The adsorption of polyampholyte as well as protein reached equilibrium in less than 3 h. The stability of the polyampholyte layer under treatment withphosphate buffered protein solution was checked by ATR-IR spectroscopy.
Figure 3. Amount of polyampholyte and fibrinogen adsorbed as a function of adsorption time.
Two ATR-IR spectra of the adsorbed polyampholyte before and after protein treatment are presented in Fig, 4. While the polyampholyte is characterized by an IR absorption of around 1720 cm-1 according to the car bonyl function, the proteins show a typical absorption at 1640 cm-1 caused by the amide functions [31]. This difference in absorption allowed to distinguish the polyampholytic prelayer and the adsorbed protein spectroscopically, The first ATR-IR spectra after the primer adsorption of
polyampholyte showed only the typical IR absorption due to the carbonylfunction. After the secondary adsorption of fibrinogen the amideband of the protein was also detectable, while the carbonyl
absorption of the polyampholyte showed no change, Therefore, it can be concluded that there is no desorption or displacement of polyampholyte caused by treatment with phosphate buffered protein solution, The protein adsorbed additionally and did not replace any polyampholyte from the silicon substrate.
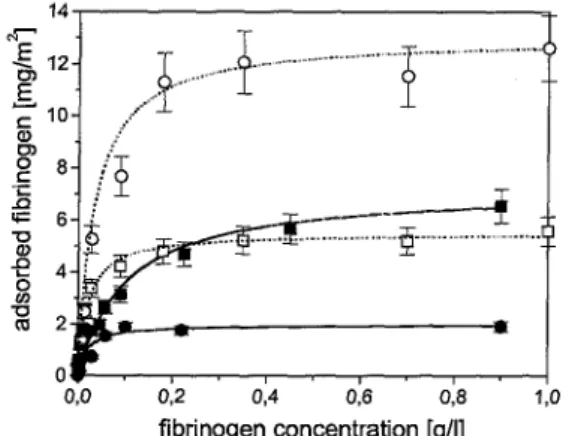
To get a better insight into how the polyampholytic prelayer affects the protein adsorption, further adsorption experiments with fibrinogen were carried out. Fibrinogen was adsorbed on pure silicon substrates and on substrates with preadsorbed polyampholyte at varied protein solution concentrations containing 1 or 10 mM phosphate buffer (Fig, 5). In all cases the amount of fibrinogen adsorbed increased with concentration and was fitted by the Langmuir adsorption model [32]. This model is based on the adsorption of monolayers and describes the amount adsorbed, A(cp), as a function of solution concentration, cp:
(3)
where K = kads/kdes is the ratio of the rate of adsorption and desorption and A∞ is the adsorbed amount at infinitely high concentration. While A∞ was found to be strongly influenced by the substrate characteristics and phosphate buffer concentration, the K-values in the range 10-50 lg-1 were less
affected by the adsorption conditions.
Figure 4. ATR-IR-spectra of an adsorbed polyampholyte layer with and without secondary adsorbed fibrinogen.
For the larger buffer concentration of 10 mM the maximal adsorbed amount of fibrinogen on the polyampholytic layer was reached for a small protein concentration of 0.2 gl-1 with an adsorbed amount of 2.0 mg m-² and so A∞ was found to be 2 mgm-². On pure silicon substrates the amount of adsorbed fibrinogen increased until higher concentrations up to 0.9 gl-1 with more than 6.0 mgm-2 and A∞ = 7 mgm-2. Therefore, the adsorption of fibrinogen from solutions containing more than 0.05 gl-1 fibrinogen was reduced drastically by the preadsorbed polyampholyte. If the adsorption was carried out under the presence of the smaller phosphate buffer concentration of 1 mM, the fibrinogen adsorption on the polyam-pholytic prelayer was significantly increased up to 12.6 mgm-2 with A∞ = 13 mgm-2. In contrast to this, the fibrinogen adsorption on the pure silicon substrate was quite similar for the different phosphate concentrations (Figs 5, 6, and 13).
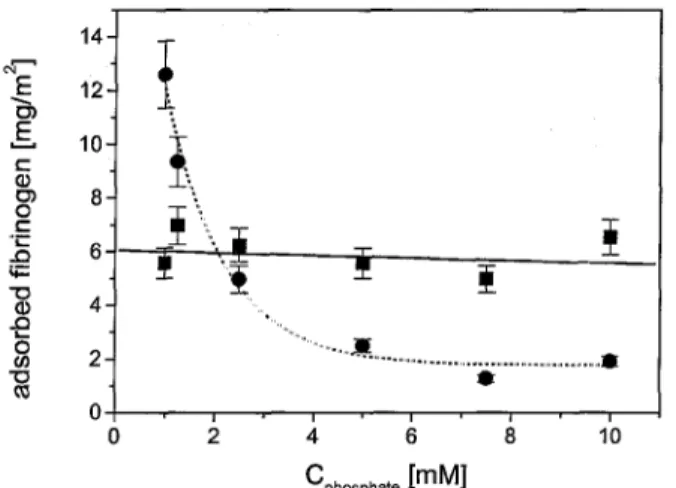
A similar behaviour is shown by the amount of fibrinogen adsorbed at high fibrinogen solution concentration at adsorption equilibrium as a function of phosphate buffer concentration (Fig. 6). On pure silicon substrates the amount of fibrinogen adsorbed is found to be between A = 5.0 and 7.0 mgm-2 and nearly indifferent to buffer concentration. In this case, a linear regression of the adsorbed fibrinogen amount as a function of buffer concentration shows only a small decrease of fibrinogen adsorption with increasing buffer concentration. In contrast, the adsorption on polyampholyte covered substrates is more significantly influenced by the phosphate concentration. Below a phosphate buffer concentration of 2 mM, the amount of fibrinogen adsorbed is increased compared to the adsorption on pure silicon substrates. In contrast, the fibrinogen adsorption is decreased if the adsorption is performed from solutions containing a higher phosphate concentration. The decrease of fibrinogen adsorption on the polyampholytic prelayer with increasing buffer concentration can be described as exponential decay and is much more stronger as the decrease, if the adsorption is carried out on pure silicon substrates (Fig. 6).
Figure 5. Amount of adsorbed fibrinogen as a function of the fibrinogen concentration on puie silicon substrates ((■) with 10 mM phosphate buffer and (□) with 1 mM phosphate buffer) and on silicon
substrates with a polyampholytic layer ((•) with 10 mM phosphate buffer and (O) with 1 mM phosphate buffer) The error bars indicate the errors resulting from the ellipsometric measurements.
An analogous change in fibrinogen adsorption caused by different substrate modifications was reported by several authors and explained by changing interactions between substrate and protein [20, 33-36], Beside electrostatic interactions, hydrophobic interactions were also discussed., The change in the IEP of the substrate from pHIEP = 3.8 to 8.3 caused by the adsorbed poly ampholyte switched the net charge of the protein adsorption substrate at pH = 7.4 from negative to positive values. Fibrinogen is characterized by an IEP of pHIEP = 5.5 and is, therefore, negatively charged at pH = 7.4. For this reason, the attractive electrostatic interactions between substrate and fibrinogen increased by
preadsorption of poly ampholyte. So the increase in adsorption in case of 1 mM phosphate buffer could be explained by the increased electrostatic attraction between fibrinogen and the modified substrate. However, in case of higher phosphate concentration a decrease in the adsorbed amount of fibrinogen was detected. In this case the electrostatic interactions could not play a significant role. On one hand, the increasing phosphate concentration leads to a reduction of electrostatic interactions in solution caused by the Debye screening. On the other hand, not only is the pHIEP of the substrate changed by the polyampholytic prelayer, but also the interactions with solved ions in solution were changed. Polyelectrolytes and polyampholytes are known to have strong electrostatical interactions to mono-, bi-, or multivalent ions [37bi-, 38]. In case of the investigated polyampholyte systembi-, the influence of Na+bi-, CI-, Ca2+, and SO42- on the adsorption behaviour was reported in earlier studies [13, 15], Due to the strong interactions between the charged polyampholyte and the ions, both the negatively-and the positively-charged ions were found to have a strong influence on the adsorption and solution behaviour of the polyampholyte.
Figure 6. Amount of adsorbed fibrinogen as a function of phosphate buffet concentration Cphosphate on pure silicon substrates (■) and on silicon substrates with a polyampholytic layer (•). The fibrinogen concentration was set to high values between 0.9 and 1.0 gl-1 at adsorption equilibrium. The solid line shows a linear fit for the measurements on the pure silicon substrates, while the dotted line shows an exponential decay for adsorption on the polyampholytic prelayer The error bars indicate the errors resulting from the ellipsometric measurements
The phosphate buffer at a pH of around 7 consists of mono- and bivalent phosphate ions, which should also have strong electrostatic interactions with the charged preadsorbed polyampholyte layer. The phosphate ions connected to the polyampholyte layer have to be replaced by the fibrinogen during the adsorption process, In this case, a stronger interaction of the phosphate ions to the substrate and an increase of phosphate concentration would lead to a smaller amount of adsorbed fibrinogen, An analogous behaviour was found for modified substrates [6, 21, 39]. On hydrophilically-modified substrates the hydrated water is stronger connected to the substrate. The hydrated water has to be replaced by the adsorbing proteins during the adsorption process [40]. Therefore, a stronger
interaction of the hydrated water to the hydrophilic surface could decrease the amount of adsorbed protein. The same effect should be expected for phosphate ions.
images presented in Fig. 7. On both substrates the surface topography of adsorbed fibrinogen was determined by large irregular structures with lateral sizes containing diameters up to 300 nm, so in these cases single seper-ated fibrinogen molecules can not be detected using SFM. Therefore, an aggregation of adsorbed fibrinogen on the substrate surface should be estimated, which isquite typical for adsorbed protein layers [41-43].
Figure 7. SFM images of adsorbed fibrinogen at a scan area of 2.5 µm x 2.5 µm. The fibrinogen amount adsorbed determined by ellipsometry is given. Left: fibrinogen on a pure silicon substrate, A = 5.2 mgm-2 (rms-roughness around 15 nm); right: fibrinogen on a silicon substrate with polyampholytic layer, A = 11.5 mgm-2 (rms-roughness around 14 nm). Cross-sections of both SFM figures are shown below the images.
These adsorbed aggregates characterized both surface topographies and increased the toughness of the surfaces. For polyampholytic pretreated substrate, a bigger rms-roughness of around 14 nm was found after fibrinogen adsorption compared with a rms-roughness of 1.5 nm found after fibrinogen adsorption on alkaline pretreated substrates. The bigger rms-roughness after fibrinogen adsorption on the
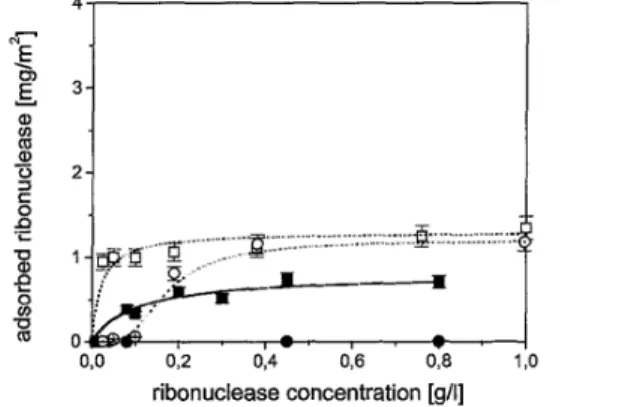
polyampholyte layer is in good agreement with the large rms-roughness of around 10 nm of the polyampholyte-covered substrate before protein adsorption. In order to analyze the effect of the polyam-pholyte prelayer on the adsorption of globular proteins in some detail, analogous adsorption experiments with the four small globular proteins lysozyme, ribonucle-ase, α-lactalbumin, and myoglobin were performed. These four proteins are characterized by similar molecular weights of around 1.5 kD and similar shapes. They differ considerabely in IEP, overall hydrophobicity, and structural stability. Therefore, this set of proteins can be applied to probe the impact of protein charge, hy-drophobicity, and structural stability on the adsorption at solid surfaces. Results of adsorption experiments with those proteins were expected to reveal the origin of the reduced amount of adsorbed multidomain protein fibrinogen onto polyam-pholytic prelayers. For both buffer concentrations of 1 and 10 mM phosphate, the adsorption of lysozyme was reduced on the polyampholytic prelayer compared with the adsorption on the pure silicon wafers (Fig, 8). An analogous behaviour was shown by ribonuclease. With 10 mM phosphate buffer the adsorbed amount of ribonuclease on pure silicon substrates increased up to 0.7 mgm-², while for substrates with polyampholyte no adsorption of ribonuclease was detected. A lower phosphate concentration led only to a reduction in adsorption up to 0.1 gl-1 ri-bonuclease in solution. For higher concentrations of ribonuclease the adsorbed amount on both kinds of substrates was quite similar (Fig. 9). Both proteins contain an alkaline IEP (ribonuclease: pHIEP = 9.4; lysozyme: pHIEP = 11.1) and are clearly positively-charged at pH = 7.4.
Figure 8. Amount of adsorbed lysozyme as a function of lysozyme concentration on pure silicon substrates ((■) with 10 mM phosphate buffer and (□) with 1 mM phosphate buffer) and on silicon substrates with a polyampholytic layer ((•) with 10 mM phosphate buffer and (O) with 1 mM phosphate buffer). The error bars indicate the errors resulting from the ellipsometric measurements.
Considering the net charges of substrate and proteins, there is an attractive electrostatic interaction between these proteins and the pure silicon substrate, while the electrostatic interaction between these proteins and the preadsorbed polyampholyte is repulsive. In addition to the stronger interaction of the phosphate ions to the substrate, the electrostatic interactions of both these proteins did not favour the protein adsorption on the preadsorbed polyampholyte. In the case of ribonuclease, in the presence of 1 mM phosphate, this reduced adsorbed amount is only observed for protein concentrations up to 0.1 gl-1. With less phosphate concentration an increased ribonuclease concentration would shift the
concurrence of protein and phosphate ions on the polyam-pholytic film and adsorption of ribonuclease could take place.
α-Lactalbumin with 10 mM phosphate buffer up to a protein concentration of 1 gl-1 showed no
adsorption either on pure silicon substrates or on preadsorbed polyampholytes. A decrease in phosphate concentration led to an increase in adsorbed α-lactalbumin up to 1.6 mgm-2 on the polyampholytic prelayer (Fig. 10). This protein is negatively charged at pH 7 4 and has repulsive electrostatic
interactions with the pure silicon substrates which prevent the adsorption of α-lactalbumin on the pure silicon, while the adsorption on the preadsorbed polyampholyte is assumed to be prevented by the increased interactions of phosphate ions to the substrate in cases of higher phosphate concentrations. With less phosphate ions the protein win the concurrence and an adsorption of α-lactalbumin was observed.
The adsorption of myoglobin on silicon substrates increased up to 1.7 mgm-2 in the presence of 1 or 10 mM phosphate buffer. In contrast, the secondary adsorption onto the polyampholytic layer led to a significantly higher adsorbed myoglobin amount of 5.7 mgm-2 with 10 mM phosphate buffer and 2.5 mgm-2 with 1 mM phosphate buffer (Fig. 11). Myoglobin shows an IEP of around pH = 7.0 being nearly uncharged at pH 7.4. Thus a change in the net charge of the substrate induced by the adsorption of the polyampholyte has only a small influence on the electrostatic interaction with the protein.
Figure 9. Amount of adsorbed ribonuclease as a function of ribonuclease concentration on pure silicon substtates ((■) with 10 mM phosphate buffet and (□) with 1 mM phosphate buffet) and on silicon substrates with a polyampholytic layer ((•) with 10 mM phosphate buffet and (O) with 1 mM phosphate
buffet). The error bats indicate the errors resulting from the ellipsometric measutements.
Therefore, it is not reasonable to argue that the electrostatic interaction explains the adsorption behaviour of myoglobin [44], Also the increased attraction between phosphate ions and subtrate induced by preadsorbed polyampholyte would decrease the myoglobin adsorption.
The increase in adsorption of myoglobin is not explained by electrostatic interactions or changes in the hydrophilic properties of the substrate. Arai and Norde reported a similar adsorption behaviour of myoglobin on different polystyrol- and iron oxide substrates [4] and explained this behaviour by an increase in entropy caused by a change in protein conformation during the adsorption process [45], As compared to ribonuclease and lysozyme, myoglobin is characterized by lower structural stability [4].
Figure 10. Amount of adsorbed α-lactalbumin as a function of α-lactalbumin concentration on pure silicon substrates ((■) with 10 mM phosphate buffer and (□) with 1 mM phosphate buffer) and on silicon substrates with polyampholytic layei ((•) with 10 mM phosphate buffet and (O) with 1 mM phosphate buffer). The error bares indicate the errors resulting from the ellipsometric measurements.
Figure 11. Amount of adsorbed myoglobin as a function of myoglobin concentration on pure silicon substrates ((■) with 10 mM phosphate buffer and (□) with 1 mM phosphate buffer) and on silicon substrates with a polyampholytic layer ((•) with 10 mM phosphate buffer and (O) with 1 mM phosphate buffer) The error bars indicate the errors resulting from the ellipsometric measurements.
The lower stability favoured structural changes of myoglobin during the adsorption process and could lead to an increase in entropy of the protein conformation. The increase in entropy is expected to be the reason for the adsorption on the preadsorbed polyampholyte. Here it has to be taken into account that the structural stability of α-lactalbumin is less than that of myoglobin [4], The significant difference in the adsorption behaviour of both proteins may be explained by the net charge of near zero for
myoglobin. In this case, the structural change in protein conformation may be unhindered by the charged functional groups contained by the protein,. An analogous explanation is possible for the increase of myoglobin adsorption with increased phosphate concentration An increased buffer
concentration would lead to an increased shielding of the charged protein groups from each other. So a change in conformation should be favoured. Compared to the pure silicon substrate with a
roughness of around 0.1 nm, the substrates modified by polyampholyte contained a considerable rms-roughness of around 10 nm and for this reason the effective surface for protein adsorption is increased. The space between the preadsorbed polyampholytic structures was found to fill up by adsorbing myoglobin and the regularity on the surface decreased (Figs 2 and 12). The increase in adsorbed myoglobin may be explained here by increased roughness of the modified substrates which offers more space for adsorbing myoglobin than the pure silicon substrates do.
Figure 12. SFM images of adsorbed myoglobin at a scan area of 2.5 µm x 2.5 µm The myoglobin amount adsorbed determined by ellipsometiy is given. Left: myoglobin on a pure silicon substrate, A = 1.3 mgm-2 (rms-roughness around 2 nm); light: myoglobin on a silicon substrate with polyampholytic layer, A = 5.7 mgm-2 (rms-roughness around 5.5 nm) Cross-sections of both SFM figures are shown below these images.
The increased roughness of the substrate with polyampholytic prelayer should also lead, in principal, to an increased adsorption of the other investigated proteins. This is in fact not the case, because the adsorption of the other proteins is more determined by electrostatic interactions and by interactions with phosphate ions in solution. Therefore, the special behaviour of myoglobin should result from the net charge near zero of this protein at pH = 7. Only under these conditions could structural changes during the adsorption process lead to an increase in protein conformation entropy. So the effective surface increased as a function of the surface roughness is throught to be the limiting parameter for the adsorption process.
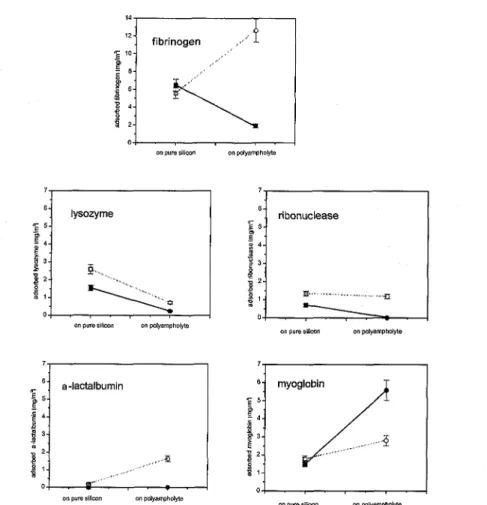
Figure 13. Adsorbed amount of the investigated proteins adsorbed from solutions containing high protein concentrations on pure silicon substrates with 10 mM phosphate buffer and with 1 mM phosphate buffer) and on silicon substrates with polyampholytic prelayer with 10 mM phosphate buffer and with 1 mM phosphate buffer). The error bars indicate the errors resulting from the ellipsometric measurements.
4. Conclusions
The adsorption of five different proteins on silicon substrates modified by pread-sorption of the new polyampholyte PMAA-b-PDMAEMA was investigated by means of ellipsometry, ATR-IR
spectroscopy, and scanning force microscopy. In every case, the protein adsorption was strongly influenced by the polyampholytic prelayer. A short review on the adsorbed amount of the different investigated proteins adsorbed under various conditions is given in Fig. 13.
The adsorption of lysozyme and ribonuclease was reduced by the polyampholytic prelayer. The decrease in adsorption was explained by the change of electrostatic characteristics of the substrate and the changed interactions between phosphate ions and substrate caused by preadsorption of
polyampholyte. The changed interactions between phosphate ions and the modified substrate should be also the reason for decreasing fibrinogen adsorption at higher phosphate buffer concentrations. By contrast, the increase in the adsorbed amount of fibrinogen at lower phosphate concentrations results from the changed electrostatic interactions between the fibrinogen and the polyampholytic prelayer, In the case of myoglobin the preadsorbed polyampholyte induced a significant increase in protein adsorption. This special behaviour was understandable by an entropically-driven adsorption of myoglobin.
Acknowledgements
We owe many thanks to Dr. J..-F. Gohy and Dr. C. Harrats (University of Liège) for the synthesis of polyampholytic polymers. RJ is very much indebted to the Services Fédéraux des Affaires
Scientifiques, Techniques et Culturelles (SSTC) for financial support in the frame of the Pôles d'Attraction Interuniversitaires: Chimie et Catalyse Supramoleculaire. This work was supported by the DFG Schwerpunkt Polyelektrolyte (grant IIC10-322 1009).
References
[1] M. A Cohen Stuart, G. J. Fleer, J. Lyklema, W. Norde and J. M. H. M Scheutjens, Adv.. Coll. Interf: Sci. 34, 477 (1991).
[2]. S. E Kudaibetgenov, Adv. Polym. Sci. 144, 155 (1999),
[3]. D, A. Styrkas, V. Bfitiin, J, R, Lu, J. L Keddie and S. P. Armes, Langmuir 16, 5980 (2000), [4] T. Aiai and W, Norde, Colloid Surf.. 51, 1 (1990).
[5]. S..-L. Huang, C..-R Ou, M..-S.. Chao and J..-Y. Lai, J Appl. Polym. Sci 74, 297 (1999). [6], E F Murphy, J. R, Lu, J. Brewer, J. Russell and J. Penfold, Langmuir 15, 1313 (1999). [7] F Caruso, D, N. Furlong, K. Ariga, I. Ichinose and T. Kunitake, Langmuir 14, 4559 (1998). [8]. S, I. Sofia, V. Premnath and E, W, Merrill, Macromolecules 31, 5059 (1998).
[9]. Z. Yang, J. A. Galloway and H, Yu, Langmuir 15, 8405 (1999),
[10], P. Wang, K...L.. Tan and E, T. Kang, 7. Biomater. Sci. Polymer Edn 11, 169 (2000),
[11], J-F, Gohy, S Cieutz, M, Garcia, B, Mahltig, M Stamm and R, Jérôme, Macromolecules 3.3, 6378 (2000),
[12], T, Goloub, A. de Keizei and M, A, Cohen Stuart, Macromolecules 32, 8441 (1999), [13]. H Walter, C. Harrats, P. Müller-Buschbaum, R Jérôme and M. Stamm, Langmuir 15, 1260 (1999)..
[14] H. Walter, P Müller-Buschbaum, J. S. Gutmann, C Lorenz-Haas, C. Harrats, R Jérôme and M. Stamm, Langmuir 15, 3984 (1999)
[15]. B. Mahltig, H. Walter, C. Harrats, P. Miiller-Buschbaum, R Jérôme and M. Stamm, Phys. Chem. Chem. Phys., 1, 3853 (1999).
[16]. B. Mahltig, J..-R Gohy, R. Jérôme, C Bellmann and M Stamm, Colloid Polym. Sci 278, 502 (2000)
[17] S. Antoun, P. Teyssié and R. Jérôme, Macromolecules 30, 1556 (1997). [18]. S. Creutz, P Teyssié and R. Jérôme, Macromolecules 30, 6 (1997).
[19]. S. Creutz, J v.. Stam, S. Antoun, F. C de Schryer and R. Jérôme, Macromolecules 30, 4078 (1997).
[20]. B. Mahltig, J.-F. Gohy, R. Jérôme and M. Stamm,.J. Polym.. Sci. B 39, 709 (2001).
[21]. B. Mahltig, P. Müller-Buschbaum, M. Wolkenhauer, O. Wunnicke, S. Wiegand, J.-F. Gohy, R. Jérôme and M. Stamm, J Colloid Interf Sci. (in press).
[22]. E. F Murphy, J R. Lu, A. L Lewis, J. Brewer, J. Russell and P, Stratford, Macromolecules 33, 4545 (2000).
[23]. F W. Putnam (Ed.), The Plasma Proteins Academic Press, New York (1975). [24]. T. Sengupta, L. Razumovsky and S Damadaran, Langmuir 15, 6991 (1999).
[25]. T. E Creighton, Proteins — Structures and Molecular Properties.. W. H. Freeman & Co., New York (1996)
[26]. M. Harke, R Teppner, O Schulz, H. Motschmann and H. Oiendi, Rev. Sci. Instrum. 68, 3130 (1997)
[27]. R M. A. Azzam and N. M. Bashara, Ellipsometry and Polarized Light. North-Holland, Amsterdam (1979).
[28]. F. L. McCrackin, E. Passaglia, R. R. Stromberg and H. L. Steinberg, ./ Res Nat Bur. Stand 37A, 363 (1963).
[29]. J. A. de Feijter, J. Benjamins and F. A Veer, Biopolymers 17, 1759 (1978).
[30]. M. Müller, T. Rieser, K. Lunkwitz and J. Meier-Haack, Macromol. Rapid Commun. 20, 607 (1999).
[31]. M. Müller, C. Werner, K. Grundke, K. J. Eichhorn and H.-J. Jacobasch, Macromol Symp. 103, 55(1996)
[32]. P W, Atkins, Physical Chemistry. University Press, Oxford (1982).
[33]. E. Brynda, M. Houska and F. Lednicky, J ColloidInterf. Set 113, 164 (1986). [34]. K. L Prime and G. M. Whitesides, J. Am Chem. Soc. 115, 10714 (1993).
[35]. T. McPherson, A. Kidane, I. Szleifer and K Park, Langmuir 14, 176 (1998). [36] D. R. Jackson, S. Omanovic and S. G Roscoe, Langmuir 16, 5449 (2000).
[37]. A Ohlemacher, F. Candau, J R. Munch and S. J. Candau,,/, Polym. Sci, B 34, 2747 (1996). [38]. E. Ringebach, G. Chauveteau and E. Pefferkorn, J Colloid Interj. Sci. 171, 218 (1995)
[39]. W. Norde and J. Lyklema, J. Colloid Interf. Set 71, 350 (1979).
[40] R. A. L Jones and R. W. Richards, Polymers at Surfaces and Interfaces. Cambridge University Press, Cambridge (1999)
[41]. T J. McMaster, M J. Miles, P. R. Shewry and A S Tatham, Langmuir 16, 1463 (2000). [42]. A. Takahara, S. Ge, K. Kqjio and T Kajiyama, J. Biomater. Sci. PolymerEdn 11, 111 (2000). [43]. C. Werner, M. Pilz, G. Ebeith, A Menning, H.-D. Lemke and K.-J. Eichhorn, Macromol. Symp 145, 137 (1999).
[44]. K. Kandori, A Fudo and T. Ishikawa, Phys. Chem. Chem. Phys 2, 2015 (2000).