Are We Making a Dragon Out of a Dragonfly?
Understanding China’s Role in
Global Production Networks
2009RB-03 > January 2009
Ari Van Assche
(HEC Montréal and CIRANO)The Burgundy Reports are synthesis documents written by CIRANO researchers on issues of general interest. Their aim is to encourage discussion and public debate on current issues.
CIRANO is a multidisciplinary interuniversity centre of research. Its mission is to accelerate the transfer of knowledge between researchers and organizations.
CIRANO’s PARTNERS
Principal Partner
Ministère du Développement économique, de l’Innovation et de l’Exportation
Corporate Partners
Bank of Canada Bell Canada BMO Financial Group
Business Development Bank of Canada Caisse de dépôt et placement du Québec DMR
Fédération des caisses Desjardins du Québec Gaz de France
Gaz Métro Hydro-Québec Industry Canada Laurentian Bank
Ministère des Finances du Québec Montréal Exchange
National Bank of Canada PSP Investments
Raymond Chabot Grant Thornton RBC Royal Bank
Rio Tinto Alcan Scotia Bank
State Street Global Advisors Transat A.T.
Ville de Montréal
University Partners
Concordia University
École Polytechnique de Montréal HEC Montréal
McGill University Université de Montréal Université de Sherbrooke Université du Québec
Université du Québec à Montréal Université Laval
Affiliated Institutions
Bell University Laboratories
Institut de Finance mathématique de Montréal [IFM2]
Mathematics of Information Technology and Complex Systems [MITACS] Network for Computing and Mathematical Modeling [RCM2]
The observations and viewpoints expressed in this publication are the sole responsibility of the authors; they do not necessarily represent the positions of CIRANO or its partners.
© 2009 Ari Van Assche. All rights reserved.
Short sections may be quoted without explicit permission, provided that full credit, including © notice, is given to the source.
Table of contents
Introduction
3
A Tale of Three Myths
5
Myth 1. 5
“More than a tenth of Canada’s manufacturing imports are
made in China.”
Myth 2. 10
“China’s comparative advantage is rapidly shifting from
low-technology to high-technology products.”
Myth 3. 17
“Canadian firms are on a large scale moving their manufacturing
plants to China to take advantage of its cheap labor, thus effectively
hollowing out Canada’s manufacturing sector.”
Concluding
remarks
21
Ari Van Assche
Ari Van Assche is an Assistant Professor in the Department of International Business at HEC Montréal. He holds a M.Sc. in Chinese Studies from the Catholic University of Leuven and a Ph.D. in Economics from the University of Hawaii of Manoa. Mr. Van Assche’s field of research is in international economics, where he focuses on the organization of global production networks and its implications for trade. Mr. Van Assche is a CIRANO Researcher.
hina has become the center of virtually any discussion about globalization and its impact on the Canadian economy. According to a recent national opinion poll by the Asia-Pacific Foundation of Canada (APFC), Canadians believe that China is the second most important country/region for Canada’s prosperity after the United States and before the entire European Union (APFC, 2008). In the same poll, a resounding majority of respondents agrees that, ten years from now, the influence of China and India in the world will equal that of the United States.
Yet the public remains skeptical whether China’s emergence as a major economic force is good for the Canadian economy. Many Canadians view the decline of its manufacturing sector as directly related to the rapid growth of low-cost imports from China. According to the APFC poll, more than twice the respondents believe that increased trade and investment between Canada and China will result in Canadian job losses rather than create jobs. And 71 percent of Canadians believe that its industries should be protected from imports that come from countries with very low wages. This fear is fueled by the dramatic rise in Canada’s manufacturing imports from China. Between 1997 and 2007, Canada’s manufacturing imports from China has grown eight-fold, rising from US$4 billion to US$34 billion, while manufacturing imports from other countries has less than doubled, growing from US$158 billion to US$257 billion. As a result, 11.7 percent of Canada’s manufacturing imports currently come from China.
An additional source of concern is the changing mix of Canada’s imports from China (Taktik Chine, 2006). If fifteen years ago China primarily exported low-tech products such as apparel, toys and footwear, today it has become Canada’s primary supplier of high-technology products such as computers and telecommunications equipment. Indeed, in 2007, 19.6 percent of Canada’s imports from China were high-technology imports, compared to 12.5 percent
C
INTRODUCTION
Many Canadians
view the decline
of its
manufacturing
sector as directly
related to the
rapid growth of
low-cost imports
from China.
from all other countries. This has created the fear that China is rapidly moving up the technology ladder, and becoming competitive in technology-intensive industries where Canada should have a strong comparative advantage.
In light of these worries, an explosion of books, reports and articles have discussed the reasons behind China’s extraordinary export boom and the role that foreign firms have played therein. An often recurring story is that Western companies are on a large scale closing manufacturing plants in their home countries and are moving them to China to take advantage of its lower labor costs. This has created the rising resentment that Western companies in their search for profits are not only hollowing out their own manufacturing industry, but also building up China’s competitiveness as the world’s factory.
So, how concerned should we be with the rise of the Chinese dragon? In this report, we conduct a careful review of the data used to support the argument that China is a rising threat to the Canadian economy. While the evidence of China’s rising threat at first sight seems resounding, we demonstrate that the reality is less clear-cut once a deeper analysis of the data is conducted. Our study allows us to debunk three “myths” about China’s role in the world economy:
MYTH 1. More than a tenth of Canada’s manufacturing imports are made in
China.
MYTH 2. China’s comparative advantage is rapidly shifting from low-technology
to high-technology products.
MYTH 3. Canadian firms are on a large scale moving their manufacturing plants
to China to take advantage of its cheap labor, thus effectively hollowing out Canada’s manufacturing sector and building up China as the world’s factory. In the next section, we will discuss each “myth” in three parts. First, we will provide the supporting evidence that is generally used to buttress the “myth”. Second, we will provide counter evidence. Third, we will provide a verdict that more accurately portrays China’s role in the global economy.
How concerned
should we be
with the rise of
the Chinese
dragon?
A Tale of Three Myths
“More than a tenth of Canada’s manufacturing
imports are made in China.
”Supporting Evidence
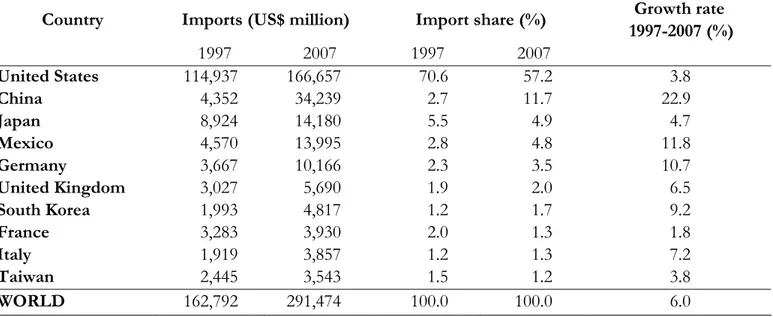
n the past decade, Canada's imports from China have grown at an exceptional rate. Between 1997 and 2007, Chinese manufacturing imports have grown at an annualized rate of 22.9 percent, almost four times faster than the growth rate of Canada’s total manufacturing imports (see table 1). As a result, China’s share of Canadian imports has risen from 2.7 percent in 1997 to 11.7 percent in 2007, thus surpassing Japan and Mexico to become Canada’s second largest import partner behind the United States.
Table 1 Canada’s Ten Largest Manufacturing Import Partners in 2007 Country Imports (US$ million) Import share (%) Growth rate
1997-2007 (%) 1997 2007 1997 2007 United States 114,937 166,657 70.6 57.2 3.8 China 4,352 34,239 2.7 11.7 22.9 Japan 8,924 14,180 5.5 4.9 4.7 Mexico 4,570 13,995 2.8 4.8 11.8 Germany 3,667 10,166 2.3 3.5 10.7 United Kingdom 3,027 5,690 1.9 2.0 6.5 South Korea 1,993 4,817 1.2 1.7 9.2 France 3,283 3,930 2.0 1.3 1.8 Italy 1,919 3,857 1.2 1.3 7.2 Taiwan 2,445 3,543 1.5 1.2 3.8 WORLD 162,792 291,474 100.0 100.0 6.0 Source: WITS.
I
MYTH1
Between 1997 and
2007, Chinese
manufacturing
imports have
grown at an
annualized rate of
22.9%.
Many observers have taken the fact that 11.7 percent of Canada’s manufacturing imports come from China as evidence that the same share of imports are made in China, thus leading to Myth 1.
Counter Evidence
The problem with this “evidence” lies in the way that exports are measured. Statistical agencies collect and report export data as the gross value of the goods that leave a country’s borders rather than as the value that was produced in that country. If a country relies on imported inputs to produce its export goods, this implies that there is a discrepancy between the value exported by a country and the value made in a country. To illustrate this, consider figure 1 in which the country Home produces an export good z through the assembly of inputs x and
y. The figure depicts two scenarios. In scenario 1, the production of the inputs x
and y and the final assembly of product z all occur at Home. As a result, the value exported by Home x+y+z equals the value made in Home. In scenario 2, the inputs x and y are imported from abroad, while only the final assembly occurs at Home. In this case, the value exported by Home x+y+z not only contains the value made in Home z, but also the value of the imported inputs
x+y. The figure implies that for countries that heavily rely on imported inputs to
produce their export goods, the export value can significantly exceed the value made in the country.
Figure 1
China is a textbook example of a country that heavily relies on foreign inputs to produce its exports (Branstetter and Lardy, 2006; Gangnes and Van Assche, 2008; Van Assche and Gangnes, 2008). Since the early 1990s, many multinational firms have moved their labor-intensive assembly plants to China in a bid to reduce production costs. These firms ship their inputs to China, where they are assembled and then re-exported to the final destination market. Data provided by China’s Customs Statistics show the importance of such assembly plants on China’s export performance. According to China’s customs rules, firms are allowed to import inputs without paying custom duties provided that these inputs are used to produce final goods destined solely for exports. The trade associated with this export platform program is referred to as processing trade. In Figure 2, we illustrate the large and growing role of processing trade in China’s exports. Between 1988 and 2005, its share in China's total exports has risen from 30 percent to 55 percent. In other words, currently more than half of China’s exports are conducted by processing plants that merely assemble imported inputs for export purposes.
Figure 2 Processing Export Share in China’s Total Export (1988-2005)
25 35 45 55 65 75 88 89 90 91 92 93 94 95 96 97 98 99 00 01 02 03 04 05 Share processing exports Share ordinary exports Source: Van Assche et al. (2008), using China’s Customs Statistics data.
China is a
textbook example
of a country that
heavily relies on
foreign inputs to
produce its
exports.
Since these processing plants heavily rely on imported inputs to produce their export goods, the discrepancy between the value exported by China and the value made in China is particularly large. We can use both anecdotal and statistical evidence to demonstrate this. First, consider the example of the iPod, which China assembles for Apple and exports to the rest of the world. Linden et al. (2007) show that the Chinese export value for a unit of a 30GB video model in 2006 was about $150. However, they estimate that only $4 of this value is attributable to producers located in China, with the large brunt of value added being created in the United States, Japan and Korea. This example suggests that only 2.6 percent of China’s export value of iPods is really made in China.
A recent study by Koopman et al. (2008) provides aggregate statistical evidence that (i) a significant share of China’s export value corresponds to the value of the imported inputs embodied in the exports and (ii) that this share is larger for processing trade than for non-processing trade. For processing trade, the authors estimate that only 17.7 percent of its export value in 2006 was made in China, while 82.3 percent corresponded to the value of the imported inputs. For non-processing trade, on the other hand, 88.3 percent of the export value was made in China, with imported inputs only accounting for 11.7 percent of the value. Overall, the authors estimate that only 49.4 percent of China’s export value is truly made in China.
Table 2
Share of export value that is made in China
1997 2006 Total exports 47.6 49.4
Nonprocessing exports 94.3 88.3
Processing exports 17.7 17.7
Source: Koopman et al. (2008).
Only 2.6 percent
of China’s export
value of iPods is
really made in
China.
We can use Koopman et al.’s (2008) estimates to make a more accurate assessment of the share of Canadian manufacturing imports that is truly made in China: if we take into account that only 49.4 percent of China’s export value is created in China, then this means that correspondingly only 5.8 of Canada’s imports from China is made in the country. Table 1 shows that this share is only slightly larger than that of Canada’s manufacturing imports from Japan. Furthermore, if we take into account that Japan is the second largest source of the inputs processed in China, then it is likely that a larger share of Canada’s import value continues to be made in Japan rather than in China.
V
ERDICTWhile it is true that 11.7 percent of Canada’s manufacturing imports
come from China, only half of that value is made in China.
“China’s comparative advantage is
rapidly shifting from low-technology
to high-technology products.”
Supporting Evidence
nother public concern is that China’s export mix seems to be upgrading rapidly. Where 15 years ago, China primarily exported low-technology products such as apparel, toys and footwear to Canada, today it has become a key supplier of high-technology products such as electronic and telecommunications equipment. This has caused the fear that China is rapidly moving up the technology ladder and becoming competitive in technology-intensive areas where a developed country such as Canada should have a comparative advantage.
Evidence of China’s shift into high-technology exports is seemingly abundant. In Table 3, we list Canada’s ten largest import categories from China. As is expected from a developing country, most categories are labor-intensive products such as baby carriages/toys/games/sporting goods, articles of apparel, footwear and women’s clothing. However, counter to the prediction of standard trade theory, four of the ten categories (including the largest) are high-technology products. Currently, Canada imports 56.6 of its Sound/TV recorders, 43 percent of its computer equipment, 29 percent of its household electrical equipment and 25 percent of its telecom equipment from China. This gives a first indication that China is specializing in the export of high-technology goods.
A
China has become
a key supplier of
high-technology
products such as
electronic and
telecommuni-cations
equipment.
MYTH2
Table 3
Canada’s Ten Largest Import Categories from China, 2007
Product Category (US$ million) Import Value Canadian imports (%)China’s share in
Computer equipment 3,747 43.3
Baby carriages/toys/games/sporting goods 2,883 64.1
Telecommunications equipment n.e.s. 2,037 25.4
Furniture and parts thereof 1,794 30.2
Articles of apparel 1,344 53.0
Sound/TV recorders 1,147 56.6
Footwear 1,136 66.0
Women/girls clothing, woven 1,031 61.6
Household electrical equipment 813 29.4
Articles, n.e.s. of plastics 800 20.1
Source: WITS
Even more compelling “evidence” of this rapid upgrading pattern can be obtained by disaggregating China’s exports according to the degree of their technological intensity.1 As Table 4 illustrates, China’s export growth between
1992 and 2005 has primarily been in the two highest technology categories: medium-technology exports grew 22 percent per year, while high-technology exports grew an even more impressive 32 percent per year.2 The
combined share of these two categories has grown from 23.5 percent in 1992 to a staggering 53.7 percent in 2005. Currently, more than half of China’s exports are high-tech!
1 In this part, we rely on the OECD’s classification of manufacturing sectors into four
technological categories: high-technology industries, medium-high-technology industries, medium-low-technology industries and low-technology industries (Hatzichronoglou, 1997).
2 High-technology industries include aerospace, pharmaceuticals, office and computing
machinery, radio, TV and communication equipment and medical, precision and optical instruments.
Currently, more
than half of
China’s exports
are high-tech!
Table 4 China’s Exports by Technological Level Exports
(US$ mil.) Export share (%) Growth rate (%)
RCA index 1992 2005 1992 2005 1992-2005 1992 2005 High-Tech 5,972 230,889 7.0 30.3 32 0.53 1.64 Med-high Tech 14,053 178,568 16.5 23.4 22 0.42 0.67 Med-low Tech 16,455 144,807 19.4 19.0 18 1.17 1.07 Low-Tech 36,902 178,909 43.4 23.5 13 2.05 1.56 Non-manufacturing 11,558 28,827 13.6 3.8 7 1.38 0.44 Total 84,940 761,999 100 100 18 1.00 1.00
Source: Van Assche et al. (2008), using WITS data.
To measure if this rise in high-technology exports is more pronounced in China than in other countries, economists use revealed comparative advantage (RCA) indices.3 A RCA value that exceeds unity for a specific product category implies
that the country is more specialized in the export of that product than the rest of the world. Table 4 shows that China in 1992 still had a specialization pattern that was consistent with its status as a developing country. Specifically, it had a revealed comparative advantage (RCA>1) in the two lower technology categories, while it has a revealed comparative disadvantage (RCA<1) in the two higher technology categories. In 2005, however, its specialization pattern has changed dramatically. China not only had a revealed comparative advantage in low-technology and medium-low-technology products, but had also garnered a strong comparative advantage in high-technology products. These trends have led some well-renowned economists to suggest that China’s export mix is upgrading more rapidly than one would expect from a developing country. Rodrik (2006), for example, stated that “China has somehow managed to latch
on to advanced, high productivity products that one would not normally expect a poor, labor abundant country like China to produce, let alone export.” Schott (2008) exclaims that “China's export bundle increasingly overlaps with that of more developed countries, rendering it more sophisticated than countries with similar endowments.”
Counter Evidence
The problem with these statistics is that the discrepancy between what is “Exported by China” and what is “Made in China” may be larger for high-technology industries than low-high-technology industries. If China relies more on imported inputs in its high-technology exports than in its low-technology exports, then this might create the statistical mirage that China is rapidly moving up the technology ladder.
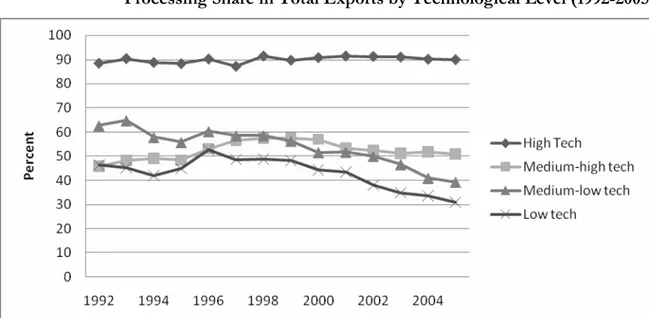
To demonstrate that the data evidence is indeed a statistical mirage, we in Figure 3 depict the share of processing exports (exports made of imported inputs) in China’s total exports for each technology category. Tellingly, the share is smaller for the lower technology industries than for the higher technology industries. In 2005, processing trade consisted of 30 percent of low-technology exports; 40 percent of medium-low-technology exports; 50 percent of medium-high-technology exports; and 90 percent of high-medium-high-technology exports. Since the share of the export value made in China is smaller for processing trade than non-processing trade (see Table 2), this suggests that the discrepancy between “Exported by China” and “Made in China” is largest for the high-technology categories. In simple terms, the more high-tech are the exports, the more heavily China relies on imported (high-tech) inputs.
Figure 3 Processing Share in Total Exports by Technological Level (1992-2005)
Source: Van Assche et al. (2008), using China’s Customs Statistics Data.
An additional source of statistical bias is that the share of the value made in China is generally smaller in the high-technology industries than in the low-technology industries. Koopman et al. (2008) estimate the share of domestic value added in processing exports by industry. Table 5 shows this share for Canada’s ten largest import categories from China. For the high-technology industries electronic computer and telecommunications equipment, less than 10 percent of processing exports value is made in China, while for the lower technology categories furniture, toys/sporting/athletic/recreation products and wearing apparel, a share of more than 30 percent is made in China.
For the high-technology industries electronic
computer and telecommunications
equipment, less than 10% of processing
Table 5
Canada’s Ten Largest Import Categories from China, 2002
Industries Processing exports in percent of industry exports
Domestic value added in processing exports
(%)
Electronic computer 99.1 3.9
Telecommunications equipment 91.2 8.4
Radio, TV and comm. Equipment 90.6 31.2
Household electric appliances 79.1 23.7
Toys/sporting/athletic/recreation products 72.9 39.7
Plastic products 64.5 12.5
Furniture 47.2 62.3
Wearing apparel 45.1 37.6
Textiles productions 24.0 30.0
Source: Koopman et al. (2008).
A more accurate measure of China’s upgrading trajectory can be obtained by focusing on China’s mix of non-processing exports, for which almost 90 percent of the export value is produced in China (see Table 2). In Table 6, we have disaggregated China’s non-processing exports according to their technological intensity. The data in the table suggest that China’s specialization pattern is in line with the predictions of standard trade theory. In both 1992 and 2005, China had a revealed comparative advantage (RCA>1) in the two lowest technology categories and a revealed comparative disadvantage (RCA<1) in the two highest technology categories. These numbers run counter to the suggestion that China’s comparative advantage is rapidly shifting from low-technology to high-technology products. 4
4 See Amiti and Freund (2008), Gangnes and Van Assche (2008) and Van Assche and Gangnes (2008) for further evidence.
Table 6 China’s Ordinary Exports by Technological Level Non-processing
exports (US$ mil.)
Share of non-processing exports (%)
Growth rate (%) RCA index 1992 2005 1992 2005 1992-2005 1992 2005 High-Tech 684 23,057 1.5 6.7 31 0.10 0.36 Med-high Tech 7,626 87,773 16.8 25.4 21 0.48 0.75 Med-low Tech 6,147 87,958 13.6 25.5 23 0.78 1.41 Low-Tech 19,773 123,704 43.6 35.8 15 2.46 2.78 Non-manufacturing 11,102 23,025 24.5 8.3 8 1.62 0.50 Total 45,333 345,518 100 100 17 1.00 1.00
Source: Van Assche et al. (2008), using China’s Customs Statistics Data.
V
ERDICTEven though China’s exports have primarily grown in high‐technology
industries, the production activities taking place in China have remained
low‐tech.
“Canadian firms are on a large scale moving
their manufacturing plants to China to take
advantage of its cheap labor, thus effectively
hollowing out Canada’s manufacturing sector.”
Supporting Evidence
here is a large and mounting apprehension among the Canadian public that its manufacturing firms have played a key role in both the build-up of China’s export sector and in the demise of Canada’s manufacturing industry. The argument goes as follows. Canadian firms that originally manufactured their products locally are now closing their plants and moving them to China to take advantage of its cheaper labor. This effectively is helping China to build up a highly competitive export industry and is also threatening our own manufacturing industry.
Two statistics seem to buttress this idea. First, 47.2 percent of China’s exports to Canada are processing exports, thus suggesting that almost half of China’s exports to Canada is conducted by firms who take advantage of the low cost of assembling components in China. Second, China’s processing exports are almost entirely conducted by foreign-invested enterprises rather than Chinese companies. When taken together, both statistics seem to suggest that Canadian and other Western companies’ decision to offshore their manufacturing plants to China is driving the rise of processing exports from China to Canada, thus hollowing out the Western manufacturing industries and building up China’s export sector.
T
Counter Evidence
The problem with this evidence is that it assumes that the foreign-invested enterprises responsible for China’s processing exports to Canada are Canadian or Western companies. Statistical evidence shows that this is not the case. Each year, China’s Ministry of Commerce compiles a list of China’s 200 largest exporting firms. Branstetter and Foley (2008) have analyzed this list and have shown that the majority of the exporting firms are indeed foreign invested enterprises, but that they primarily are from Taiwan, Hong Kong, and South Korea. Western firms play a relatively small role, with the total share of the U.S., European, and Japanese multinationals in the exports of these top 200 firms amounting to only 11 percent.
Furthermore, it is not the case that these Asian firms heavily rely on processing inputs from the West. As is shown in Table 7, almost 80 percent of China’s processing imports originate from China’s East Asian neighbors, while only 7.1 percent of processing imports originate from the United States, Canada and the EU-25.
Table 7 Source and destination market of China’s processing trade Share of processing exports
destined to: Share of processing imports originating from:
NIEs 31.1 62.9 Japan 12.0 10.4 ASEAN-4 3.2 5.5 United States 25.5 3.5 EU-25 19.3 3.3 Canada 1.3 0.3
The majority of
the Chinese
exporting firms
are indeed
foreign invested
enterprises, but
that they
primarily are
from Taiwan,
Hong Kong, and
South Korea.
So what is the reason why Western firms move their operations to China? In a recent paper, Branstetter and Foley (2008) demonstrate that Western firms mainly set up their operations in China to gain access to its large and growing consumer market. They use data on sales of U.S. affiliate in China to provide evidence of this. In 2004, 72.6 percent ($39.7 billion) of U.S. affiliate sales were directed to the Chinese market rather than exported. And only 6.8 percent ($3.7 billion) of these sales were exported to the U.S. market. Compared to China’s total exports to the U.S., this is a very small number.
V
ERDICTWestern firms that move their production plants to China generally do so
as a part of their strategy to improve their access to the large and
growing Chinese consumer market, and not to merely reduce their
production costs.
Concluding remarks
n this report, we have debunked three popular misconceptions related to China’s role in the global economy. Specifically, we have demonstrated that:
• While it is true that 11.7 percent of Canada’s manufacturing imports come from China, only half of that value is made in China.
• Even though China’s exports have primarily grown in high-technology industries, the production activities taking place in China have remained low-tech.
• Western firms that move their production plants to China generally do so as a part of their strategy to improve their access to the large and growing Chinese consumer market, and not to merely reduce their production costs. These facts provide us with a different picture of China’s role in the global economy than is generally portrayed by the popular press. China is not the rising dragon that is single-handedly challenging Western manufacturing firms in both low-technology and high-technology industries. Nor is China the Mecca of cheap labor that is on a large scale used by Western firms to reduce their production costs. Rather, China is used as a labor-intensive final assembly platform for primarily Asian firms that use it to export their final goods to the West. The Western firms that move their operations to China primarily do so to gain access to the large and growing Chinese consumer market.
I
Bibliography
Asia-Pacific Foundation of Canada (2006). “Canadian Business Views on China.”
http://www.asiapacific.ca/analysis/pubs/pdfs/surv eys/CME2006Survey.pdf.
Asia-Pacific Foundation of Canada (2008). “2008 National Opinion Poll: Canadian Views on Asia.”
http://www.asiapacific.ca/analysis/pubs/pdfs/surv eys/views_asia08.pdf.
Balassa, B. (1965). “Trade Liberalisation and ‘Revealed’ Comparative Advantage”, The Manchester School of Economic and Social Studies, 33, pp. 99-123.
Branstetter, L; Foley, F. (2007). “Facts and Fallacies about U.S. FDI in China.” National Bureau of Economic Research Working Paper 13470.
Branstetter, L; Lardy, N. (2006). “China’s Embrace of Globalization.” National Bureau of Economic Research Working Paper 12373.
Chang, H.; Ma, A.; Van Assche, A. (2008). “Global Production Networks and China’s Processing Trade.” Mimeo.
Ferrantino, M.; Koopman, R.; Wang, Z.; Yinug, F.; Chen, L.; Qu, F.; Wang, H. (2008). “Classification and Statistical Reconciliation of Trade in Advanced Technology Products: The Case of China and the United States”, mimeo.
Gangnes, B.; Van Assche, A. (2008). “China and the Future of Asian Technology Trade.” In L. Yueh (Ed.), The Future of Asian Trade: Economic Growth with
the Emergence of China, World Scientific Publishing,
Forthcoming. Previous version: CIRANO Scientific Papers 2008s-05, February 2008.
Hatzichronoglou, T. (1997). “Revision of the High-Technology Sector and Product Classification”, OECD Science, Technology and Industry Working Papers, 1997/2.
Hong, C.; Ma, A.; Van Assche, A. (2008). “Global Production Networks and China’s Processing Trade.” Mimeo.
Koopman, R.; Wang, Z.; Wei, S.-J. (2008). “How Much of Chinese Exports is Really Made in China? Assessing Domestic Value-Added When Processing Trade is Pervasive.” National Bureau of Economic Research Working Paper 14109.
Krugman, P. “The Myth of Asia’s Miracle.” Foreign
Affairs.
Linden, G.; Kraemer, K.; Dedrick, J. (2007). “Who Captures Value in a Global Innovation System? The Case of Apple's iPod.” Personal Computing Industry Center, mimeo.
Rodrik, D. (2006). “What's So Special about China's Exports?” China and the World Economy 14:5, pp. 1-19.
Schott, P. (2008). “The Relative Sophistication of Chinese Exports.” Economic Policy 23:53, pp. 5-49.
Taktik Chine (2006). “L’impact de la Chine sur le secteur manufacturier québécois.”
Van Assche, A. (2006). “China's Electronics Exports: Just A Standard Trade Theory Case”, Policy Options 27:6, pp. 79-82.
Van Assche, A.; Gangnes, B. (2008). “Electronics Production Upgrading: Is China Exceptional?” Applied Economics Letters, forthcoming.
Van Assche, A.; Hong, C.; Slootmaekers, V. (2008) “Compétitivité internationale de la Chine: Une réalité à réévaluer”, Le Québec à l’heure de la
mondialisation, CIRANO, Montréal, October 2008,
Some of the most recent Burgundy Reports published by CIRANO
A Banker’s Perspective on the Financial Crisis
Robert Amzallag, Michel Magnan, Bryan Campbell, January 2009
Experimental Economics: A Revolution in Understanding Behaviour
Jim Engle-Warnick, Sonia Laszlo, April 2008
When and Why Does it Pay to be Green?
Paul Lanoie, Stefan Ambec, Iain Scott, November 2007
Des billets verts pour des entreprises vertes?
Paul Lanoie, Stefan Ambec, Iain Scott, November 2007
Le Québec et les droits de scolarité universitaire
Robert Lacroix, Michel Trahan, February 2007
Les nanotechnologies: bénéfices et risques potentiels
Bernard Sinclair-Desgagné, Dina Feigenbaum, Albert Nsamirizi, May 2006
Les terrains contaminés au Québec : quels sont les risques pour les prêteurs?
Sophie Lavallée, May 2006
Pour un financement durable de la santé au Québec
Claude Montmarquette, Joanne Castonguay, Virginie Giroux, December 2005
L’utilisation des nouvelles technologies par les consommateurs etl es détaillants canadiens
Jacques Nantel, December 2005
La problématique de la dette publique au Québec : causes, conséquences, solutions
Marcelin Joanis et Claude Montmarquette, September 2005
La réglementation de l’énergie au Québec
Robert Clark et Andrew Leach, May 2005
Les conflits de localisation : le syndrome NIMBY
2020, University street, suite 2500, Montréal (Québec) H3A 2A5 Tel.: 514-985-4000 ● Fax : 514-985-4039
www.cirano.qc.ca ● info@cirano.qc.ca


![[PDF] Cours Adressage de réseaux en PDF | Cours informatique](data:image/gif;base64,R0lGODlhAQABAIAAAP///wAAACH5BAEAAAAALAAAAAABAAEAAAICRAEAOw==)