HAL Id: hal-02130055
https://hal-mines-paristech.archives-ouvertes.fr/hal-02130055
Submitted on 18 Dec 2019
HAL is a multi-disciplinary open access
archive for the deposit and dissemination of
sci-entific research documents, whether they are
pub-lished or not. The documents may come from
teaching and research institutions in France or
abroad, or from public or private research centers.
L’archive ouverte pluridisciplinaire HAL, est
destinée au dépôt et à la diffusion de documents
scientifiques de niveau recherche, publiés ou non,
émanant des établissements d’enseignement et de
recherche français ou étrangers, des laboratoires
publics ou privés.
Danish wind turbine fleet with LCA_WIND_DK, an
online interactive platform
Romain Besseau, Romain Sacchi, Isabelle Blanc, Paula Perez-Lopez
To cite this version:
Romain Besseau, Romain Sacchi, Isabelle Blanc, Paula Perez-Lopez.
Past, present and future
environmental footprint of the Danish wind turbine fleet with LCA_WIND_DK, an online
in-teractive platform. Renewable and Sustainable Energy Reviews, Elsevier, 2019, 108, pp.274-288.
�10.1016/j.rser.2019.03.030�. �hal-02130055�
Past, present and future environmental footprint of the Danish wind
turbine fleet with LCA_WIND_DK, an online interactive platform.
Romain Besseau*
a, Romain Sacchi
b, Isabelle Blanc
a, Paula Pérez-López
aa MINES ParisTech, PSL Research University, Centre Observation, Impacts, Energie (O.I.E.), France b Department of Planning, Aalborg University, Aalborg, Denmark
*Corresponding author: romain.besseau@mines-paristech.fr
Wordcount: 8650
Abstract
Renewable energy systems are promoted and developed notably due to their low environmental footprint. Fleet-wide robust environmental assessments are needed to drive the sustainable transition of energy systems worldwide. This
study introduces a tailored comprehensive impact assessment methodology for fleets of renewable energy systems based on Life Cycle Analysis and its application to Danish wind turbines fleet through an online platform
LCA_WIND_DK (viewer.webservice-energy.org/lca-wind-dk/). This platform enables to visualize environmental performances of wind turbines in Denmark and their temporal evolution. The fleet is known in detail from 1980 to 2016
and projected from 2017 to 2030 based on national objectives for onshore/offshore capacity and pre-approved offshore projects. Each turbine‘s future electricity production is estimated from its power curve and geo-localized wind
time-series. More than 10,000 cradle-to-grave life cycle inventories are generated, considering the spatio-temporal context and technological characteristics. The comprehensive analysis of the Danish fleet over fifty years reveals long-term
trends for several impact categories. Improvements in all categories follow similar trends as in climate change, which decreases from 40 to 13 g CO2-eq/kWh between 1980 and 2030. Improvements stem from combined economies of
scale and higher load factors linked to increasingly large and powerful turbines. The interactive mapping tool LCA_WIND_DK may provide statistics to support renewable energy oriented policy scenarios and unique
spatio-temporal environmental information to project developers. This novel approach designed for large territories, here applied to the Danish wind turbine fleet, is generic and can be applied to other renewable energy systems and/or to other
territories.
Keywords: wind turbine, Danish fleet, environmental performance, dynamic, future projections, multicriteria life cycle
2
Abbreviations
CED Cumulative Energy Demand
GIS Geographic Information System
GUI Graphical User Interface
GWP Global Warming Potential
ILCD International Reference Life Cycle Data System
IPCC Intergovernmental Panel on Climate Change
LCA Life Cycle Assessment
LCI Life Cycle Inventories
LCIA Life Cycle Impact Assessment
MERRA Modern-Era Retrospective analysis for Research and Applications
RES Renewable Energy Systems
TSO Transmission System Operator
ρ air density
P wind turbine power output
Pnom wind turbine nominal power
Cp wind turbine power coefficient
d wind turbine rotor diameter
EPturbine wind turbine environmental performance
LC impactturbine wind turbine life cycle impact
1 Introduction
Renewable energy systems (RES) are being increasingly developed and installed globally to reduce the environmental
footprint of fossil-based energy systems around the world. In 2016, more than 60% of net additional power generating capacity was considered to come from RES, going up to 70% in 2017. A quarter of that energy originated from wind
power alone [1,2]. At the European level, for the last decade, investments in RES have increased at the expense of fossil-based conventional technologies: the gross production of electricity from RES went from 21.8% in 2010 to 30.7%
in 2015 [3]. However, strong disparities exist between countries for RES development as some first-movers have made early investments in renewable energy technologies and have now the largest fleets of RES: Germany with photovoltaic
panels, Norway with hydro power-generating dams, Iceland with geothermal power plants and Denmark with wind turbines [4,5].
Even though RES are based on renewable energy sources, they are not neutral to the environment, since energy and materials are required to manufacture, install, maintain and dismantle them [6,7]. Life Cycle Assessment (LCA) is an
appropriate tool to assess and compare the environmental footprint of RES to conventional technologies [8,9]. It assesses the environmental performances of such RES by including all environmentally-relevant phases of their life
cycle in relation to the provision of electricity. LCA studies on different types of RES converters (photovoltaic panels, wind turbines, tidal converters) have been regularly published and paved the way to meta-LCA studies (i.e. statistical
analysis of multiple LCA studies) that compare RES [10–12].
Despite the fact that RES now supply a significant share of electricity in a number of countries, the contrasting designs
within a same technology as well as a poor knowledge surrounding their use lead most environmental assessment studies to consider them in isolation from the rest of the fleet. Yet, fleet-wide robust and accurate energy and
environmental assessments are needed to drive the sustainable transition of energy systems around the world [13]. Therefore, this article presents a generic environmental impact assessment methodology that considers the individual
variability in designs, manufacture and conditions of use to provide a bottom-up environmental characterization of a fleet of RES. This generic methodology, here applied to wind turbines in Denmark over 50 years, is implemented in the
online interactive platform LCA_WIND_DK (viewer.webservice-energy.org/lca-wind-dk/), which allows visualizing the energy and environmental performance of any wind turbine that was, is or will be operating in Denmark between
1980 and 2030. In parallel, the tool also allows grasping the improvements of the technology as a fleet over time and confirms its intended environmental benefits compared to conventional fossil-based technologies. An example is shown
in Figure 1, where LCA_WIND_DK gives load factor-related performance details both on a specific wind turbine, and on the fleet over time, within specific filtering conditions sets by the user.
4 Figure 1 LCA_WIND_DK graphical interface showing load factor-related performance for a wind turbine located in the
Horns Rev wind farm.
Such large-scale studies could be used, for instance, by policy makers and industrial stakeholders to support and orient the development of wind power toward the use of the most environmentally efficient type of wind turbines. The authors
of the present article identify three reasons for the inability as well as the poor use of detailed LCA studies to model
large-scale fleet of RES. First, the necessary life cycle inventories (LCI) are not made transparent and available neither in the scientific literature nor in the grey literature to be easily reused. Second, the available studies do not cover the
spectrum of models currently on the market – for example when considering wind turbines with over 1,500 unique models of turbines marketed as of today. Third, the published LCA studies are often based on different assumed values for temporally and geographically-sensitive parameters that relate to the manufacture phase (e.g. country of
manufacture) or the use phase (e.g. service time, load factor). This last point, identified as critical by Raadal et al. [14],has prevented meta-LCA studies to compare sampled studies on a fair basis [15,16]. Instead, LCA studies of
electricity mixes or nation-wide fleets often rely on generic plant datasets available in commercial LCI databases. This
is the case of the environmental assessments of the electrical systems of Mauritius [17], Portugal [18], Mexico [19] and Denmark [20]. In these studies, all power generation infrastructures, renewable or not, are modeled using ecoinvent datasets [21]. Regarding wind power facilities, for example, ecoinvent offers three datasets based on nominal power
classes for onshore wind turbines (<1 MW, 1-3 MW and >3 MW) and one dataset for offshore wind turbines (1-3 MW). They are adapted from the manufacture requirements of four wind turbine models. Their associated load factors are
determined based on estimated wind availability at full load for a specific geographical area and an assumed service time of 20 years [22]. Generic inventories and assumed values for the load factor and the lifetime are a limitation that
can potentially affect the validity and robustness of a study at a national level [23]. Indeed, wind turbines modeled after generic inventories may not be representative of a fleet and fail to consider the specificity of some attributes (e.g., rotor
size, tower height) and the dependency between the load factor and these attributes. In addition, the lifetime and the load factor have been recognized as the most sensitive aspects in multiple LCA studies on RES [24–26] as they
determine the electricity production the environmental impacts are normalized upon. In this regard, Denmark, for example, has more than 6,000 wind turbines currently in operation, under 400 different commercial model names,
manufactured over several decades and installed on an area of 43,560 km2 with contrasted exposure to wind [27]. This
diversity undeniably induces an important technological, temporal and geographical variability within the population that needs to be considered, should the assessment be representative of the fleet‘s environmental performance.
Variability, also referred to as stochastic uncertainty, originates from variations in technologies, locations of
manufacture, applications and designs of RES and the influence of time on background processes at the manufacture phase. The high impact of variable parameters on the sensitivity of RES environmental performance is demonstrated in
[25] and [26]. Uncertainty, also referred to as epistemic uncertainty, is, in the case of RES, mostly due to a lack of knowledge on the conditions that govern the use phase (i.e., electricity generation phase). The issue of poor knowledge
on the use phase of RES has been underlined by, among others, Jungbluth et al. [28] and Padey et al. [24]. As above-mentioned, they identified the load factor and the lifetime as key parameters that largely explain the observed variability
on the environmental performance of wind power. For the LCA of national electrical systems with a high share of
renewable energy, both variability and uncertainty issues in generic LCI for RES are scaled up in relation to their respective share of supply in the network. This is notably the case for Denmark, where the wind power penetration rate stood at 46% of the gross production in 2016 [29]. Despite the predominance of wind power, the current LCA model of
the Danish Transmission System Operator (TSO) relies on generic wind turbine inventories and conditions of use from the Gabi LCI database [30]. The work of Turconi et al. [20] may be cited as an ambitious attempt to model detailed
projections of the Danish electricity system with increasing shares of RES, based on observed production data provided
by the national TSO. Yet, the RES were modeled here again using generic inventories, via the LCA energy-modeling tool EASETECH Energy [31] that indirectly uses ecoinvent predefined inventories.
The present article advocates that, to gain precision in the assessment of the environmental performance of large RES fleet, technologically, temporally and geographically-sensitive LCI of the individual units must be considered. Indeed, the environmental performance of wind turbines for example largely depends on their attributes, conditions of
6 manufacture and use, which can significantly differ from one another [26,32] and have enough weight to provide a wrong picture of the environmental performance of the fleet.
Moreover, when using LCA as a support for decision within the field of RES, the prospective dimension should be considered [33]. Indeed, renewable energy technologies are not static; they evolve rather rapidly and improve over time.
Photovoltaic energy is an impressive illustration as its energy payback time was approximately divided by five between 1992 and 2014, following a similar downward trend as it has been observed for its cost curve [34]. For such cases,
ignoring these rapid improvements may be seriously misleading. Prospective LCA becomes essential to support long-term decision making for investments in energy infrastructures.
The online platform LCA_WIND_DK presented here illustrates the importance of fleet-wide environmental assessments, applied to the wind power sector. It is based on an approach developed in this work to perform
comprehensive bottom-up environmental assessments of past, present and future fleets of RES on a large scale (i.e. national level) that considers most sources of LCI variability (i.e., spatio-temporal and technological variability).
Making use of a parameterized LCI model developed for wind turbines [26], the approach is applied to the past, current and future fleet of wind turbines in Denmark from 1980 to 2030. Therefore, it provides a more realistic and accurate
nationwide multicriteria environmental characterization of the technology in the country than generic-inventory based studies. The approach, presented in section 2, relies on three additional elements: i) the projection of the RES fleet at a
fixed time horizon, ii) the estimation of the future electricity production of RES and iii) the generation of technologically, temporally and geographically-sensitive life cycle inventories for each individual of the fleet. This
allows delivering a multicriteria characterization of the environmental performance of the RES fleet but also of the individuals it is composed of.
The results, calculated for more than 11,000 tailor-made LCI, are presented in section 3. They highlight the overall improvements of the environmental performance of the fleet over 50 years of operation regarding several impact
categories such as climate change, resource depletion, ecosystem quality and human health. It is followed by section 4,
which presents the development and use of LCA_WIND_DK. This open-access and interactive mapping tool enables the user to obtain detailed LCA results for individual wind turbines and to conduct technical or temporal analyses of the environmental performances of the complete Danish fleet. The online platform has been specifically developed to locate
and visualize the environmental performance of any given wind turbine against the above-mentioned impact categories. It also allows comparing the performance of an individual wind turbine against similar installations based on the
nominal power output, location, technology and period of operation or simply against the rest of the fleet. For example,
between the first wind turbines installed in 1980, and the wind turbines projected for 2030 for a similar nominal power output range. Additionally, LCA_WIND_DK can compile the environmental performance of a sample of the fleet
according to specific conditions set by the user. In that sense, it is for example possible to observe the evolution of the average energy payback ratio for offshore wind turbines with a nominal power output above 4 MW. Possibilities in
terms of filtering and visualization are further described in section 4.
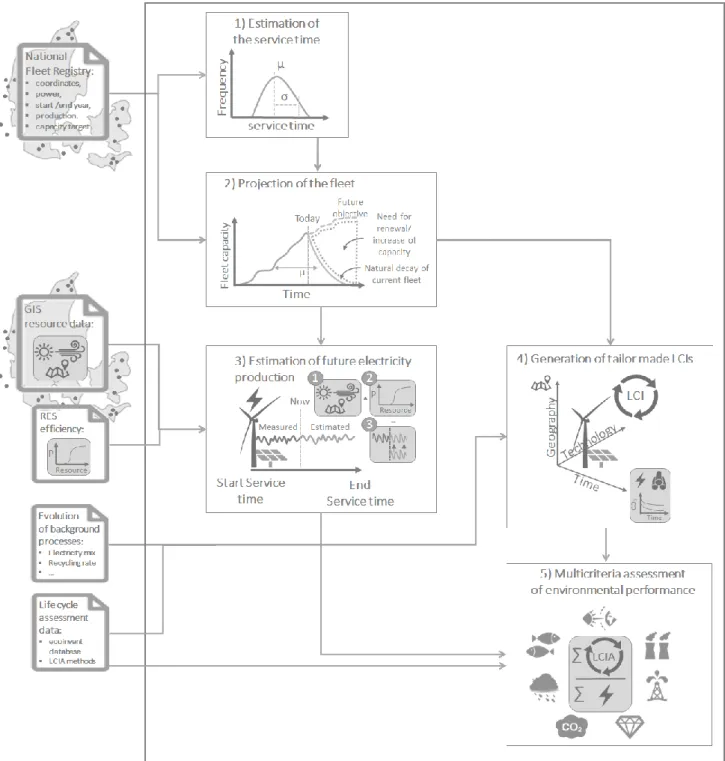
2 Method
This section describes the method used to assess the environmental impacts of a fleet of RES and each individual unit over time, including the near future. The method, applicable to any region and type of RES, is first presented for an
unspecified fleet of RES before being detailed for the specific fleet of wind turbines in Denmark between 1980 and 2030. The LCA results for the Danish fleet are then fed into the online platform LCA_WIND_DK.
As a starting point, the method requires the registry of the target RES installed in the studied area. This registry should contain key information on the installed systems such as the nominal power, dimensions, geographical coordinates,
commissioning date, registered electricity production during service time, and ideally, brand and model names. Then, GIS resource data and RES efficiency curves can be used to assess the future production of individual RES.
Additionally, ecoinvent data are used to provide inventories for background activities with a temporal adjustment of the most-influencing key processes. Finally, impact characterization methods are required to assess the environmental
performance of individual RES regarding several impact categories. Once these data are available, the 5-step approach here proposed, which is graphically summarized in Figure 2, can be applied:
1. Estimation of the service time and decommissioning date for operating RES: The decommissioning dates of RES currently operating can be estimated based on the historical service time values of previously
decommissioned installations. This is discussed in subsection 2.1 for the case of wind turbines.
2. Projection of the fleet of RES, including refurbishment operations, to fulfill future objectives in term of
installed capacity: Within the projection period, the end of life of operating RES can be estimated based on the findings from Step 1. For each year, RES that reach their end of life are considered to be replaced by newer
installations. Additional RES can be installed to compensate gaps between the installed capacity and the objective to be achieved in that year. Information found in pre-approved project permits can be used to locate
future installations, as presented in subsection 2.2.
3. Estimation of the future electricity production of RES: Once the past, present and expected production capacity
installed is known for the entire period, the future electricity production of each individual RES is estimated from historical production or by combining the conversion efficiency of the RES with renewable energy
8 resource data. In the case of wind turbines, power curves and geo-localized wind time-series provided by the MERRA-2 [35] weather reanalysis model can be used, as discussed in subsection 2.3.
4. Generation of tailor made LCI that consider variability of technological, temporal and geographical nature: Technologically, temporally and geographically-sensitive LCI are generated following the method described in
detail in [26] for each individual RES that constitute the fleet over the studied period. This is discussed in subsection 2.4.
5. Multicriteria assessment of the environmental performance of individual RES and complete fleet: Finally, the environmental performance of each individual unit is evaluated against a set of impact categories using the
LCA framework Brightway2 [36], and the performance of the complete fleet is then calculated for each year of
Figure 2: The 5-step approach to assess the past, present and future environmental performance of a RES fleet.
The following subsections present in detail the 5-step approach developed and specifically applied to assess the
environmental performance of the Danish fleet of wind turbines between 1980 and 2030.
2.1 Estimation of the service time and decommissioning date for operating wind turbines
From 1980 to the end of the year 2016, 3,121 wind turbines were decommissioned in Denmark. The distribution of theirservice time is approximated by a normal probability distribution with a mean value between 18-19 years and a standard deviation of 4 years [26]. Theoretically, wind turbines are designed to operate well above 20 years. In practice, the
10 service time of wind turbines strongly depends on the use environment (e.g., harsh weather) as well as on the evolution of the marginal costs of maintenance against the marginal income from electricity production, as indicated in a technical
report on Danish wind turbines [37]. After a deep analysis of the available data, no obvious statistical relationship between the service time of decommissioned wind turbines and any of their attributes (e.g., date of installation, brand,
model, location) was found. Their service time seems to be ruled by economic imperatives. For these reasons, the service time of all individual units operating between 2017 and 2030 are set to follow the same statistical distribution.
The year at which wind turbines are expected to be dismantled between 2017 and 2030 is obtained by subtracting the current age of operating wind turbines to a total age value randomly drawn from a normal distribution centered on the
mean value of 18.4 years. As a result, the environmental performances calculated and analyzed in this study are
conservative. Impacts per unit of energy generated would reduce if modern wind turbines had longer lifetimes, or if wind turbines reaching their end of life were repowered [38], thereby increasing the lifetime of their fixed parts. Alternatively, if the data needed to produce such distribution are not available or if the lifetime distribution of the RES
may strongly evolve over time, an estimated distribution of lifetime based on manufacturers‘ specification or literature can be used.
2.2 Projections of the Danish national fleet
Once the decommissioning year for each wind turbine is known, it is possible to project the decline of the installed power capacity of the current onshore and offshore fleet over time, as shown by Figure 5 in section 3.1 (and in the
Supporting Information). The future capacity objectives for onshore and offshore installations provided by the Ministry of Energy [39] are superimposed to the installed power capacity of the current fleet, depicted by a red line in Figure 5 of
section 3.1 (also by the blue bars in the Supporting Information). For each year Y after 2016, the residual power capacity of the fleet at year Y-1 is subtracted to the objective in terms of production capacity for the year Y for both
onshore and offshore installations. This returns the onshore and offshore power capacity to be installed. In the rare case where the residual power capacity already exceeds the objective, no turbine are refurbished nor installed.
For onshore wind turbines, the additional capacity at a given year is first satisfied by refurbishing wind turbines that reach their year of decommission with wind turbines of an equivalent nominal power output at the same location. The
remaining missing capacity is then completed with the installation of new wind turbines. In the absence of information regarding the location of future onshore wind turbines, new installations are located randomly across Denmark‘s land
territory. This may seem at first a critical choice knowing the importance of wind availability on the environmental performance of a wind turbine. However, as described in results section 3.1, the number of additional onshore wind
turbines installed between 2017 and 2030 remains limited. New installations consist of standard 3.6 MW wind turbines until 2020, which corresponds to the nominal power range that has been growing the fastest on the Danish market. After
that, 6 MW wind turbines are considered to be installed between 2021 and 2025, and 8 MW wind turbines from 2026 until 2030. The chosen nominal power range values constitute a conservative assumption, as wind turbines of similar
nominal power have already been successfully tested and installed [40].
For offshore wind turbines, installations that reach their year of decommission are replaced with larger models at the
same location. Based on recent trends on the Danish market, the nominal power output of new offshore installations is set in the same ranges of the onshore ones (3.6 MW between 2017 and 2020, 6 MW between 2021 and 2025 and 8 MW
from 2026 and up). Unlike projections for onshore capacity, many additional offshore installations are planned and located within the future offshore parks pre-approved by the Danish Ministry of Energy [41] and listed in Table 1.
Table 1 List of future offshore wind farms in Denmark. Source: [41]
Project name Expected total capacity (MW) Cumulated capacity (MW) Latitude Longitude
Horns Rev 3 410 410 55,54 7,58 Kriegers Flak 600 1010 55,02 12,77 Omø Syd 320 1330 55,07 11,11 Vesterhav Syd 200 1530 56,1 7,94 Vesterhav Nord 200 1730 56,11 7,92 Jammerland Bugt 240 1970 55,61 10,87 Mejl Flak 120 2090 56,04 10,4 Lillebæt Syd 160 2250 55,16 9,8
2.3 Estimation of the future electricity production of Danish wind turbines
For wind turbines that have already operated for several years (i.e., more than 4 years), the future electricity production
is estimated from historical production of the wind turbine registered by the Danish Ministry of Energy. As the electricity production is often lower during the first year due to a trial period, the median load factor was considered
more representative of the typical production than the average load factor. It is therefore used as the reference for
historical load factor.
In the case of wind turbines for which historical production data are insufficient or inexistent, this is not possible. Hence, geo-localized wind time-series provided by the MERRA-2 weather reanalysis model are used, as further
explained in Section 2.3.1. Wind time-series are combined with the power curves of the wind turbines, presented in Section 2.3.2, to estimate the electricity production of individuals for which historical production was not sufficient.
The estimated electricity production obtained in that manner is corrected to statistically match the observed electricity production of wind turbines, as explained in Section 2.3.3.
12
2.3.1 Geo-localized wind time-series from MERRA-2
MERRA-2 is a weather reanalysis model that provides historical geo-localized wind time-series with a one-hour time
step and a spatial resolution of 0.5° latitude x 0.667° longitude [35]. This resolution, the highest available, corresponds to increments of approximately 50 km at Danish latitudes. Wind speed time series between 2000 and 2016 are
downloaded for each point of the MERRA-2 grid that cover the Danish territory and at the location of each future offshore wind farm at an 80 meter height. A vertical wind speed gradient is extracted from Renewables.ninja data [42]
and used to extrapolate wind speed data to the wind turbine hub height (see Supplementary Information). For onshore and offshore wind turbines, local wind availability is approximated by the value of the closest point given by the
MERRA-2 datasets without interpolation (see Supplementary Information). The absence of interpolation to simplify the calculations is deemed acceptable as very local effects cannot be correctly considered with such a coarse spatial
resolution.
2.3.2 Known and estimated power curves
The online simulation tool Renewables.ninja, described in detail in [42,43], includes the power curves of 121 wind turbine models based on manufacturers‘ specifications. In the current study, power curves from this tool are used
whenever a match on the model name is found. When this is not possible, a basic model that accepts nominal power ( ) and rotor diameter (d) as inputs is used. This model, based on Equation 1, is used to generate an estimation of
the power curve, which gives the output power as a function of the wind speed , together with cut-in and cut-out
wind speed, and the convolution with a Gaussian filter to consider the effect of wind turbulence.
( ) ( )
Where ρ is the air density, the rotor diameter and Cp the wind turbine power coefficient which is set to 0 . The used
Cp value is the average Cp value observed for the 121 power curves of wind turbines provided by Renewables.ninja (see Supporting Information). The power output cannot logically exceed the nominal power output of the wind turbine. Additionally, cut-in and cut-off wind speeds are introduced as a threshold to start power production and another one to
stop the production to preserve the wind turbine from damage: thus, at wind speeds below 3.5 m/s and above 25 m/s, the corresponding production is considered null.
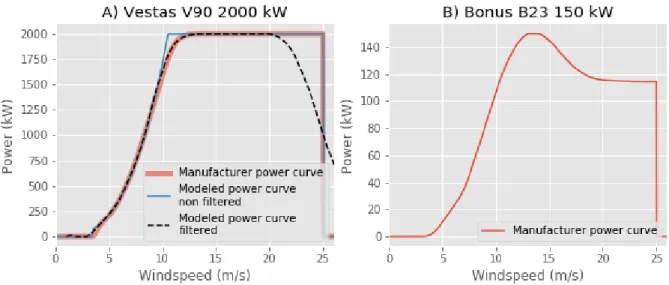
Following that procedure and using the nominal power output and rotor dimension as inputs, a model-specific power curve can be generated. As an example, the blue curve in Figure 3A) is generated for the Vestas V90 2000 kW wind
turbine. The generated curve corresponds to a zero-turbulence power curve where the wind does not fluctuate, neither temporally, nor spatially [44]. To consider the effect of wind turbulence, the red power curve is convoluted with a
Gaussian filter of a variable width corresponding to a fraction of the wind speed where it is calculated. This fraction corresponds to the wind turbulence intensity and is set to 10% for offshore wind turbines as measured in the Horn Rev
wind farms [45] and slightly higher at 15% for onshore wind turbines [46]. The smoothed power curve thus calculated and represented with a black dashed line in Figure 3A) is very similar to the manufacturer‘s power curve plotted in red.
For most wind turbine models inventoried in this study, the estimated power curves generated from this basic model fit relatively well the manufacturers‘ power curves (see Supporting Information). However, on small wind turbines without
pitch control, the power curve has a different behavior, as illustrated by the red power curve on Figure 3B). For wind turbines with a nominal power output lower than 150 kW, the power curve of the Bonus B23, a 150-kW wind turbine, is
used as a proxy.
Figure 3 Manufacturer and modeled power curve of a Vestas V90 and typical small wind turbine power curve
2.3.3 Recalibrating the estimated load factor
Knowing both the power curve and the local wind speed time-series allows estimating the load factor and expected
electricity production. In the current work, the load factor is first estimated for each wind turbine (including past,
present and future installations) using the model-specific power curve and the corresponding wind speed data. The annual load factor is first calculated for each turbine over the 2000-2016 period and the mean is considered as the
estimated load factor, given that there is an inter-annual variability in the wind resource (see Supporting Information).
Secondly, the estimated load factor of each wind turbine that has a production history is compared to the historical load factor. The average historical and estimated load factors at the fleet level for both onshore and offshore installations are
calculated by giving weight to the nominal power output of the individual units to avoid the over-representation of the
numerous domestic and residential models. Indeed, small wind turbine models represent an important number of wind turbines installed but a very low share of the total production capacity in the country. Prior to any correction, estimated
14 load factors returned 30% and 18% higher values than historical load factors for onshore and offshore installations, respectively. This overestimation is typical of reanalysis models and it is well established that such models suffer from
significant spatial bias that need to be corrected [43]. Previous studies have already found an overestimation of 30% for onshore wind production from MERRA-2 data in the United Kingdom and 12-18% for offshore farms in the North Sea
[43,47]. This is due to a possible overestimation of the wind resource by the reanalysis model especially for onshore locations (underestimation of the surface roughness on land), combined with the non-consideration of wake losses when
turbines are grouped in farms reaching up to approximately 15% [48,49], and a few additional percent of losses in power transformers and cables [50] as well as downtime interruptions for maintenance [51]. To account for the
above-mentioned aspects, estimated load factors, which will be used to model future production, are statistically adjusted
considering the above-mentioned differences between estimated and historical load factors by using correction coefficients for onshore and offshore installations. The comparison between the cumulative distribution of the adjusted
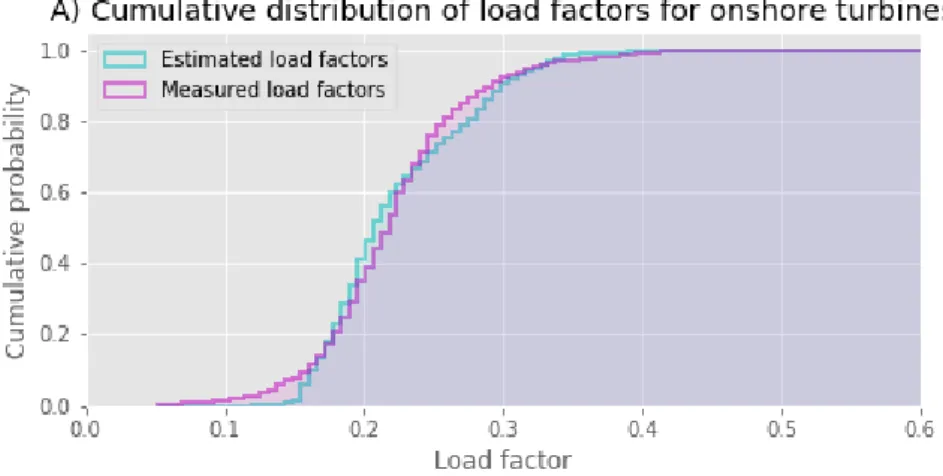
estimated load factors from geo-located wind data and power curves and that of the load factors obtained from the
measured production calculated with Equation 2 is illustrated in Figure 4 for both onshore and offshore turbines. The distribution function can be found in the Supporting Information. This comparison shows that, once adjusted, the
distributions are very similar and confirm that the results can be used to assess the load factor and expected electricity production of the different wind turbines and the fleet in general. The future annual load factor of the fleet thus
estimated is coherent with results published in the literature [52]. It is important to note that, when considering a given
wind turbine, the estimated production should be looked at with caution as there is an inherent model uncertainty, especially for onshore wind turbines. Indeed, the 50 km spatial resolution currently limits the model to consider local effects.
∫ ( ( ))
In Equation 2, ( ( )) is the instantaneous output power function of instantaneous wind speed ( ) varying with time,
the nominal turbine capacity and C is the correction coefficient with values of 0.30 and 0.18 for onshore and
offshore wind turbines in Denmark, respectively. These values correspond to the above-mentioned ratios between estimated load factor values, obtained from the combination of MERRA-2 data and wind turbine power curves, and
observed load factor values, obtained from onshore and offshore wind turbines for which historical production data are available.
Figure 4 Comparison of estimated and measured load factor for onshore and offshore wind turbines in Denmark
2.4 Generation of geographically, temporally and technologically-sensitive inventories
Once the entire fleet is characterized over the studied period, individual technologically, temporally and geographically-sensitive LCI are generated, making use of the parametrized model presented in Sacchi et al. [26] and ecoinvent 3.3 LCIdatabase corresponding to a cut-off approach [21].
The temporal dimension is considered by adjusting the national electricity mix and the recycled steel content to the year
of manufacture of a given wind turbine. To do so, electricity supply mixes between 1980 and 2016 [29] and projections between 2017 and 2030 [39] supplied by the Danish Ministry of Energy are used for the inventory modeling of the
electricity mix (see Supporting Information). As Denmark does not have any domestic production of steel, data from the German association of steel producers are used for historical recycling rates until 2016 in Germany [53] and projected
using a regression fit to forecast recycling rates until 2030 (see Supporting Information).
In addition to the use of geo-localized wind speed data to estimate the future power production, the geographical
16 distances to the shore for offshore installations, to estimate the size of underwater foundations and the connection to the continental electricity grid.
The parameterized LCI model also considers the technological dimension by retrieving the brand and model names of the wind turbines that operated between 1980 and 2016 from the national wind turbines registry provided by the Danish
Ministry of Energy. In order to obtain the mass and size of the different components of the wind turbines, the parameterized LCI model matches the model name against a database provided by TheWindPower [54], which lists
1,575 models. The additional wind turbines installed between 2017 and 2030 are not identified, as they are not associated to a specific brand or model name. The parameterized LCI model approximates the mass and size attributes
of unidentified wind turbines using scaling functions based on the 1,575 models listed in TheWindPower database.
2.4.1 The case of unidentified small wind turbine models
The scaling functions used by the parametrized LCI model in case of unidentified wind turbine models build on data from wind turbines with a nominal power output higher or equal to 100 kW. Therefore, attributes of smaller wind
turbines have to be approximated differently. The weight of components of wind turbines which nominal power output is inferior to 100 kW is directly interpolated from the specifications of a Gaia-Wind 133 10 kW model and a Vestas
V20 100 kW model. These two wind turbine models are chosen as the lower and upper bounds for the interpolation because they represent more than a third of the identified turbines in their power category. The tower weight, which is a
particularly important parameter, is dimensioned using a specific scaling function presented in the Supplementary information. This scaling function depends on the turbine dimensions and is calibrated based on data from several
domestic and residential wind turbine manufacturers. It is important to note that some of these models can be installed on lattice towers which are lighter to steel tube towers. This would reduce the environmental footprint of the wind
turbine as the tower is usually an important source of impacts. Indeed, the steel used for manufacturing the tower represent around 20% of environmental impacts for wind turbines with nominal power output superior to 1 MW, but up
to 33% for wind turbines with a nominal power output inferior to 100 kW equipped with a steel tube tower. However, wind turbines with a nominal power output below 100 kW represent only 1.2% of the total capacity installed over the
studied period.
2.5 Multicriteria assessment of environmental performance
The material and energy requirements for each wind turbine are calculated using the LCA framework Brightway2. The
complete inventory for each wind turbine that composes the fleet over the studied period is estimated and the associated environmental burden is characterized according to the impact category indicators of the following methods:
- ILCD (1.0.8 2016 midpoint) ecosystem-related impact categories: freshwater and terrestrial acidification, freshwater eutrophication and eco-toxicity,
- ILCD (1.0.8 2016 midpoint) resources-related impact indicators: land use and mineral, fossils and renewable resources use,
- ILCD (1.0.8 2016 midpoint) human health-related midpoint impact indicators: ozone layer depletion, carcinogenic and non-carcinogenic effects as well as respiratory effects from inorganics,
- ReCiPe Endpoint (H,A) impact indicators for metals and fossil resources depletion, - Ecological scarcity 2013 midpoint impact indicator for freshwater resources depletion,
- Cumulative energy demand indicators for renewable and non-renewable energy sources.
The environmental performance (Equation 3) of each wind turbine, , is then calculated as the ratio between its
life cycle impacts, , calculated as the sum of the impacts over the lifetime (Equation 4) and its
electricity production, , summed over the lifetime (Equation 5). As described above, the electricity
production is measured until 2016 and estimated between 2017 and 2030.
∑ ∑
The environmental performance of the fleet for a given year is calculated as the sum of the life cycle impacts of the wind turbines being part of the fleet that same year divided by the sum of their electricity production (Equation 6).
( ) ∑ ∑ ∑ ∑
3 Results and discussion
3.1 The fleet composition from 1980 to 2030
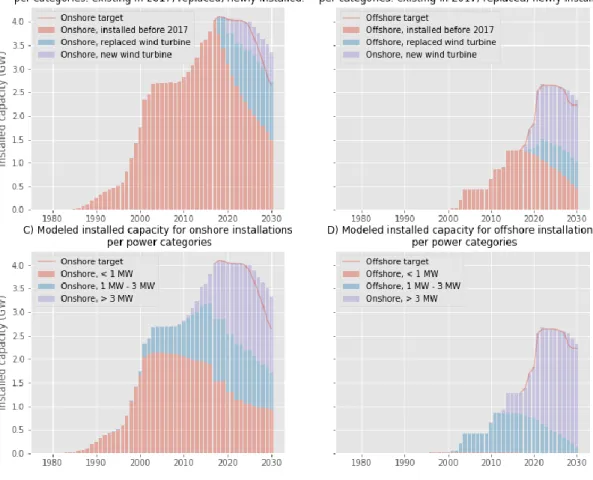
Figure 5 shows the installed capacity for the whole evaluated period, including after the fulfilment of the production
capacity objectives until 2030. It also indicates the power categories of wind turbines installed and shows a trend in
favor of large wind turbine models. Before 2000, the Danish fleet was composed of wind turbines with capacities lower than 1 MW and a high number of small wind turbines with a nominal power as low as 11 kW. At the beginning of the
18 2000‘s, 1-3 MW wind turbines were developed and installed both onshore and offshore. Since 2010, a new generation
of more powerful turbines has been developed with prototypes up to 11 MW in 2016.
Fulfilling the production capacity objectives from 2017 to 2030 entails the replacement of 2,075 wind turbines and the installation of 499 new wind turbines, mostly offshore. On the one hand, the simple replacement of onshore wind
turbines nearly allows fulfilling the objectives even without increasing the nominal power of the new wind turbines. On the other hand, the offshore objectives clearly require new installations in addition to those that are replaced, even
though the nominal power of the new wind turbines increases. This is shown in Table 2. There is a small surplus of capacity between 2025 and 2030. This indicates that objectives could be easily revised upwards during that period.
Table 2Replaced and new installations to fulfil the capacity objectives between 2017 and 2030
Onshore Offshore Total Units GW Units GW Units GW Replaced wind turbines 1,964 1.23 111 0.59 2,075 1.82
New installations 232 0.61 267 1.31 499 1.92
Figure 5 Modeling of the need for replacement and future installed capacity to fulfill the Danish objectives
3.2 Evolution of the carbon footprint of the fleet over 50 years
The analysis of the environmental performance of all the wind turbines installed in Denmark between 1980 and 2030
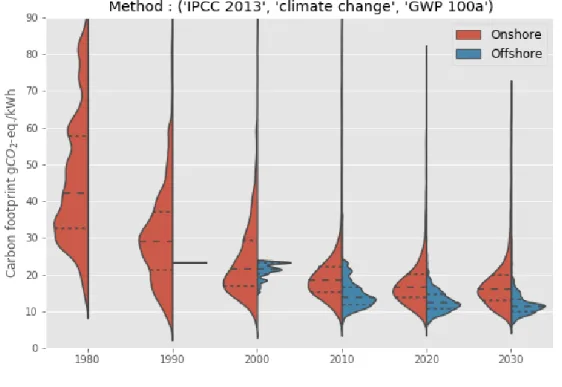
reveals significant improvements accomplished by the wind industry until now and expected in the near-future. Figure 6 shows the evolution of the distribution of climate change impacts of the wind turbines over the entire period. Dashed
lines correspond to the median value and dotted lines to the 1st and 3rd quartiles. Most of early onshore wind turbines have a carbon footprint ranging from 30 to 60 g CO2-eq/kWh, corresponding to the environmental performance of small
wind turbines [26]. Since 1990, more powerful and better-performing wind turbine models came into operation. At that time, the first offshore models were installed, setting a new benchmark at around 25 g CO2-eq/kWh. From there on, the
number of wind turbines in the fleet with a carbon footprint lower than 25 g CO2-eq/kWh increased and their
performances kept improving over time for both onshore and offshore turbines. This is explained by more favorable
ratios of materials and energy requirements to electricity production. As manufacturers improve the design of components with time, so does the overall material efficiency of wind turbines. The carbon footprint of wind power is
expected to decrease in the future mainly due to the installation of larger wind turbine models with higher nominal power outputs [55] and higher productivity, as later discussed in this section.
20 Figure 6 also shows an important dispersion of the environmental performance of wind turbines, although this dispersion is reduced as technologies are developed. In 1980, the performance of onshore wind turbines in the category
of climate change varied in a wide range between 20 and 90 g CO2-eq/kWh, whereas in 2010 most of them have a
climate change value ranging between 10 and 30 g CO2-eq/kWh. The range of such indicator for offshore wind turbines
is slightly lower, varying from 7 to 20 g CO2-eq/kWh. The performance of the fleet is determined as the ratio between
the sum of environmental impacts of operating wind turbines at a given year and the sum of their electricity production
(Equation 6). This fleet performance is generally pulled toward the lower limit of such dispersion and is significantly lower than the median value, as illustrated by Figure 7. This is because the carbon footprint values of the fleet are
average values weighted by the production (and so, indirectly by the nominal power) of the wind turbines. Hence, the
most powerful wind turbines, which often correspond to the well-performing ones, contribute more to the fleet performance. For instance, with a similar load factor, a 3 MW wind turbine will weight 30 times more in the fleet performance than a 100 kW turbine.
Figure 6 Distribution of climate change impact performances of the Danish wind turbines fleet over time
Figure 7 shows the evolution of the performance of the fleet of wind turbines according to several aspects: carbon
footprint per kWh of electricity produced and supplied to the grid, carbon footprint per kW of nominal power output and the evolution of the load factor. There is a clear and continuous reduction of the average climate change impact
associated to the increasing electricity produced by the fleet. It starts at 40 g CO2-eq/kWh in the early development
stage of the wind energy sector, to decrease to 15 g CO2-eq/kWh in 2016 with an expected 13 g CO2-eq/kWh by 2030
(Figure 7.A). This gain in performance, marginally decreasing with time, originates from the impact reduction per kW of power capacity installed in a first time (Figure 7.B) and an increasing average load factor of the fleet (Figure 7.C).
After a significant decrease from 1.4 t CO2-eq/kW to 0.76 t CO2-eq/kW, the impact per kW of the fleet slightly
increases over the period 2000-2030. It is due to an increasing share of offshore turbines, which present a higher impact
per kW, as well as the deployment of wind turbines with larger rotors (see Table 3). This slight increase of impact per kW is more than compensated by a significant increase of the load factor of the fleet (see Supporting Information).
Figure 7: Environmental performance indicators of the Danish fleet from 1980 to 2030 Such results are coherent with the findings described in [26] and particularly highlight:
- The economies of scale. More powerful wind turbines tend to have lower impacts per kWh generated. It is first explained by the general fact that larger wind turbines produce more electricity due to an improved load factor.
In some cases, this is also helped by a reduction of the impacts per kW of nominal power output over time due to a lower weight per kW of capacity installed. Table 3 displays the onshore fleet of wind turbines operating in
2016 grouped into three different power categories. Impacts per kW of nominal power output decrease between < 1 MW and 1-3 MW onshore turbines but increase between 1-3 MW and > 3 MW onshore wind
turbines. On the other hand, when normalized by the rotor swept area, the impacts decrease. This is because more powerful wind turbines generically have ‗oversized‘ rotor with a higher m²-of-swept-area-per-kW ratio.
22 Large rotors imply heavier tower and foundations that explain the higher impacts per kW of nominal power output. However, larger rotors also ensure higher productivities (see Table 3 and Supporting Information) that
finally lead to better environmental performance when the life cycle impacts are normalized by the electricity production.
- The benefits of offshore installations. Despite slightly higher life cycle environmental impacts due to higher requirements for the foundation and grid connection, offshore wind turbines present better performances per
kWh of electricity generated due to a better wind availability, as illustrated in Table 3. These results are in line with the meta-analysis performed by Kadiyala et al. [56]. Their analysis of 29 LCA studies on wind power
generation, representing altogether 74 different wind turbine models, showed a higher performance on average
for offshore units. Table 3 also compares the climate change impacts of the fleet with values given by the datasets available in the ecoinvent 3.3 cut-off database generated by [22]. The inventory for each ecoinvent dataset is approximated from a single wind turbine model: an 800 kW wind turbine for the ―Onshore < 1 MW‖
dataset, a 2 MW wind turbine for the ―Onshore 1-3 MW‖ and the ―Offshore 1-3 MW‖ datasets, and a 4.5 MW wind turbine for the ―Onshore > 3 MW‖ dataset. Burger et al. [22] also adjust their load factor to reflect the
average Danish load factor. By doing so, the same load factor is associated to all the power categories. Yet, this study precisely shows that more powerful wind turbine models tend to have higher load factors than
smaller ones. For example, the load factor for offshore installations is significantly underestimated compared
to the measured load factor in 2016. The load factor is a determinant parameter for assessing the GHG performance of wind power [14]. Measured load factors show a higher disparity between onshore and offshore turbines than the differences considered by Burger et al. [22] or Bonou et al. [57]. For 1 MW and 1-3 MW
onshore wind turbines, impacts per kW of nominal power output are significantly lower based to the inventories provided by Burger et al. [22] than in the present study. This is not the case for the Onshore > 3
MW category, for which the ecoinvent inventory is based on a wind turbine equipped with a 125 meter high concrete tower. Yet, it is stressed in the dataset description that ―Data are very rough since no real data were
available for the tower‖. The lower impact per kW observed for the low-capacity wind turbines is mainly
explained by the lifetime of fixed parts (i.e., foundations and tower) that is assumed to be 40 years for Onshore
< 1 MW and Onshore 1-3 MW inventory datasets. In the case of the Offshore 1-3 MW category, another factor that led Burger et al. [22] to underestimate impacts is the rather low height of the wind turbine: 64 meters for a
2 MW model, whereas most of the 2 MW offshore wind turbines installed in Denmark are 80 meters high,
according to the Danish wind turbines registry [58], sea depth can also significantly influence impacts related to foundations (see Supporting Information). Indeed, Reimers et al [59] showed that, as the sea depth increases,
it becomes increasingly difficult to compensate for the impacts associated to foundations by a greater wind availability.
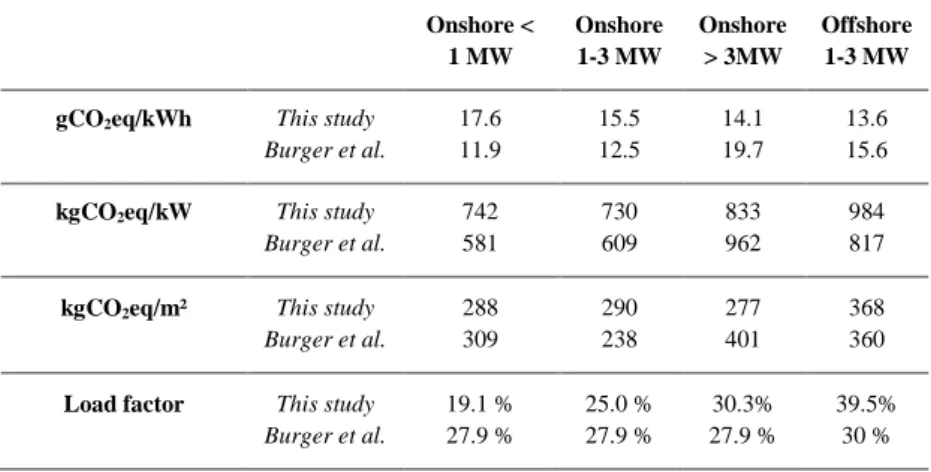
Table 3: Environmental performance indicators of the Danish fleet in 2016 per power category
Onshore < 1 MW Onshore 1-3 MW Onshore > 3MW Offshore 1-3 MW gCO2eq/kWh This study
Burger et al. 17.6 11.9 15.5 12.5 14.1 19.7 13.6 15.6
kgCO2eq/kW This study
Burger et al. 742 581 730 609 833 962 984 817
kgCO2eq/m² This study
Burger et al. 288 309 290 238 277 401 368 360
Load factor This study Burger et al. 19.1 % 27.9 % 25.0 % 27.9 % 30.3% 27.9 % 39.5% 30 %
- After 1995, oil, gas and wind power plants were increasingly implemented in Denmark to reduce the share of
power originating from coal. Then, investments in wind power dramatically increased and further reduced the country‘s dependency on coal and gas (see Supporting Information). Additionally, the share of secondary steel
on the steel market has increased from 10% in 1980 to 30% in 2016 (see Supporting Information) reducing its embodied energy footprint (as electric furnaces used to produce secondary steel require less energy than blast
furnaces required to produce primary steel). The effect of these two aspects can be estimated in the following manner. The performance of the fleet in 2016 is compared with a hypothetical scenario where the fleet is fully
manufactured in 1980. This hypothetical scenario entails that the electricity used to manufacture the wind turbines is entirely generated from coal as well as a recycled content in steel is as low as 10%. This scenario
comparison shows that the carbon footprint is reduced by 3.5% using the adjusted Danish electricity and by 4.5% using steel with a higher content of secondary steel. This indicates that adjusting background inventory
processes to time-sensitive aspects already explains around 8% of the observed reduction in terms of global warming impacts per kWh produced of the fleet between 1980 and 2016.
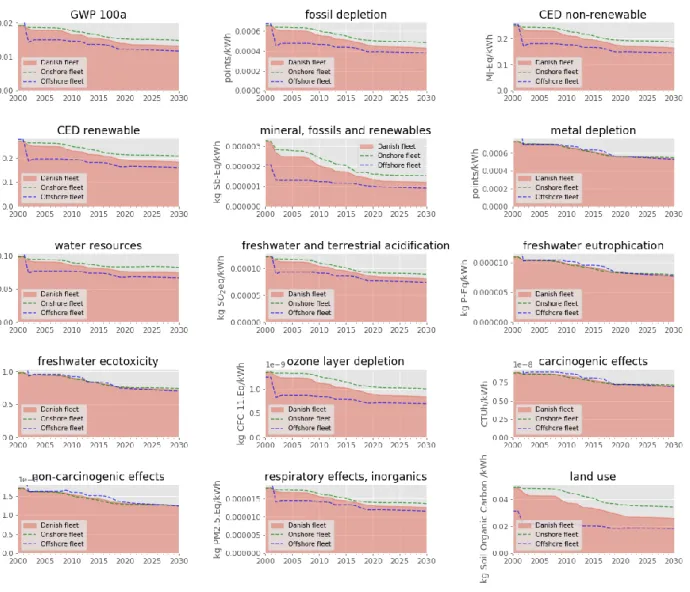
3.3 Temporal evolution of the impact categories for the Danish wind turbine fleet
Figure 8 shows the evolution of environmental performance of the entire Danish fleet, as well as the onshore and offshore fleet considered separately, for the considered environmental impact categories. According to Figure 8, the evolution pattern of the fleet performance regarding the climate change impact category discussed in the previous
section is also valid for the other impact categories. Even though the evolution patterns are similar, the impacts of different categories are not necessarily proportional. For instance, in impact categories related to metal depletion,
24 offshore wind turbines compared to their onshore counterparts are lower than for other impact categories. These impact categories are particularly affected by the material and operation requirements for underwater foundations (steel-made
monopile) and the electrical infrastructure to transport the generated power to the continental grid (copped-based cables).
Additional visual illustrations are available in the Supporting Information to analyze the correlation between impact categories per wind turbine, the correlation between environmental impacts and sea depth for offshore wind turbines
and the correlation between environmental impacts and performances with rated power, hub height or rotor dimension.
Figure 8: Environmental performance of wind turbines in Denmark for various impact categories between 2000 and
2030
4 Visualization tool
The results obtained following this 5-step approach for the specific case study of the Danish wind turbine fleet can be
delivering environmental impacts results on the 11,282 installed and projected wind turbines that compose the Danish fleet from 1980 to 2030. The graphical user interface (GUI) has been developed in JavaScript on top of a Leaflet
interactive map [60], while the website framework and requests are handled by the Python-based web framework Django [61]. As presented in Figure 9, the GUI allows the user to set several filtering parameters to visualize the fleet,
such as the year of the fleet, the onshore and/or offshore type of installation as well as an interval of nominal power output. For example, when selecting the year 2016 for offshore installations above 6 MW, only wind turbines that
satisfy these filtering parameters are displayed. The users can navigate on the map and select a specific wind turbine. Consequently, a popup appears to present commercial, technical, environmental and energy-related details associated
with the wind turbine considered, such as:
General information: manufacturer name, model name, power output, length of service time (with start and end year) as well as various external links to the manufacturer page and contact details.
Environmental information: general description of the phases of the wind turbine life cycle (as shown in Figure 10), energy payback ratio (which compares the amount of renewable energy produced to the amount of fossil
energy required throughout the life cycle), climate change per kWh of electricity produced, depletion of mineral resources per kWh of electricity produced as well as the primary energy demand split between
renewable and non-renewable origins. For each of these impacts, a comparison to the rest of the fleet according to the filtering parameters selected is given with descriptive statistics such as the mean, the median and the
minimum-maximum interval.
Electricity production information: the historical and projected annual electricity production during the service time of the wind turbine is displayed.
Other parameters: this includes information on the power output, load factor and lifetime of the wind turbine in relation to the rest of the fleet. In the case of the lifetime, it is either measured for wind turbines that have already been decommissioned and randomly generated from an observed distribution for wind turbines that are
still in operation or projected to be installed. It is indicated in the tool whether the provided service time of a given wind turbine is measured or randomly generated.
26 Figure 9 LCA_WIND_DK life cycle description of a selected offshore wind turbine located at the Anholt offshore wind
farm.
LCA_WIND_DK should see the implementation of additional functions in the future. For example, based on the
integration of the approaches developed in this work and in [26], it would be possible to simulate the installation of additional wind turbines of a given power output on the map and retrieve instantly the expected environmental
performance in regard to several impact categories, as well as the expected electricity production. At a macro-scale, this tool can provide the necessary statistics to support renewable energy-oriented policy scenarios. This may also help
answer questions at the regional planning level, where new onshore wind turbines can only be installed by dismantling less-performing wind turbines. Additionally, it can provide prospects regarding environmental and economic
profitability for private capitals that wish to invest in a wind farm project or simply find the interest of residents that live nearby an existing installation. Finally, such a platform could be used by wind turbine manufacturers to assess and
present the environmental performance of the range of wind turbine products they propose. It could equally be used by independent wind project developers to assess and present the environmental performance of several scenarios.
a) Selection of the year of the fleet to visualize b) Selection of a specific wind turbine and visualization of the associated technical details
c) Visualization of environmental performance and comparison with the fleet that same year, the fleet over time and similar wind turbine models
d) Visualization of observed or/and estimated electricity production
Figure 10 Screen captures of LCA_WIND_DK graphical user interface
5 Conclusion
When renewable energy represents a significant share of the electricity in several countries, monitoring the
environmental performance of a national fleet of RES based on few generic models is not satisfactory: simplifying assumptions regarding the manufacture and use of RES can lead to inaccurate results at the fleet level.
LCA_WIND_DK is therefore developed as an effort to monitor the progress of wind power in Denmark from 1980 to 2030 based on the bottom-up environmental impacts characterization of its constituents. The tool relies on a generic
method that produces individualized LCI for RES, here applied to wind turbines, which allows considering the variability in inventories that arise with differences in technology, time and geography. Through the setting of a few
filtering parameters, the user can access to fleet-wise but also installation-specific environmental and energy indicators and statistics. The tool also gives information on the observed and/or projected electricity production, life time, load
factor, etc.
The fleet of wind turbines in Denmark is composed of 11 kW models in the beginning of 1980 and developed to reach
state-of-the-art prototypes above 11 MW in 2016. Findings highlight the long-term reduction of global warming impacts per kWh of electricity generated: from 40 g CO2-eq/kWh at the very beginning, to 15 g CO2-eq/kWh in 2016
28 and expected to go down to 13 g CO2-eq/kWh in 2030. The environmental performances for all the other impact
categories are strongly correlated with global warming impacts. These improvements are driven by economies of scale
coming from more powerful wind turbine models and the development of offshore wind turbines that are exposed to better wind resources. Improvements are, to a lesser extent (about 8%), explained by the increasing share of renewable
energy supply in the electricity mix and a higher content of secondary steel in the manufacture of wind turbines over the years.
This bottom-up approach that consists in obtaining precise LCI of RES to calculate the environmental performance of a whole fleet, associated with a visualization web platform to easily monitor progress over time, is a step to better inform
decision making. Indeed, this seems a relevant approach to produce useful data whether it is used for private investments or for national energy policy purpose. One can imagine in the future that such tool features prospective LCA functions where explorative scenarios (―what would happen if?‖) could be performed. They could help to identify
key parameters inducing most uncertainties in the future and thus, be used as a strategic planning tool. For instance,
more powerful wind turbines with larger rotors present a lower environmental impact per kWh produced due to a higher load factor. Due to this higher load factor, these turbines would also reduce issues related to the intermittency of the
production, which must be considered. Thus, their development may be preferred to the refurbishment of small wind turbines with lower load factors, provided it is socially accepted and economically viable.
The methodology used to produce geographically, spatially and technologically-parameterized LCI to model the entire wind energy sector of the country is generic and scalable. This approach is relevant to other countries installing wind
power capacities whose stakeholders (e.g. regulators, policy makers, investors and developers) wish to disseminate the environmental results to a large audience such as the public and local community. Indeed this would also support
decision making in mapping and developing renewable energies targets, as well as national and local energy policy.
This approach can be applied to develop new online-platforms such as LCA_WIND_Other for other geographical areas of varying sizes (e.g., regions, countries…) and even down to wind farm projects. Similarly, the approach can also be
applied to other types of RES, such as photovoltaic power, estimating solar resource using solar irradiation data instead
of wind speed data, or hydropower. Finally, the next steps in this work are to reach out to others working in the field to share opportunities to collaborate on applying this approach in other regions/countries.
6 Acknowledgements
The authors wish to thank the anonymous reviewers for contributing to the betterment of this study. In addition, the
authors express their gratitude to the Danish Ministry of Energy for providing detailed and comprehensive data on the national wind turbine fleet. Finally, the authors wish to thank Christopher Mutel and the developers behind Brightway,
the LCA framework used in this study as well as Stefan Pfenninger and Iain Staffell for the development of the open-access platform Renewables.ninja. This study has been partly funded by Denmark Innovation Fund, the Research,
Quality and Technical center of Cementir Holding S.p.A.
7 References
[1] P. Secretariat, REN21.2017. Renewables 2017 Global Status Report, (2017). http://www.ren21.net/wp-content/uploads/2017/06/17-8399_GSR_2017_Full_Report_0621_Opt.pdf.
[2] REN21, REN21. Renewables 2018-global status report, Paris, REN21 Secretariate; 2018, Paris, 2018. doi:978-3-9818911-3-3.
[3] IEA, CO2 emissions from fuel combustion, in: IEA, 2014. doi:10.1787/factbook-2014-table159-en.
[4] A.S. Petrilli, J.G. Garcia, D.G. Bellan, M. de Toledo Petrilli, R.J.-G. Filho, M.F. Schoedl, D.C. Maia Viola, Ewing‘S Sarcoma: Epidemiology and Prognosis for Patients Treated At the Pediatric Oncology Institute,
Iop-Graacc-Unifesp, Abu Dhabi, 2015. doi:10.1016/s2255-4971(15)30126-9.
[5] L. Alagappan, R. Orans, C.K. Woo, What drives renewable energy development?, Energy Policy. 39 (2011) 5099–5104. doi:10.1016/J.ENPOL.2011.06.003.
[6] D.Y.C. Leung, Y. Yang, Wind energy development and its environmental impact: A review, Renew. Sustain. Energy Rev. 16 (2012) 1031–1039. doi:10.1016/J.RSER.2011.09.024.
[7] S. Wang, S. Wang, Impacts of wind energy on environment: A review, Renew. Sustain. Energy Rev. 49 (2015) 437–443. doi:10.1016/J.RSER.2015.04.137.
[8] R. Turconi, A. Boldrin, T. Astrup, Life cycle assessment (LCA) of electricity generation technologies: Overview, comparability and limitations, Renew. Sustain. Energy Rev. 28 (2013) 555–565.
doi:10.1016/j.rser.2013.08.013.
[9] H. Mälkki, K. Alanne, An overview of life cycle assessment (LCA) and research-based teaching in renewable
and sustainable energy education, Renew. Sustain. Energy Rev. 69 (2017) 218–231. doi:10.1016/J.RSER.2016.11.176.
30 renewable energies: Review and results harmonization, Renew. Sustain. Energy Rev. 42 (2015) 1113–1122. doi:10.1016/j.rser.2014.10.082.
[11] M. Carbajales-Dale, Life Cycle Assessment: Meta-analysis of Cumulative Energy Demand for Wind Energy Technologies, 2017. doi:10.1016/B978-0-12-809451-8.00021-7.
[12] I. Kubiszewski, C.J. Cleveland, P.K. Endres, Meta-analysis of net energy return for wind power systems, Renew. Energy. 35 (2010) 218–225. doi:10.1016/j.renene.2009.01.012.
[13] S. Jay, Strategic environmental assessment for energy production, Energy Policy. 38 (2010) 3489–3497. doi:10.1016/J.ENPOL.2010.02.022.
[14] H.L. Raadal, L. Gagnon, I.S. Modahl, O.J. Hanssen, Life cycle greenhouse gas (GHG) emissions from the
generation of wind and hydro power, Renew. Sustain. Energy Rev. 15 (2011) 3417–3422. doi:10.1016/J.RSER.2011.05.001.
[15] L. Price, A. Kendall, Wind Power as a Case Study, J Ind Ecol. 16 (2012) S22–S27.
doi:10.1111/j.1530-9290.2011.00458.x.
[16] D. Nugent, B.K. Sovacool, Assessing the lifecycle greenhouse gas emissions from solar PV and wind energy: A
critical meta-survey, Energy Policy. 65 (2014) 229–244. doi:10.1016/J.ENPOL.2013.10.048.
[17] R. Brizmohun, T. Ramjeawon, A. Azapagic, Life cycle assessment of electricity generation in Mauritius, J
Clean Prod. 106 (2015) 565–575. doi:10.1016/j.jclepro.2014.11.033.
[18] R. Garcia, P. Marques, F. Freire, Life-cycle assessment of electricity in Portugal, Appl Energ. 134 (2014) 563– 572. doi:10.1016/j.apenergy.2014.08.067.
[19] E. Santoyo-Castelazo, H. Gujba, A. Azapagic, Life cycle assessment of electricity generation in Mexico,
Energy. 36 (2011) 1488–1499. doi:10.1016/j.energy.2011.01.018.
[20] R. Turconi, D. Tonini, C.F.B. Nielsen, C.G. Simonsen, T. Astrup, Environmental impacts of future low-carbon
electricity systems: Detailed life cycle assessment of a Danish case study, Appl. Energy. 132 (2014) 66–73.
doi:10.1016/j.apenergy.2014.06.078.
[21] G. Wernet, C. Bauer, B. Steubing, J. Reinhard, E. Moreno-Ruiz, B. Weidema, The ecoinvent database version 3 (part I): overview and methodology., Int. J. Life Cycle Assess. 21 (2016) 1218–1230.
![Table 1 List of future offshore wind farms in Denmark. Source: [41]](https://thumb-eu.123doks.com/thumbv2/123doknet/11641462.307226/12.892.149.744.421.686/table-list-future-offshore-wind-farms-denmark-source.webp)
![Figure 7: Environmental performance indicators of the Danish fleet from 1980 to 2030 Such results are coherent with the findings described in [26] and particularly highlight:](https://thumb-eu.123doks.com/thumbv2/123doknet/11641462.307226/22.892.85.805.393.800/environmental-performance-indicators-coherent-findings-described-particularly-highlight.webp)