HAL Id: hal-01063476
https://hal.archives-ouvertes.fr/hal-01063476
Submitted on 12 Sep 2014HAL is a multi-disciplinary open access archive for the deposit and dissemination of sci-entific research documents, whether they are pub-lished or not. The documents may come from teaching and research institutions in France or abroad, or from public or private research centers.
L’archive ouverte pluridisciplinaire HAL, est destinée au dépôt et à la diffusion de documents scientifiques de niveau recherche, publiés ou non, émanant des établissements d’enseignement et de recherche français ou étrangers, des laboratoires publics ou privés.
Copper and aluminium tribocorrosion in acid medium :
Electrochemical Impedance Spectroscopy investigations
Jean Geringer, Bernard Normand, Catherine Alemany-Dumont, Robert
Diemiaszonek
To cite this version:
Jean Geringer, Bernard Normand, Catherine Alemany-Dumont, Robert Diemiaszonek. Copper and aluminium tribocorrosion in acid medium : Electrochemical Impedance Spectroscopy investigations. Eurocorr 2009, 2009, Nice, France. p.14. �hal-01063476�
COPPER AND ALUMINIUM TRIBOCORROSION IN ACID MEDIUM:
ELECTROCHEMICAL IMPEDANCE SPECTROSCOPY
INVESTIGATIONS.
Jean GERINGER
1, Bernard NORMAND
2, Catherine ALEMANY-DUMONT
3,
Robert DIEMIASZONEK
41
ENSM-SE, CIS, 158 cours Fauriel 42023 Saint-Etienne, France, geringer@emse.fr 2
INSA Lyon, RI2S, 21 avenue Jean Capelle 69621 Villeurbanne France, Bernard.normand@insa-lyon.fr
3
INSA Lyon, RI2S, 21 avenue Jean Capelle 69621 Villeurbanne France, catherine.alemany-dumont@insa-lyon.fr
4
INSA Lyon, RI2S, 21 avenue Jean Capelle 69621 Villeurbanne France, robert.diemiaszonek@insa-lyon.fr
Abstract:
This study is focused on the interests and limits of EIS, Electrochemical Impedance Spectroscopy, to establish the electrochemical behaviour of a tribosystem during friction between copper and aluminium in acid solution. EIS measurements are performed before, during and after friction for understanding electrochemical surface reaction evolution. For each material, calculated capacitance in high frequencies range allows getting further information about the double layer state. The Potential of Zero Charge (PZC) is defined such as the potential value associated to the lowest capacitance. PZC was calculated for copper sample precisely and it was associated to a potential range for aluminium. PZC value of each material is discussed as a key parameter of sliding contact in considered media. Finally, impedance diagrams illustrate a parallel contribution of aluminium and copper during static contact. During wear corrosion tests, EIS results, at high frequencies, are related to the evolution of adsorbed water molecules.
1. Introduction
Tribocorrosion is defined as friction under corrosive conditions. This phenomenon occurs during rolling and/or sliding contacts in a corrosive medium [1], such as nuclear [2], and medical implants industry [3].
Since the 70s, understanding the impact of the mechanical solicitation on the electrochemical properties of materials is a key point [4]. Usual electrochemical techniques are practised: open circuit potential evolution according to normal load or frequency [5]; potential applying and current monitoring for quantitative analysis of wear [6]; current and potential monitoring under open circuit conditions, i.e. electrochemical noise measurements [7]. Electrochemical Impedance Spectroscopy (noted EIS) was also described by several authors as an interesting tool to investigate mechanisms occurring on both materials surfaces in contact [8-10]. Because interfaces reactivity can be modelled by an association of basic electrical components [11], EIS experiments were performed.
A modelling tribosystem based on aluminium-copper was studied because it highlights galvanic coupling due to the high electrochemical potential gap in the considered electrolyte [12]. Copper effect on the aluminium corrosion resistance is widely studied in material science [13,14]. Recently galvanic corrosion between Cu and Al was particularly studied by local Electrochemical Impedance Spectroscopy (LEIS) [15]. In contrast, the electrochemical behaviour of Cu/Al contact under sliding was less considered in acidic solution using EIS technique. Firstly, the electrochemical behaviour of copper and aluminium was studied separately to characterize the Potential of Zero Charge (noted PZC). Attraction or repulsion phenomena play a significant role in the friction evolution between two surfaces in contact [6]. Finally, the electrochemical behaviour (EIS) of static and dynamic contacts, i.e. under sliding conditions was characterized. In addition, SEM and EDS results provided elements for describing wear mechanisms.
2. Experimental
2.1 Materials
The chemical composition of aluminium alloy (A 2017 [16]) was measured by spark emission spectroscopy on a SEO JY 50 E equipment, Table 1.
Elements Cu Mn Mg Si Fe Zn Cr Pb Ti Sn Ni Al
Weight % 4.00 0.71 0.66 0.66 0.44 0.17 < 0.05 < 0.05 0.03 < 0.02 < 0.01 bal
Table 1: A 2017 chemical composition (weight %).
Copper composition was measured by electrolysis and confirmed by atomic absorption spectroscopy. Minor metallic elements such as Cr, Ni, Ag, Fe are lower than 0.002 % weight percents, copper purity was established to 99.80 %.
2.2 Tribocorrosion device
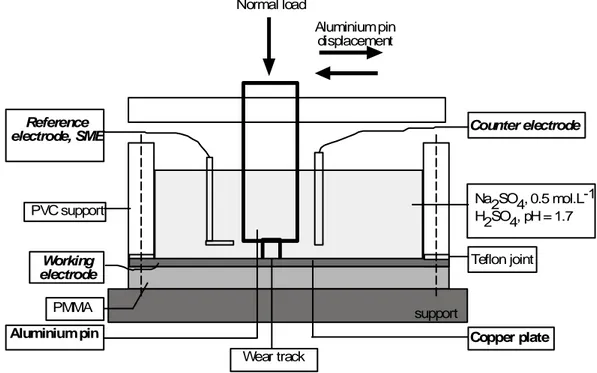
A wear corrosion apparatus was developed in MATEIS laboratory, for pure sliding, from reciprocating displacement, in a pin/disc configuration, Figure1. Displacement amplitude of ± 8.6 mm at a frequency of 1 Hz was applied. Electrical contacts between device and samples were eliminated by insulation of samples constitutive of the tribosystem.
Figure 1: Wear corrosion experimental device.
A copper surface roughness of Ra = 0.10 +/- 0.05 µm was obtained after a polishing procedure including grit paper 180 to 1200 and finally a paraffin solution and alumina particles to obtain mirror surface.
Normal load equal to 6.7 N was applied by dint of calibrated rod fixing the contact diameter and the temperature was maintained to 23 ± 2 °C. The worn copper and aluminium alloy surfaces were observed and analyzed with a Scanning Electron Microscope JMS 840 JEOL coupled with an EDS probe.
2.3 Electrochemical measurement
Acid solution has been chosen to maintain active state of material constituting the tribosystem [12]. The electrolyte was an aerated solution of 0.5 mol.L-1 Na2SO4, pH of 1.7
obtained by a H2SO4 buffered solution.
Electrochemical measurements, including corrosion potential (Ecorr) as a function of
time and electrochemical impedance measurements, were carried out.
A mercury/mercurous sulphate (Hg/Hg2SO4) reference electrode saturated in K2SO4
solution was the potential reference; the ionic junction was located very close to the working electrode surface, almost 2 mm. The potential against the standard hydrogen electrode (SHE) was of 0.615 V at 25 °C.
Concerning the EIS spectra, the frequencies range was from 10 kHz to 15 mHz. Data were validated by Kramers-Koenig (K-K) transformation [17,18]. Copper and aluminium were studied separately as a working electrode before to establish EIS diagram of the tribosystem. Exposed area of Cu and Al were 19.63 cm² and 0.20 cm² respectively. A graphite counter electrode was a cylinder, diameter of 5 mm and length of 70 mm. Impedance experiments were carried out using a Princeton Applied Research (Parstat 2263) equipment. Impedance monitoring was performed at free corrosion potential and applied potential.
Teflon joint Na2SO4, 0.5 mol.L-1 H2SO4, pH = 1.7 Counter electrode Working electrode Reference electrode, SME PVC support PMMA support Aluminium pin Aluminium pin displacement Normal load Wear track Copper plate
3. Results and discussion
3.1 Data analysis
At the pH of 1.7, dissolution of aluminium and copper occurs. Figure 2 illustrates experimental EIS response recorded for aluminium alloys immersed during 5 hours in acid solution. Spectrum exhibits two time constants. At high frequencies, the depressed capacitive loop was related to the fast electron transfer. At low frequencies, the inductive loop was characteristic of relaxation processes related to nucleation and/or growth of corrosion products of Al. Outliers recorded at very low frequencies can be attributed to the non stability of the aluminium corrosion processes. Their elimination was improved from Dygas et al approach [19].
Figure 2: Aluminium EIS diagrams, Nyquist plot representation, raw impedance data, after
immersion in Na2SO4 (0.5 mol.L-1) buffered to pH 1.7 by H2SO4 for 3 hours.
The Nyquist plots obtained for the copper is represented in Figure 3. The diagram is characterized by one depressed capacitive loop with centre below the abscissa. Because the pH test electrolyte induces an active dissolution of copper reaction mechanism proposed for the larger electrode can be interpreted as the charge transfer resistance (Rct) in parallel with
the double layer capacity (Cdl).
Figure 3: Nyquist plots of Cu after immersion in Na2SO4 (0.5 mol.L-1) buffered to pH 1.7 by H2SO4 for 5 hours. 0 200 400 600 800 1000 1200 1400 0 200 400 600 800 1000 15.85 mHz 0,1 Hz -I m / o h m .c m 2 Re / ohm.cm2
Aluminum (Al) raw data
10 Hz 1 Hz 0 5000 10000 15000 20000 25000 0 5000 10000 15000 0.1 Hz 1 Hz Re / ohm.cm2 -I m / o h m .c m 2 10 Hz 15.85 mHz
Their contributions to the total impedance can be well interpreted by analyzing the system using an equivalent circuit. In this work, elements of the equivalent circuit were selected following these two conditions:
• numerous electrical models are available for aluminium alloy sample in different media including numerous associations of resistance, capacitance and inductance [20-23]. Because this study is dedicated to compare the electrochemical behaviour of each sample separately with one of both samples coupled electrically during friction, the same equivalent electrical circuit was selected both for each material and for tribosystem. • Reciprocating test leads to an alternative surface activation which could be induced EIS results from mistakes (no stationarity), especially for low frequencies in accordance with corrosion phenomena.
The selected electrical circuit was a series association Re(CPEhf, Rhf). Re is the
electrolyte resistance. Rhf is a resistance that is associated in parallel with the CPEhf. CPEhf is
the Constant Phase Element (hf: high frequencies) in order to include the divergence from pure capacitive behaviour. CPEhf value is described as
1 ( ) CPE n hf Z Q j
ω
= (eq. 1)Qhf, admittance at ω = 1 rad.s-1(S.sn.cm-2), j2 = −1 the imaginary unit, ω the angular frequency
(rad s−1) and n is the CPE exponent (0 ≤ n ≤ 1)
Then electrical values, resistances and capacitances, calculated from CPE, have been compared between aluminium alloy and copper sample, between the static contact (Al-Cu) and sliding contact (Al/Cu). These results allow calculating the capacitance according to the Brug’s relation [24]: 1-( ) n n hf hf hf hf C =Q Q R (eq. 2)
3.2 Impedance diagrams for aluminium alloy and copper, separately
3.2.1 Aluminium alloy sample
During experiments, the free corrosion potential changes were lower than 10 mV, which is consistent with the small amplitude of the perturbation voltage for EIS measurements.
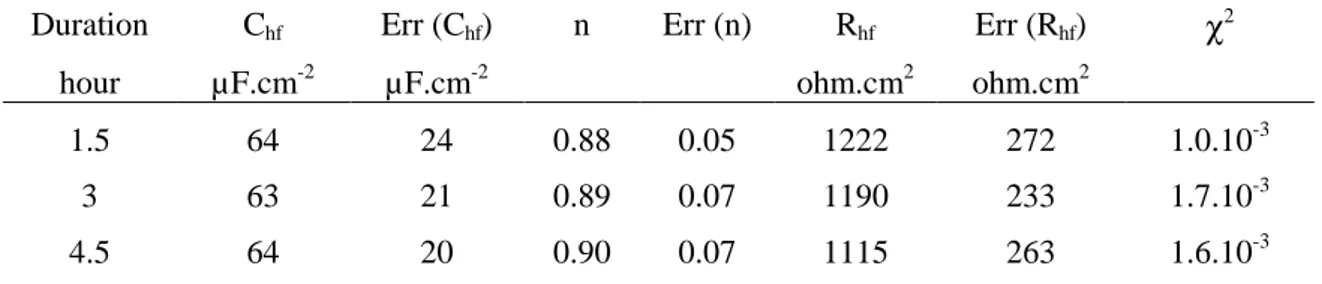
The values of the electrical components have been calculated for the same Al sample and different time of storage in the acid solution, Table 2.
Duration Chf Err (Chf) n Err (n) Rhf Err (Rhf) χ2
hour µF.cm-2 µF.cm-2 ohm.cm2 ohm.cm2
1.5 64 24 0.88 0.05 1222 272 1.0.10-3
3 63 21 0.89 0.07 1190 233 1.7.10-3
4.5 64 20 0.90 0.07 1115 263 1.6.10-3
Table 2 exhibits no drastic evolution of the capacitance, resistance and n. Thus, it is worth noting that, after 1.5 hour, the electrical behaviour of Al does not suffer changes.
3.2.2 Copper sample
During experiments, the free corrosion potential of the copper sample did not suffer significant changes as the aluminium sample. The capacitance increases according to the exposure time, in acid solution and Rhf decreases as summarized in Table 3,
The CPE exponent values show that the double layer is less and less homogeneous, probably due to the modification of roughness during dissolution.
Duration Chf Err (Chf) n Err (n) Rhf Err (Rhf) χχχχ2
hour µF.cm-2 µF.cm-2 kohm.cm2 kohm.cm2
3 5.0 0.2 0.85 0.04 31.22 0.82 4.2.10-3
5 6.0 0.2 0.84 0.12 19.59 0.50 3.8.10-3
6 8.7 0.4 0.81 0.01 12.08 0.30 4.6.10-3
6.5 9.8 0.4 0.81 0.01 10.79 0.26 4.2.10-3
7.5 10.2 0.4 0.81 0.01 10.20 0.25 4.0.10-3
Table 3: EIS results calculated from Cu sample immersed in acid solution.
3.2.3 Potential at the Potential of Zero Charge (PZC) for aluminium alloy and copper
Sliding phenomena depend partially of electrostatic state of material surface in contact. The potential of zero charge (PZC) plays a significant role in electrostatic processes. Different PZC values for copper immersed in different solution are proposed in literature i.e. Bockris and Reddy’s report [26]. EIS offers a good tool to determine the PZC of material in solution which is considered like the minimum of the capacitance according to the applied potential [25].
Series of impedance spectra for copper and aluminium electrodes were recorded on sulphuric acid solution in a large range of potentials (between -0.47 and + 0.37 V vs Ecorr).
Double layer capacitances evaluated from electrical equivalent circuit described previously, are plotted against applied potential in Figure 4; capacitances at Open Circuit Potential (OCP) are also reported.
Figure 4: Capacitances evolution for Al and Cu electrodes, according to applied potential;
Mercurous Sulphate Electrode (MSE); Open Circuit Potential (OCP).
Figure 4 shows that Chf is approximately constant for Al sample. The Chf, calculated at
open circuit potential (free corrosion potential), is four times higher than the one calculated at applied potential. The aluminium alloy surface, during applied potential tests, is modified by the previous cathodic polarization, although the potential value is the same. The curve does not exhibit a minimum of capacitance.
Concerning the copper sample, Chf is lowest and close to the free corrosion potential. The minimum potential is more negative than the free corrosion potential. At high frequencies, a capacitive loop from the relaxation of the double-layer capacitance is observed.
The faradic process is slow compared to double layer relaxation and specific ions are not adsorbed. However, this last hypothesis could be questioned. Indeed, the capacitance of copper, at open circuit potential (OCP) potential, is not rigorously constant and the salts on the surface could participate to this evolution [25]. The same behaviour could occur at applied potential, close to free corrosion potential. However, the evolution of the copper Chf shows a
minimum that is relevant with the PZC value.
In this work, the PZC value of copper sample is estimated to be -0.47 ± 0.04 V vs. MSE which is in accordance with Ma et al. [25] who found a value of -0.56 V in sulphuric acid, 0.5 mol.L-1. However, experimental protocol does not allow calculating the PZC of aluminium alloy. Thus, one might suggest that the PZC of aluminium alloy is closed to the OCP around -1.13 V vs MSE [26]. Further investigations have to be carried out with only one sample per value of applied potential. Figure 5 shows evolution of OCP of the contact between Al and Cu before, during and after sliding.
-1 .6
-1 .4
-1 .2
-1 .0
-0 .8
-0 .6
-0 .4
-0 .2
0
5 0
1 0 0
1 5 0
2 0 0
2 5 0
3 0 0
M in im u m
C u , O C P
C
h f/
µ
F
.c
m
-2P o te n tia l / V v s . M S E
C u
A l
C u , (O C P )
A l, (O C P )
A l, O C P
C u
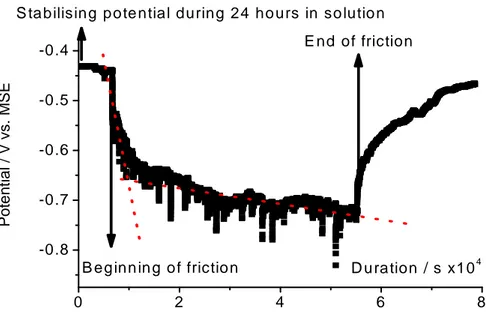
Figure 5: Free corrosion potential during friction between Al pin and Cu plate; solution:
Na2SO4 0.5 mol.L-1 and sulphuric acid, pH = 1.7.
The OCP value is between one of PZC of Cu and Al. Thus, positive charges on Al alloy surface are opposite to negative charges on copper surface. If the electrostatic attractions are considered, the friction coefficient would be higher in these conditions. EIS measurements contribute to reveal the synergistic effect in tribocorrosion. However, no friction coefficient can be measured with this equipment. Additional works will be carried out in order to correlate friction coefficient evolution at different applied potentials.
3.3 Impedance diagrams for static and dynamic contacts
3.3.1 Static contact between Cu and Al
Table 4 shows the capacitance, the resistance and χ2, defined as
(
)
22
, ,
log i experimental log i calculated
i
Z Z
χ =
∑
− , for the static contact between copper and aluminium alloy, at high frequencies. The capacitance can be considered constant as well as the resistance.Duration Chf Err (Chf) Rhf Err (Rhf) χ2 hour µF.cm-2 µF.cm-2 ohm.cm2 ohm.cm2
23 80.3 6.2 1015 27 2.0.10-3
25 80.1 5.6 980 25 1.7.10-3
27 84.3 1.0 1029 28 1.6.10-3
29 84.4 1.0 1032 30 1.7.10-3
31 104.9 8.6 889 21 2.2.10-3
Table 4: EIS results calculated from static contact between Cu and Al.
0 2 4 6 8 -0.8 -0.7 -0.6 -0.5 -0.4
S ta bilising po te ntial during 24 ho urs in so lutio n E nd of friction P o te n ti a l / V v s . M S E D u ra tion / s x104 B eg inn in g o f frictio n
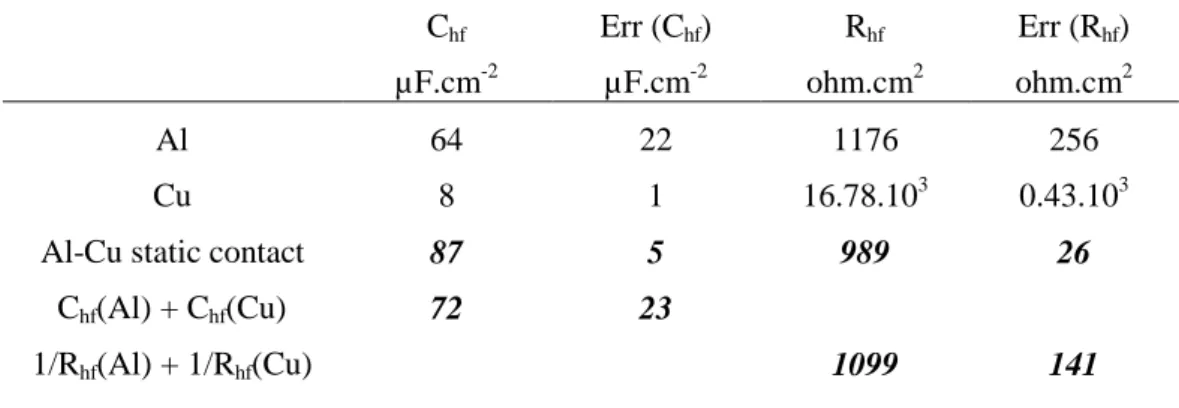
Table 5 presents capacitances and resistances of: - Al electrode before contact; -Cu electrode before contact; - Al/Cu static contact: association of aluminium alloy and copper in static contact. It was decided to consider capacitances by unit of area and resistances as Ω.cm2 (Aluminium alloy surface: 0.28 cm2; copper surface: 19.63 cm2).
Chf Err (Chf) Rhf Err (Rhf) µF.cm-2 µF.cm-2 ohm.cm2 ohm.cm2
Al 64 22 1176 256
Cu 8 1 16.78.103 0.43.103
Al-Cu static contact 87 5 989 26
Chf(Al) + Chf(Cu) 72 23
1/Rhf(Al) + 1/Rhf(Cu) 1099 141
Table 5: EIS results from: -Al electrode; Cu electrode; Al-Cu static contact;
The capacitance calculated for the static contact was closed to the addition of the capacitances of aluminium alloy and copper. Moreover, the resistance, Rhf, is close to
(1/Rhf(Al)) + (1/Rhf(Cu)). As a result, the aluminium alloy and copper contact is consistent
with a parallel association. Cathodic reaction (oxygen reduction) occurs on copper surface and anodic dissolution on aluminium alloy. In this case, galvanic coupling between both metals can be considered.
3.3.2 Dynamic contact made of copper and aluminium alloy and post contact
During friction, numerous wear phenomena occur: transfer, oxidation, mechanical degradation as ploughing, wear, etc. The worn area represents 4 % of the entire Cu area. The particular behaviour of worn track area could not be isolated. As the entire copper surface was selected, worn track can be neglected for resistance and capacitance consideration. This work could be considered as a first approach.
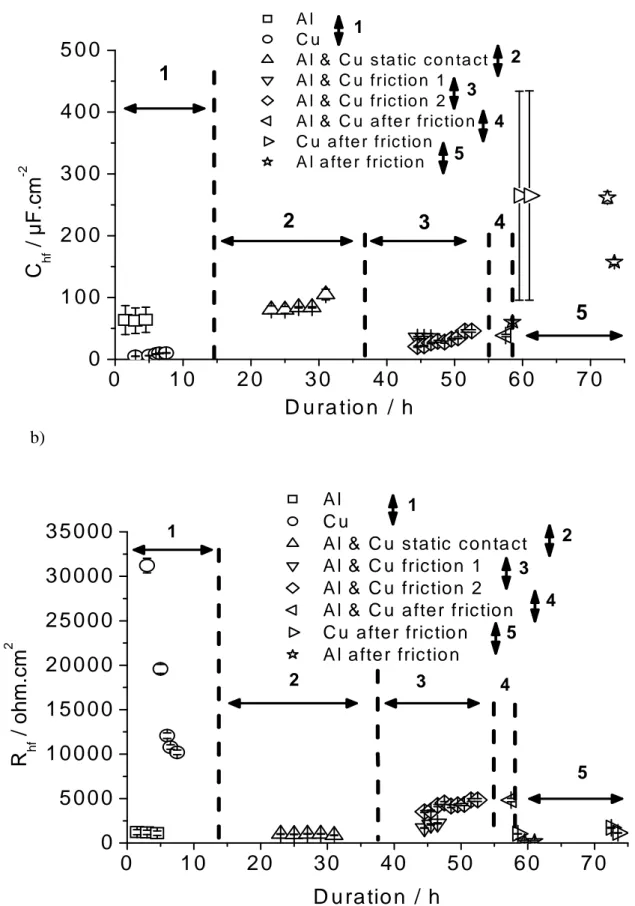
Figure 6 shows capacitances (Chf), resistances (Rhf) for different times of experiments. Five
steps have been highlighted on this figure: EIS results for (1) copper and aluminium alloy, separately; (2) static contact; (3) dynamic contact (friction test); (4) static contact after friction test; (5) after fourth step, with separated samples. Each step is discussed below.
Figure 6: a) Capacitances (Chf), b) resistances (Rhf) during 5 steps: (1)-before contact, Al and Cu separately, (2)-static contact between Al and Cu, (3)-dynamic contact between Al and Cu, (4)-static contact between Al and Cu after friction), (5)- after friction and separated samples of Al and Cu. b) a)
0
1 0
2 0
3 0
4 0
5 0
6 0
7 0
0
1 0 0
2 0 0
3 0 0
4 0 0
5 0 0
15
4
3
2
C
h f/
µ
F
.c
m
-2D u ra tio n / h
A l C u A l & C u s ta tic c o n ta c t A l & C u fric tio n 1 A l & C u fric tio n 2 A l & C u a fte r fric tio n C u a fte r fric tio n A l a fte r fric tio n1
2 3 4 50
1 0
2 0
3 0
4 0
5 0
6 0
7 0
0
5 0 0 0
1 0 0 0 0
1 5 0 0 0
2 0 0 0 0
2 5 0 0 0
3 0 0 0 0
3 5 0 0 0
R
h f/
o
h
m
.c
m
2D u ra tio n / h
A l C u A l & C u s ta tic c o n ta c t A l & C u fric tio n 1 A l & C u fric tio n 2 A l & C u a fte r fric tio n C u a fte r fric tio n A l a fte r fric tio n1 2 3 4 5 1 2 3 4 5
3.3.2.1 Steps 1, 2, and 3
Steps 1 and 2 have been described and discussed in previous paragraphs. The step 3 indicates that the Chf value decreases when friction starts; Rhf are almost constant. At the
beginning of friction, convection occurs due to aluminium alloy pin displacement in the solution. Active surface is then disturbed. During static contact, aluminium deals with cathodic protection in the contact. During dynamic contact, Cu surface becomes active. After 3 hours of friction, values correspond to the one of Cu, a weak difference is attributed to the modified wear track area.
During sliding, Chf, Rhf, increase according to time, this electrochemical behaviour is
reproducible. It could be associated to a charges modification of the surface. hf C S = 0 e εε (eq. 3)
Where S is the double layer area, e is the thickness, ε and ε0 are the permittivity of the
adsorbed water and of vacuum respectively. Rhf.S = ρ.e (eq. 4)
Where ρ is resistivity that varies to the inverse of the ions concentration. If Chf .R Shf 0
S =
ρεε
(eq. 5) increases either ρ or either ε increases. Chf and Rhf evolutions are consistent with an increasing of the resistivity and a decreasing of ions concentration in the double layer. Due to the Chf, the evolution of adsorbed water permittivity could revealthese evolutions. Indeed, according to the orientation of the adsorbed water molecules, the relative permittivity should change [28]. Because data involve an ε increasing, the wear mechanisms could modify charges on materials surface.
3.3.2.2 Step 4
The step 4 concerns the Al-Cu contact after friction. Near 5 hours after friction, values of the electrical components are close to step 3. One can conclude that the electrochemical behaviour goes like during friction. Dissolution continues being active, because of the galvanic coupling between copper and aluminium alloy.
3.3.2.3 Step 5
Step 5 shows that resistances of both samples are weaker than the one during friction. Thus capacitances increase and values exhibit discrepancy. The dissolution rate increases, it is higher than the one before friction. After friction step, surfaces have been worn and damaged. The local attack sites emerge. Consequently, the macroscopic measured capacitance is not accurate.
3.4 Wear track analyses
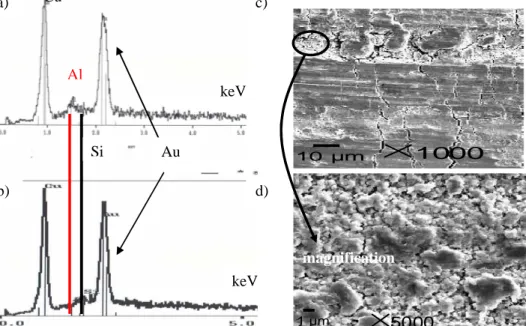
Figure 7 shows qualitative EDX analyses and SEM observations of wear track on copper plate. The gold presence results of sample preparation. Figure 7 a. presents EDX
outside the track. A transferred aluminium alloy is then observed on the copper sample. Over mechanical aspects of wear, previous PZC discussions could partially explained adhesion phenomena of aluminium on copper. Figures 7 c and d. exhibit cracks and debris characteristic of fatigue friction.
Figures 8 shows qualitative EDX analyses and SEM observations of wear track on aluminium pin. These pictures highlight numerous copper deposits on aluminium alloy confirmed by EDX analyses shown in Figure 8 a.
Figure 8 b corresponds to this particle. Figures 8 c. and d. show respectively ploughing by copper on aluminium and copper particles, small debris, agglomerated on the aluminium alloy sample. Some debris were probably transferred on aluminium alloy sample by adhesion phenomenon.
Figure 7: a) EDX spectrum of Cu sample on the centre of the worn zone, after step 5; b) EDX
spectrum of Cu sample on the outer worn zone; c) SEM image on the centre of the worn zone, Cu sample; d) SEM observation.
Figure 8: a) EDX spectrum of Cu transferred on aluminium electrode, after step 5; b) EDX
spectrum of aluminium sample on a worn zone; c) SEM image of Al sample, deposit of Cu on Al; d) SEM image of Al sample on the centre of the worn zone.
10 µm 1000 1 µm 5000 Si Al a) c) b) d) Au keV keV magnification Cu 100 µm 200 1 µm 10000 c) d) a) b)
4. Conclusion
EIS contribution in tribocorrosion was investigated from a specific friction device on a Cu/Al tribosystem. Assumptions are discussed in terms of frequencies range determination to insure steady state system and to obtain pertinent interface simulation by electrical equivalent circuit representative. Once get around these keys limitations of EIS for tribocorrosion, this technique could be considered like an efficient tool to explain the surface charges contribution on the tribocorrosion wear phenomena. Analyses were carried out for different configurations, i.e. before, during and after sliding.
Due to EIS analyses of each sample separately, an estimated value of PZC was carried out. According to the free corrosion potential during friction, PZC values predict that negative charges are on the copper surface and positive ones on the aluminium surface. Mechanisms of adhesion and materials transfer could occur. This expectation was confirmed by SEM and EDX analyses.
The impedance diagrams of the static contact exhibit that copper and aluminium in contact can be followed by EIS as a parallel association of impedance. Results are consistent with delocalized reactions. About the dynamic contact, EIS informs about an ions concentration decreasing in the double layer. Moreover, the relative permittivity of adsorbed water molecules could account for increasing the time constant.
Additional works are in progress in order to improve numerous results. The surface ratios on the copper plate between worn surface and the exposed surface will change to understand and to follow, by EIS, the location of the cathodic reaction and the reaction rate. Next tests will be carried out with a friction device that will allow monitoring tangential load and dissipated energy to relate the mechanical parameters to the electrochemistry. Moreover, EIS could be an interesting method to complete previous investigations, such as fretting-corrosion tests.
Acknowledgements
The authors are grateful to Robert Di-Folco for his significant technical contribution and Nicolas Mary for his helpful discussions.
References
1. D. Landolt, S. Mischler, M. Stemp, Electrochimica Acta, 46 (2001) 3913. 2.D. Kaczorowski, J-P. Vernot, Tribology International, 39 (2006) 1286.
3.Y. Yan, A. Neville, D. Dowson, S. Williams, Tribology International, 39 (2006) 1509. 4.D. Landolt, Journal of Physics D: applied physics, 39 (2006) 3121.
5.J-P. Celis, P. Ponthiaux, F. Wenger, Wear, 261 (2006) 939. 6. J. Geringer, B. Forest, P. Combrade, Wear, 261 (2006) 971.
7. A. Berradja, D. Déforge, R-P. Nogueira, P. Ponthiaux, F. Wenger, J-P. Celis, Journal of Physics D: applied physics, 39 (2006) 3184.
8. P. Ponthiaux, F. Wenger, J. Galland, G. Lederer, N. Celati, Matériaux et techniques, (1997) 43-46. 9. P. Ponthiaux, F. Wenger, D. Drees, J-P. Celis, Wear, 256 (2004) 459.
10. D. Macdonald, Electrochemica Acta, 51 (2006) 1376.
11. C. Gabrielli, Technical report 004/83, Solartron Analytical, 1998.
12. M. Pourbaix. Atlas d'équilibres électrochimiques, Ed. Gauthier-Villars, Paris (1963).
13. M. Keddam, C. Kuntz, H. Takenouti, D. Schuster, D. Zuili, Electrochimica Acta, 42 (1997) 87. 14. V. Guillaumin, G. Mankowski, Corrosion Science, 41 (1998) 421.
15. J-B. Jorcin, N. Pébère, C. Blanc, Proceedings of the 19e forum sur les impédances électrochimiques, Ed. Université Pierre et Marie Curie, Paris (2006) p.77.
16. C. Vargel, Corrosion de l’aluminium, Ed. Dunod, Paris (1999) p. 15.
17. D. Macdonald, E. Sikora, G. Engelhardt, Electrochimica Acta, 43 (1998) 87. 18. M. Orazem, Journal of Electroanalytical Chemistry, 572 (2004) 317.
19. J.R. Dygas, M.W Breiter, Electrochimica Acta, 44 (1999) 4163.
20. F. Snogan, C. Blanc, G. Mankowski, N. Pébère, Surface and Coatings Technology, 154 (2002) 94. 21. A.K. Nigam, R. Balasubramaniam, S. Bhargava, R.G. Baligidad, Corrosion Science, 48 (2006) 1666.
22. J.H.W. De Wit, H.J.W. Lenderink, Electrochimica Acta, 41 (1996) 1111.
23. D.A. Harrington, P. van den Driessche, Journal of Electroanalytical Chemistry, 501 (2001) 222. 24. G.J. Brug, A.L.G. van Eeden, M. Sluyters-Rehbach, J.H Sluyters, Journal of Electroanalytical Chemistry, 176 (1984) 275.
25. H. Ma, S. Chen, B. Yin, S. Zhao, X. Liu, Corrosion Science, 45 (2003) 867.
26. J.O.M. Bockris, A.K.N. Reddy, Modern Electrochemistry, Ed. Plenum Press, New-York (1970) p.708.
27. R.J. Brigham, Corrosion Science, 29, (1989) 995.
28. D. Landolt, Corrosion et chimie de surfaces des métaux, Ed. Presses Polytechniques et Universitaires Romandes, Lausanne (1997) p.90.