HAL Id: hal-01102550
https://hal.archives-ouvertes.fr/hal-01102550
Submitted on 13 Jan 2015
HAL is a multi-disciplinary open access
archive for the deposit and dissemination of
sci-entific research documents, whether they are
pub-lished or not. The documents may come from
teaching and research institutions in France or
abroad, or from public or private research centers.
L’archive ouverte pluridisciplinaire HAL, est
destinée au dépôt et à la diffusion de documents
scientifiques de niveau recherche, publiés ou non,
émanant des établissements d’enseignement et de
recherche français ou étrangers, des laboratoires
publics ou privés.
On-going progress of SoftLAB benchmark in 2014
Raphaël Gillard, Benoît Le Lepvrier, Renaud Loison, Guy Vandenbosch
To cite this version:
Raphaël Gillard, Benoît Le Lepvrier, Renaud Loison, Guy Vandenbosch.
On-going progress of
SoftLAB benchmark in 2014. EUCAP2 014, Apr 2014, Den Haag, Netherlands. pp.1169 - 1171,
�10.1109/EuCAP.2014.6901980�. �hal-01102550�
On-Going Progress of SoftLAB Benchmark in 2014
Raphaël Gillard
1, Benoît Le Lepvrier
1, Renaud Loison, Guy A. E. Vandenbosch
21 European University of Britanny: Institute of Electronics and Telecommunications of Rennes, INSA, UMR CNRS 6164, 35708
Rennes, France, {raphaël.gillard, benoit.le-lepvrier, renaud.loison}@insa-rennes.fr
2 ESAT TELEMIC, KU Leuven, Leuven, Belgium, [email protected]
Abstract— This paper presents the last edition of SoftLAB,
the EurAAP antenna software benchmark. In the 2013-2014 run, two antenna test-cases have been proposed for simulation. The first one is an updated version of the triple-frequency GSM antenna previously studied in 2009 and 2013. The second one is a large-bandwidth monopole antenna in a complex surrounding environment. The specific goal is to reach results of extreme high quality.
Index Terms— antenna simulation, benchmark, software
tools.
I.
Introduction
SoftLAB (Software OnLine Antenna Benchmark) is now well-known in the community of people using or developing modelling tools for antenna simulation in Europe. Started by the Antenna Software Initiative within the Antenna Center of Excellence (ACE) in 2005, it is a benchmark for antenna software that is now run yearly, in strong connection with the EuCAP conference [1-2].
Each year, a new set of challenging antenna test-cases is proposed for simulation in fall. The process is totally open and people are invited to participate in and to produce simulation results before the end of the year using their own simulation tools (either in-house or commercial). These results are then published and discussed at the EuCAP conference, in spring of the next year.
A detailed description of the past benchmark test-cases and associated results can be found in www.antennesavce.org, the EurAAP (European Association on Antennas and Propagation) portal. It gathers more than 110 simulations from more than 30 contributors and covers 5 successive benchmark runs addressing a total of 21 test-cases. This really constitutes a wealthy data-base for anyone interested in antenna simulation, whatever the numerical method or the antenna technology. All the results are fully available and can be downloaded from the portal by anyone registered in the EurAAP association.
In 2013, the specific EuCAP session in Gothenburg was a real success with a huge participation and fruitful exchanges. In 2014, the results of run#6 will be presented at the EuCAP 2014 conference in The Hague, The Netherlands. This benchmark run consists of two different structures that are briefly presented in the next section.
II.
The 2013-2014 run
A. First structureThe first antenna topology to be benchmarked is shown in Fig. 1. It is a GSM antenna with triple-frequency band operation and CPW feeding. This antenna has been benchmarked twice already. The results of the first run (in 2008-2009) are discussed in detail in [3] and for clarity depicted in Fig. 2. These results were obtained by users who used the commercial software in the best possible way. Most possible causes of discrepancy were already addressed and ruled out. Non-addressed issues were:
- modeling of the feed: idealized feeds were used, characteristic for each software, i.e. the real connector used in the measurements was not taken into account, and the idealized feeds may differ considerably between software tools,
- non-optimal use of software tool: although errors were (most probably) ruled out by the checking of the input by the software vendors, a non-optimal use of a tool cannot be ruled out, and this may have implications on the accuracy.
-
-
Fig. 1. First antenna topology, inspired by the World GSM Antenna. The specific goal of the second benchmark in 2012-2013 was to rule out as much as possible these remaining issues. To that goal, the software vendors were invited to do the benchmarking themselves, since they are the masters of their own tool and can be expected to use it in the most optimal way. Also, since in [3] it was pointed out that the actual feeding structure, thus including the connector, may be crucial in explaining the major discrepancies, it was expected that the vendors would concentrate on this. The results were presented
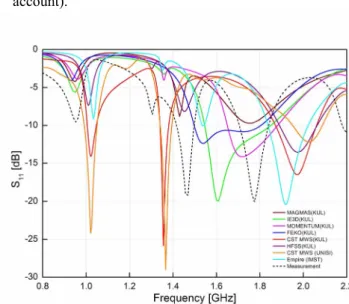
at EuCAP 2013 in Gothenburg [4], [5] and the “best” results are given in Fig. 3. It is clearly seen that the agreement between the simulations is much better than in the 2008-2009 run, especially at the lower frequencies. The differences are mainly in the high frequency region. There the results are still a bit “scattered”. There are serious discrepancies above the -10 dB threshold. From the presentations made by the six software vendors involved, it was clear that there were mainly three reasons for this discrepancy:
- the fact that complete and detailed information concerning the connector configuration, including its internal structure, was missing (most vendors made a “best guess” for the connector topology),
- the fact that not always the exact position of this connector was taken into account, and
- when comparing with measurements, the cable feeding the connector (only FEKO really took the cable into account).
Fig. 2.Benchmark results in 2009: seven software tools and a measurement. The differences are remarkable and occur over the whole band analyzed. A detailed discussion is given in [3].
Fig. 3. Benchmark results in 2013: six software vendors, 9 tools, and 17 simulations. These results were presented during the Convened Session of the EuRAAP Working Group on Software [4], [5].
These three issues are all concerned with the feeding topology. After a thorough discussion between the EuRAAP Software WG and the software vendors, it was decided to make sure that in the 2013-1014 run all tools would simulate exactly the same configuration. Five points were addressed in this discussion:
a) The positioning of the feed was measured very accurately and added to the description files. This was just overlooked last year.
b) The material used is FR4. However, it is known that there is a spread on the parameters of this material. KU Leuven has provided the best estimates (based on measurements) for these values to the software vendors. The goal is that they all use these values.
c) Concerning the connector, although the drawing provided by the manufacturer gives all dimensions that could really affect the electromagnetic behavior and the measurements, KU Leuven has provided a "reference" connector set-up, based on the drawing so that all vendors can use the same structure here.
d) KU Leuven has generated a "sat" file fully describing the complete structure. Such a sat file is a standardized file widely used in the area of 3D CAD tools. This means that for the vendors whose software can handle this type of file, it is guaranteed that the structure put into the software is exactly the same.
e) Concerning the measurements, KU Leuven will draft a measurement protocol, which is submitted for approval to the vendors, and which can then be further upgraded if necessary. It has to be emphasized that it is sincerely hoped that this benchmark would deliver results with an intrinsic quality never reached before. The results will be presented and discussed thoroughly at the yearly EuRAAP Software WG Convened or Special Session at EuCAP 2014 in The Hague, The Netherlands.
B. Second structure
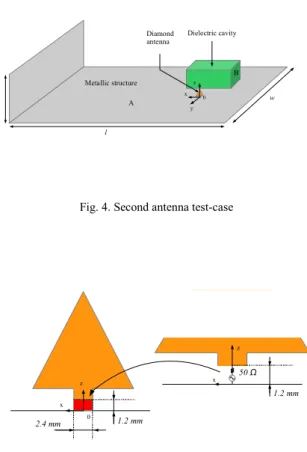
The second studied structure consists of a surrounded wide-band antenna mounted on a large metallic structure. Although canonical, this structure combines several classical issues that may be encountered when analyzing surrounded wide-band antennas mounted on large platforms (such as satellites or vehicles). Because it involves small details (for instance the transmitting antenna) and very large elements (the metallic platform), it is intended to assess software tools with advanced capabilities such as multiple-region or multiresolution features. A global view of the structure is given in Fig. 4. More precisely, the test-case combines a planar diamond antenna operating from 4 to 9.5 GHz (detailed view in Fig. 5), a block of dielectric material very close to the radiating element and a large ground plane (l=1728 mm; w=1584 mm) with a vertical metallic plate (h=1008mm).
Fig. 4. Second antenna test-case
Fig. 5. Detailed view of the planar diamond antenna and the feed model proposed for simulation.
The benchmark will consist in calculating the far fields (both co- and cross-polar) produced by the whole structure in two cut-planes and for the complete bandwidth.
Several candidate methods have already been identified that are particularly well suited to address this type of problems. Among them, the hybridization of Iterative Physical Optics (IPO) with Dual-Grid Finite-Difference Time-Domain method (DG-FDTD) has been specially developed by IETR [6] to deal with surrounded antennas working over a large frequency
bandwith. To do so, it combines a time-domain multilevel analysis of both the antenna and its closest environment (DG-FDTD simulation) with a high-frequency approach (IPO) for the more remote elements. Because most of the calculations are carried out in the time domain, it is particularly efficient for large bandwidth characterization. One important output of the benchmark will thus be to see if such dedicated tools outperform more general-purpose solvers (such as full-3D commercial tools) regarding simulation time. Also, the comparison of the agreement between methods will be essential to see if the used
assumptions in hybridized approaches (or any other simplified approaches) are detrimental to the overall accuracy.
More generally, the compared performance of time-domain and frequency-domain methods, the advantage resulting from any advanced treatment or the effect of available degrees of freedom in the simulation process will be addressed.
At the moment this paper is submitted, a few results have already been uploaded that will be presented and discussed in the EuCAP2014 conference.
References
[1] G. A. E. Vandenbosch, R. Gillard, M. Sabbadini, “The Antenna Software Initiative (ASI): ACE results and EuRAAP continuation », IEEE AP magazine, June 2009, Vol. 51, Issue 3, pp. 85-92.
[2] R. Gillard, G. A. E. Vandenbosch, “New results from the SoftLAB benchmark of antenna software”, EuCAP2010, 12-16 April 2010, Barcelone.
[3] A. Vasylchenko, Y. Schols, W. De Raedt, and G. A. E. Vandenbosch, “Quality assessment of computational techniques and software tools for planar antenna analysis”, IEEE Antennas Propagat. Magazine, Vol, 51, No. 1, pp. 23-38, Feb. 2009.
[4] G. A. E. Vandenbosch, R. Gillard, et al., “Benchmarking of optimally used commercial software tools for challenging antenna topologies, part 1 & 2: The 2012 – 2013 run”, EuCAP 2013, 8-12 April 2013, Gothenburg, Sweden.
[5] G. A. E. Vandenbosch and R. Gillard, “Benchmarking of optimally used commercial software tools for challenging antenna topologies”, IEEE Antennas Propagat. Magazine, Vol. 55, No. 3, pp. 281-292, June 2013 [6] B. Le Lepvrier, R. Loison, R. Gillard, L. Patier, P. Potier, and P.
Pouliguen, “Hybridization of the dual-grid fdtd with the physical optics to analyze antennas mounted on large and complex platforms,” in Int. Conf. Electromagnetics and Adavanced Applications (ICEAA), Torino, Italy, Sep. 2013. x z 0 1.2 mm 2.4 mm 50 Ω z x 1.2 mm Diamond antenna Dielectric cavity Metallic structure w l h h A B z y 0 x