HAL Id: hal-00857867
https://hal-brgm.archives-ouvertes.fr/hal-00857867
Submitted on 4 Sep 2013HAL is a multi-disciplinary open access archive for the deposit and dissemination of sci-entific research documents, whether they are pub-lished or not. The documents may come from teaching and research institutions in France or abroad, or from public or private research centers.
L’archive ouverte pluridisciplinaire HAL, est destinée au dépôt et à la diffusion de documents scientifiques de niveau recherche, publiés ou non, émanant des établissements d’enseignement et de recherche français ou étrangers, des laboratoires publics ou privés.
Reference database for seismic ground-motion in Europe
(RESORCE)
Sinan Akkar, M. Abdullah Sandikkaya, M. Senyurt, A. Azari Sisi, B. Ö. Ay,
Paola Traversa, John Douglas, Fabrice Cotton, Lucia Luzi, Bruno Hernandez,
et al.
To cite this version:
Sinan Akkar, M. Abdullah Sandikkaya, M. Senyurt, A. Azari Sisi, B. Ö. Ay, et al.. Reference database for seismic ground-motion in Europe (RESORCE). Bulletin of Earthquake Engineering, Springer Ver-lag, 2014, 12 (1), pp.311-339. �10.1007/s10518-013-9506-8�. �hal-00857867�
Reference Database for Seismic Ground-Motion in Europe (RESORCE)
S. Akkar1, M.A. Sandıkkaya1,2, M. Şenyurt3, A.Azari Sisi1, B.Ö. Ay1,4, P. Traversa5 , J. Douglas6, F. Cotton2, L. Luzi7, B. Hernandez8 and S. Godey9
1
Earthquake Engineering Research Center, Middle East Technical University, 06800 Ankara, Turkey
2
Institut des Sciences de la Terre (ISTerre), Universite de Grenoble, 38041 Grenoble, France
3
Kalyon Insaat, Beykoz Istanbul, Turkey
4
European Centre for Training and Research in Earthquake Engineering, 27100 Pavia, Italy
5
EDF-DIN-CEIDRE TEGG-Service Geologie Geotecnique, 13090 Aix en Provence, France 6
Bureau de Recherches Géologiques et Minères, BRGM 7
Istituto Nazionale di Geofisica e Vulcanologia, INGV 8
CEA, DAM, DIF, Laboratoire de detection et de Géophysique, F-91297 Arpajon, France 9
Euro-Mediterranean Seismological Centre, c/o CEADAM, DIF, F-91297 Arpajon, France
Corresponding Author: Sinan Akkar
T: +90-312-210-7475 E: [email protected]
Middle East Technical University Department of Civil Engineering
Earthquake Engineering Research Center K6 Building
Abstract
This paper presents the overall procedure followed in order to assemble the most recent pan-European strong-motion databank: Reference Database for Seismic Ground-Motion in Europe (RESORCE). RESORCE is one of the by-products of the SIGMA (SeIsmic Ground Motion Assessment; projet-sigma.com) project. RESORCE is intended to be a single integrated accelerometric databank for broader Europe to understand the regional differences in seismic hazard for improving risk studies in Europe and surrounding countries. RESORCE principally updates and extends the previous pan-European strong-motion databank (Ambraseys et al., 2004a) from recently compiled Greek, Italian, Swiss and Turkish accelerometric archives. The updates also include the earthquake-specific literature studies published in recent years. The current content of RESORCE includes 5882 multi-component and uniformly processed accelerograms from 1814 events and 1540 strong-motion stations. The moment magnitude range covered by RESORCE is 2.8 ≤ Mw ≤ 7.8. The source-to-site distance interval extends to 587 km and distance information is given by the common point- and extended-source distance measures. The paper presents the current features of RESORCE through simple statistics that also quantify the differences in metadata and strong-motion processing with respect to the previous version of the pan-European strong-motion databank.
Evolution of Strong-Motion Data Collection in Europe
The attempts to collect and compile strong-motion data from Europe and the Middle East started in the first half of 1970s in Imperial College, London after the 1967 Debar and 1969 Portugal earthquakes (Ambraseys, 1978). The volunteer work undertaken in the Imperial College was later funded through various grants provided by the governmental agencies of the UK and the European Council (Bommer and Douglas, 2004); the latter being collaborative projects with different European research centers (Ambraseys, 1990; Ambraseys and Bommer, 1990; 1991; Bommer and Ambraseys, 1992). The major focus point in these projects is the consistent evaluation of earthquake and strong-motion station metadata information as well as uniform processing of strong-motion records, leading to a reliable strong-motion databank for earthquake induced hazard and risk studies in Europe.
The efforts which grew out from these studies resulted in a CD-ROM of 1068 tri-axial accelerograph data (Ambraseys et al., 2000) that was expanded later by additional recordings from the broader Europe (pan-European) region. The expanded strong-motion databank (2213 accelerograms from 856 earthquakes recorded at 691 strong-motion stations) is disseminated through the Internet Site for European Strong-Motion Data web page (ISESD; http://www.isesd.hi.is; Ambraseys et al., 2004a). The ISESD strong-motion databank considers the special studies on earthquakes (released as either institutional reports or articles published in peer-reviewed journals) as the primary sources for the earthquake and strong-motion station metadata. In the absence of such earthquake-specific studies, the earthquake metadata (e.g., epicentral location, focal depth as well as magnitude estimations other than local magnitude, ML) was mostly taken from the Bulletin of the International Seismological Center (www.isc.ac.uk). The local magnitude information was gathered from local and national networks. The preferred source of information for earthquake location is the local or national networks whenever they were assessed as more reliable with respect to the
international seismic agencies. The network owners are rated as the most reliable information source for strong-motion station metadata information (e.g., site conditions, station coordinates, shelter type) when strong-motion sites lack specific monograms. The soil conditions of strong-motion stations are classified using the Boore et al. (1993) scheme that is based on certain VS30 intervals (VS30 < 180 m/s; 180 m/s ≤ VS30 < 360 m/s; 360 m/s ≤ VS30 < 750 m/s; VS30 ≥ 750 m/s) where VS30 is the average shear-wave velocity in the top 30m soil profile. However, the unavailable shear-wave velocity profiles in almost all strong-motion stations constituted the major difficulty in the classification of strong-motion sites for different soil conditions. Almost all the processed strong-motion records in ISESD were band-pass filtered using an elliptical filter with constant high-pass and low-pass cut-off frequencies (0.25 Hz and 25 Hz, respectively). A subset of ISESD was re-processed using the bi-directional (acausal) Butterworth filter with cut-off frequencies adjusted individually for each accelerogram. The individual filter cut-off frequencies were determined from the signal-to-noise ratio of each accelerogram. This subset, later, was released as another CD-ROM (ESMD; European Strong-Motion Data; Ambraseys et al., 2004b) after the inauguration of the ISESD web site.
The efforts for the compilation of ISESD strong-motion databank were followed by important national and international strong-motion and seismic hazard projects in Europe and the surrounding regions. Of these projects the ITalian ACcelerometric Archive Project (ITACA; http://itaca.mi.ingv.it; Luzi et al., 2008) and the Turkish National Strong-Motion Project (T-NSMP; http://kyh.deprem.gov.tr/; Akkar et al., 2010) are national initiatives to compile, process and archive local (national) accelerometric data using state-of-art techniques. The ITACA project compiled a total of 2182 accelerograms from 1004 events (Luzi et al., 2008) whereas T-NSMP studied 4607 strong-motion records from 2996 earthquakes recorded at 209 stations (Akkar et al., 2010). Both ITACA and T-NSMP also
improved the site characterization of strong-motion stations either by reassessing the existing shear-wave velocity profiles and soil column lithology information or by utilizing invasive or noninvasive site exploration techniques to compute the unknown VS30 and other relevant site parameters (e.g., Sandıkkaya et al., 2010). A similar effort has also been started in Greece after 2000 to archive the uniformly processed Greek records of strong-motion stations operated by ITSAK (http://www.itsak.gr/; Theodulidis et al., 2004) under the HEAD (HEllenic Accelerogram Database) databank. The Seismic Hazard HARmonization in Europe project (SHARE; www.share.eu.org), a grant provided by the European Council, compiled a strong-motion databank (Yenier et al., 2010) by collecting shallow crustal accelerometric data from the worldwide strong-motion databanks (ISESD, ESMD, ITACA and T-NSMP are among these databanks) to test the performance of candidate ground-motion prediction equations (GMPEs) for hazard calculations in Europe. This databank (13500 records from 2268 events recoded at 3708 stations) neither updates the metadata information nor develops a uniformly processed accelerometric data archive from the existing events of the selected strong-motion databanks. However, the developers of the SHARE strong-motion databank gave careful consideration for removing duplicated entries in the event, station and waveform information through a hierarchical approach.
Motivation behind the Development of RESORCE
Despite of the significant efforts put forward in the development of ISESD, it suffers from poor strong-motion site characterization and the use of constant filter cut-offs in data processing. The latter feature has been proven to be inappropriate as it may result in misrepresentation of actual ground-motion frequency content of the recorded events (e.g., Akkar and Bommer, 2006). Recent national strong-motion projects (major ones have already been discussed in the previous section) tried to prevent these drawbacks but they evolved as
individual attempts. These projects implemented their own methodologies while assembling the databases that may result in lack of uniformity in metadata compilation and record processing for their integration under a single strong-motion databank. The SHARE project gathered strong-motion data from recent strong-motion databanks but no attempt was made to homogenize the data processing of accelerograms. Improvements of earthquake and station metadata from recent studies in the literature were also out of scope of the SHARE strong-motion databank. The recordings from recent earthquakes of engineering significance in the broader European region (e.g., 2009 L’Aquila Earthquake Mw 6.3; 2011 Van Earthquake Mw 7.1; 2011 Van-Edremit Earthquake Mw 5.6; 2011 Kütahya-Simav Earthquake Mw 5.9; 2010 Elazığ-Kovancılar Earthquake Mw 6.1) are either entirely or mostly disregarded in the SHARE strong-motion databank.
The primary motivation behind RESORCE is to be a single integrated accelerometric databank for broader Europe. The basic ingredient of RESORCE is the pan-European subset of the SHARE strong-motion databank (Yenier et al., 2010). It updates and expands ISESD accelerometric archive using the information gathered from recently carried out strong-motion database projects as well as from other relevant earthquake-specific studies in the literature. The uniform data processing of accelerograms as well as improved magnitude and source-to-site distance distributions constitute other important steps in RESORCE. RESORCE is one of the by-products of the SIGMA (SeIsmic Ground Motion Assessment) project whose main goal is to improve seismic hazard assessment methods in France and neighboring regions, with realistic characterization of aleatory and epistemic uncertainties. RESORCE, which is built over a consistent methodology, is one of the building blocks for achieving these objectives. The development of RESORCE is realized as a collaborative work under SIGMA-Work Package 2 that consists of researchers from Électricité de France (EDF), Institut des Sciences de la Terre (ISTerre), Bureau de Recherches Géologiques et
Minères (BRGM), Euro-Mediterranean Seismological Centre (EMSC), Istituto Nazionale di Geofisica e Vulcanologia (INGV), Laboratoire de detection et de Géophysique (LDG) and Middle East Technical University (METU). The last institute is responsible from the compilation and processing of RESORCE whereas the first five institutions are heavily involved in its scientific revision, coordination and dissemination. RESORCE went through a peer review process during its evolution to provide verified accelerometric data together with reliable metadata that can be used in engineering seismology and earthquake engineering studies. The steps followed in assembling RESORCE are described in the following sections with emphasis on the differences between ISESD and RESORCE so as to display the level of improvements in the current pan-European accelerometric data archive.
Strategy Followed in the Compilation and Strong-Motion Data Processing
The accelerometric data and corresponding metadata information gathered in RESORCE is a collection of recordings from local accelerometric data providers, previously established regional and global databanks, seismological agencies and recent studies in the literature. Table A1 lists the 6 major sources (designated under the “Accelerogram” column) used for collecting the raw accelerograms in RESORCE. These reference sources also contain earthquake and strong-motion station metadata information as presented in Table A1. The existing earthquake and strong-motion station metadata from these sources as well as other reliable references were studied individually while assembling RESORCE. The waveforms of raw accelerometric data were visually inspected one by one in terms of waveform quality and frequency content to implement a well-established data processing technique into the entire strong-motion databank. The steps followed in this entire process are summarized below.
Compilation of Earthquake and Strong-Motion Station Metadata
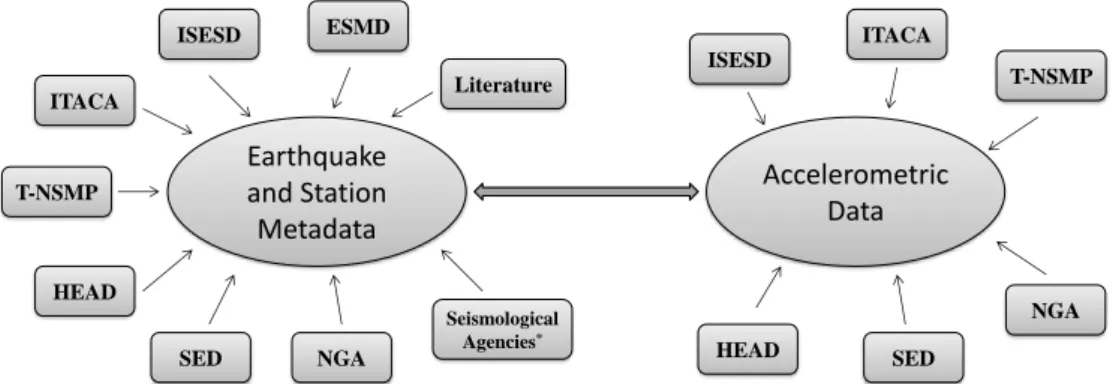
The major structure of RESORCE consists of two principal blocks: (1) earthquake and station metadata information, and (2) accelerometric data. Inherently, these two blocks are related to each other and are assembled from almost the same reference sources (see Table A1). Figure 1 summarizes the overall structure of RESORCE in this perspective. ISESD and its subset ESMD are considered as the primary sources of earthquake (Mw, epicentral coordinate, depth, style-of-faulting, fault geometry etc.) and strong-motion station (soil conditions, station coordinate, different source-to-site distance measures, recoding type – analog vs. digital – etc.) metadata for pre-2004 events. This preference is waived for the earthquakes, which occurred in Italy as well as the Italian strong-motion stations as ITACA contains the most up-to-date station and event information for Italy. Notwithstanding, for Italian events that are reported in magnitudes other than Mw, the Castello et al. (2007) empirical magnitude conversion relationships for Mw were used. This is the only modification made to ITACA within the context of these studies1. The preeminence of ISESD and ESMD for pre-2004 earthquake metadata of Turkish events is not overruled because T-NSMP provides earthquake information from a set of seismological references for each entry in its archive and both ISESD and ESMD are among these seismological sources. Thus, the decision on preferring ISESD and ESMD for pre-2004 Turkish earthquake metadata is in line with the database compilation policy of T-NSMP. The earthquake and station information of additional references, other than ISESD and ESMD, (see Figure 1 as well as Tables A1 and A2) is primarily taken into account for post-2004 earthquake and station metadata in RESORCE. These references are also used for the pre-2004 RESORCE inventory to complete some of the missing earthquake metadata components of individual events or for
1 A similar magnitude conversion process was also implemented in HEAD and T-NSMP during their
compilation (Theodulidis et al., 2004; Akkar et al., 2010). The resulting moment magnitude estimations are taken into account in RESORCE for Greek events, post-2004 Turkish earthquakes as well as for those that occurred before 2004 whenever they are not included in ISESD or ESMD.
including additional earthquakes that are not covered by the ISESD or ESMD archives. The event- and station-based information collected from earthquake-specific literature studies are always ranked as the primary reference for earthquake and station metadata in RESORCE regardless of the corresponding information in the other studied sources. Table A2 presents the peer-reviewed literature studies used from this standpoint. This table also lists the earthquake-specific literature survey compiled and used by ISESD that is inherently considered during the compilation of RESORCE. The reported Mw values of seismic agencies are based on global or regional moment tensor solutions. These Mw values are accepted as they are and no quality assurance is made by tracing back the number of stations used in their computation. In a similar fashion while converting the body-wave magnitude (mb) scale into Mw, the possibility of positive biases in mb for small-to-moderate size events was not considered. Such additional quality assurance checks should be made in the upcoming versions of RESORCE to improve the reliability of information released by this strong-motion databank.
Figure 1. Basic structure of RESORCE and reference sources that build the metadata information as well as the accelerometric data in RESORCE.
An important detail about the RESORCE station metadata is the site characterization of the Turkish and Greek strong-motion stations. The T-NSMP strong-motion inventory is preferred for the site information of the national-network stations of Turkey because it contains the most updated site characterization of these stations. Similarly, the recent site information of 19 Greek stations from the HEAD archive is used to update the site classification of corresponding Greek recordings in RESORCE. The site information of 7 Turkish strong-motion stations other than those pertaining to the national-network is compiled from the literature survey (Rosenblad et al., 2002; see Table A2). Site information of 3 Greek strong-motion stations not covered by HEAD is obtained via personal communication with Prof. Kyriazis Pitilakis and Ms. Evi Riga (AUTH, Greece). The primary parameter used for strong-motion site characterization in RESORCE is VS30 as ITACA,
T-Primary source of pre-2004 earthquake and station metadata except for the events in ITACA and
individual earthquake-specific peer-reviewed
papers from literature that are studied during the compilation of RSMD
Primary source of post-2004 earthquake and station metadata and the pre-2004 events that do not originally exist in ISESD and ESMD
Primary source of all Italian events except for individual studies in the literature
Pre-2004 accelerometric data starting from 1967 except for those of ITACA , T-NSMP and Bommer et al. (2007)
Italian accelerometric data between 1972 and 2009
Turkish accelerometric data between 1976 and 2011
Greek accelerometric data between 1978 and 2006 that do not exist in ISESD
Swiss accelerometric data between 1989 and 2012 that do not exist in ISESD
Accelerometric data that do not exist in any one of the above reference databases
Earthquake and Station Metadata Accelerometric Data ISESD ESMD T-NSMP HEAD SED NGA Seismological Agencies* ITACA ISESD ITACA T-NSMP HEAD SED ISESD ISESD ITACA ITACA T-NSMP T-NSMP NGA SED SED HEAD HEAD Literature ESMD NGA Seismological Agencies*
* United States Geological Survey (USGS), Regional Centroid Moment Tensor (R-CMT), Global Centroid Moment Tensor (G-CMT), International Seismological Center (ISC)
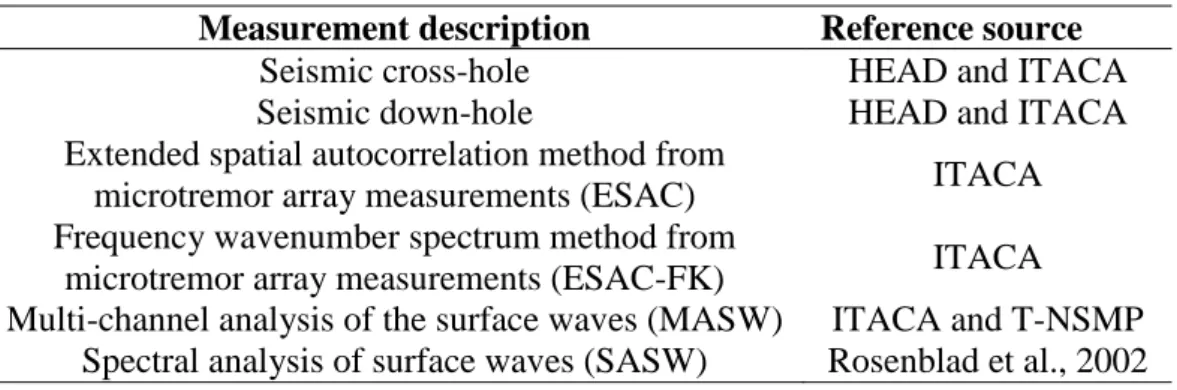
NSMP, HEAD as well as recent literature studies that are accounted for while compiling the RESORCE station metadata use in-situ shear-wave velocity profiles measured by invasive and noninvasive site exploration techniques. Table 1 presents the geophysical site exploration techniques whose shear-wave velocity measurements are evaluated by the above reference sources for site characterization of strong-motion stations in their archive.
Table 1 In-situ site measurements of the RESORCE strong-motion recording stations Measurement description Reference source
Seismic cross-hole HEAD and ITACA
Seismic down-hole HEAD and ITACA
Extended spatial autocorrelation method from
microtremor array measurements (ESAC) ITACA Frequency wavenumber spectrum method from
microtremor array measurements (ESAC-FK) ITACA Multi-channel analysis of the surface waves (MASW) ITACA and T-NSMP
Spectral analysis of surface waves (SASW) Rosenblad et al., 2002
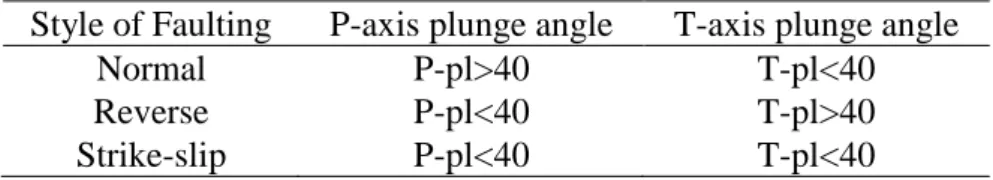
The unification of earthquake and station metadata for RESORCE as described in the previous paragraphs is finalized by homogenizing the classification of style-of-faulting (SoF). The homogenization of the SoF classification was a necessary step as the existing double-couple fault-plane solutions are evaluated differently by each reference source to identify the SoF of each event in their inventory. The methodology proposed in Boore and Atkinson (2007) is used to remove the differences in SoF classification of the considered reference sources. This procedure that is modified from Frolich and Apperson (1992) and Zoback (1992) uses the plunge angles of the T- and P-axis of the double-couple fault-plane solutions. The procedure does not require the actual fault plane solution, which makes it appealing in the determination of SoF for earthquakes that occur on faults without a rupture trace on the surface. It determines a unique SoF, which is not the case for SoF classifications based on the rake angle. The rake angles of actual and auxiliary planes from double-couple fault-plane solutions can sometimes result in two different SoF classifications for the same earthquake.
The missing plunges of the T- and P-axis for certain events in RESORCE does not constitute a drawback in the implementation of the Boore and Atkinson (2007) procedure as they can be computed from the strike, dip and rake angles of the fault-plane solutions (Snoke, 2003). Table 2 lists the intervals of the plunges of the T- and P-axis for SoF classification in RESORCE.
Table 2 Criteria of style-of-faulting classification using plunge angles Style of Faulting P-axis plunge angle T-axis plunge angle
Normal P-pl>40 T-pl<40
Reverse P-pl<40 T-pl>40
Strike-slip P-pl<40 T-pl<40
The completed earthquake and station metadata of RESORCE enabled the computation of missing source-to-site distance measures (Repi, Rhyp, RJB and Rrup)2 as well as the evaluation (and, if necessary, re-calculation) of existing ones that are collected from the considered reference sources. The strategy outlined in gathering the RESORCE earthquake and station metadata guided this phase of the work: the existing source-to-site distance information in ISESD and ESMD for the pre-2004 accelerograms is kept as it is except for (a) the source-to-site distances originated from ITACA, (b) the distance modifications based on the revised earthquake metadata resulting from literature survey, and (c) the new distance calculations upon the completion of missing parameters from other reference sources. The distance measures of the post-2004 accelerograms as well as the additional pre-2004 recordings that are not considered by ISESD are also obtained from the other reference sources. In the absence of extended-source distance measures (RJB and Rrup) by the reference source databases their computation is based on the double-couple fault-plane solutions extracted from international or local seismic agencies. For such cases, upon the existence of double-couple fault-plane solutions, the nucleation point is assumed to be at the center of the fault
2 R
epi: epicentral distance; Rhyp: hypocentral distance; RJB: closest distance to the surface projection of ruptured
surface and the rupture dimensions of the fault (length and width) are estimated from Wells and Coppersmith3 (1994). The extended source metrics are calculated as pairs (i.e.,
RJB1 RJB2and
R
rup1
R
rup2) for each plane using the procedure described in Kaklamanos et al. (2011). RESORCE source-to-site distance inventory contains these distance pairs as wellas their arithmetic averages (
R
JBand
Rru p) as alternatives for the end user. The averaging approach that is mostly implemented for events falling into 3.0 ≤ Mw ≤ 6.8 certainly involves uncertainties in the computed extended-source distances. The observations on the computed
RJB 1 RJB2 and
R
rup1
R
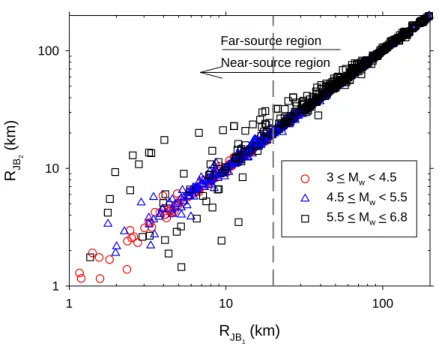
rup2 pairs indicate that the differences between the components of each pair are small for far-source accelerograms and small-to-moderate size earthquakes (i.e. 3.0 ≤ Mw ≤ 5.5). The difference between the components of extended-source distance pairs becomes significant for some large-magnitude (5.5 < Mw ≤ 6.8) recordings that are close to the source. Figure 2 documents these cases for
RJB1 RJB2 pairs. The far-source recording trends in Figure 2 indicate that unless there is a compelling reason for preferring one of the components of extended-source distance pairs, the choice of their average for distant accelerograms would not result in significant errors. The near-source scatters on this figure suggest that the averaging approach, rather than the random choice of one of the distance components, is a rational compromise for extended-source distance metrics that show significant component-wise differences within this distance range. If a double-couple fault-plane solution does not exist for a given event, no attempt is made to calculate the
3 Leonard (2010) recently proposed a set of scaling relationships that relate M
w with rupture length, rupture
width and rupture area. These relationships are self-consistent as they enable to estimate any one of these parameters from the others. Thus, the empirical relationships proposed by Leonard (2010) supersede Wells and Coppersmith (1994). The impact of these alternative approaches on the estimated extended-source distance measures is examined by running a set of analyses that consists of 1582 strong-motion records. The computed RJB values from Leonard (2010) and Wells and Coppersmith (1994) did not show significant deviations from
each other. Thus, the extended-source distance computations are completed by using the rupture length and width formulations provided by Wells and Coppersmith (1994).
source distance metrics by using one of the suggested methods in the literature (e.g., Scherbaum et al., 2004; EPRI, 2004).
Figure 2. Differences between
RJB
1 RJB2 pairs computed from the two planes given by the double-couple fault-plane solutions in the absence of extended-source distance measures (RJB
and Rrup) in the reference source databases. Different color codes and symbols indicate different magnitude intervals.
Strong-Motion Data Processing
As in the case of metadata compilation, the ISESD strong-motion databank is taken as the primary source of raw pre-2004 accelerograms except for those that are archived by ITACA and T-NSMP. The raw accelerometric data compiled by these projects constitute the first-hand information as they are directly obtained from the national strong-motion networks of Italy (ITACA) and Turkey (T-NSMP), respectively. The HEAD and SED accelerograms are used either for completing the non-existing pre-2004 raw Greek and Swiss data in ISESD or expanding RESORCE for Greek and Swiss accelerograms for the post-2004 period. Some additional pan-European accelerometric data (16 multi-component accelerograms) from the
RJB 1 (km) 1 10 100 RJB 2 ( k m) 1 10 100 3 < Mw < 4.5 4.5 < Mw < 5.5 5.5 < Mw < 6.8 Near-source region Far-source region
NGA-West1 4 strong-motion databank are also integrated into RESORCE. These accelerograms were retrieved from the NGA database as processed and are accepted in this format as their band-pass filtering and post-processing scheme is almost identical to the one implemented in RESORCE. A total of 89 already-processed multi-component accelerograms from ISESD are directly incorporated into RESORCE because of their missing raw waveforms. Although the data processing schemes of ISESD and RESORCE are different, these data are not disregarded in order not to overlook the good-quality recordings of the pan-European events while establishing RESORCE.
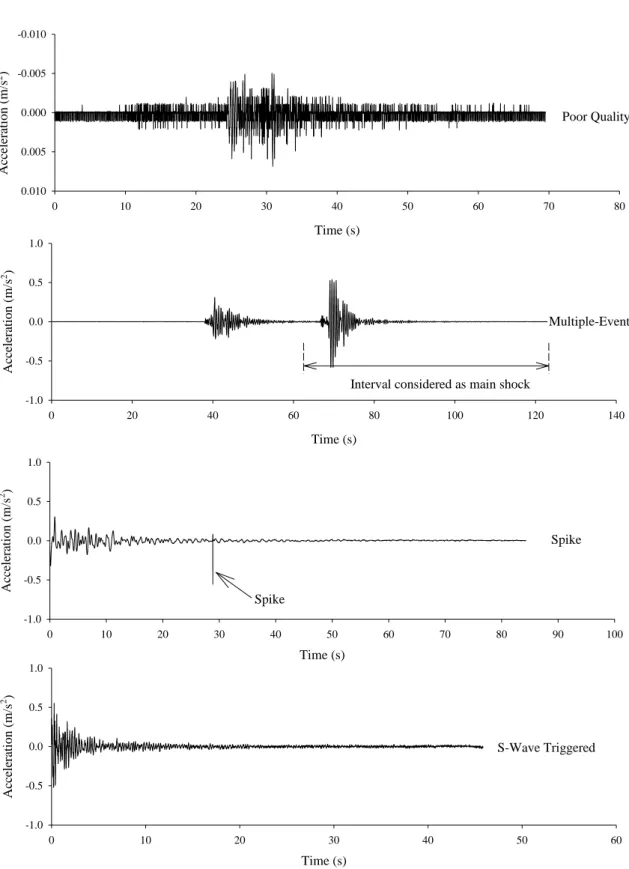
The strong-motion data processing of RESORCE is based on visual screening and band-pass filtering of raw accelerograms. The visual screening of waveforms is used to detect and remove non-standard errors5 (Douglas, 2003; Bommer and Douglas, 2004). Band-pass filtering is implemented right after visual inspection if the records are free of non-standard errors. Otherwise, band-pass filtering constitutes the second stage of the data processing scheme after removing the non-standard errors. Figure 3 presents a set of sample recordings that show different cases of non-standard errors. Extremely low-quality accelerograms (Figure 3.a) are not band-pass filtered as such records would not reveal reliable information in time- and frequency-domain for engineering seismology and earthquake engineering studies. A total of 1658 horizontal and 1083 vertical acceleration components are classified as very low quality recordings in RESORCE. The acceleration trace of the major event is considered for accelerograms with multiple-shock recordings (Figure 3.b). The time interval of the major event is approximately determined by identifying the starting and ending times of the smaller amplitude recordings on the entire accelerogram. Although this procedure may
4
Next Generation Attenuation Project (Power et al., 2008)
5 Non-standard errors refer to types of problems in strong-motion records that cannot be dealt by standard
filtering or baseline adjustment techniques. Some of the frequently observed non-standard errors are high-frequency spikes, S-wave trigger, insufficient digitizer resolution, insufficient sampling rate, multiple shocks, early termination of coda and clipping of accelerograms (Douglas, 2003)
impose some uncertainty on the actual length of the major event, the introduced errors are assumed to be negligible and they do not critically distort the particular features of the major event in the time- and frequency-domain. The very high-frequency spikes having abnormally high amplitudes with respect to the overall data trend in accelerograms (Figure 3.c) are removed by replacing the acceleration ordinate of the spike with the average of the data on either side. No spikey noise that repeats itself due to instrument imperfection (or any other source triggering this kind of high frequency noise) is detected in the visually inspected accelerograms that may require more complicated de-spiking algorithms (e.g., Evans, 1982). The S-wave triggered records (Figure 3.d) are not subjected to time-domain manipulation as in the case of other non-standard errors. They are band-pass filtered without tapering to prevent the clipping of original peak acceleration. The details of band-pass filtering are described in the following paragraph.
The band-pass filter cut-off frequencies are selected by studying the Fourier acceleration spectrum (FAS) of each raw accelerogram to detect the physically unjustifiable frequency content at high- and low-frequency components of the ground motion. The accelerograms are assumed to be contaminated by low- and high-frequency noises beyond the chosen filter cut-off frequencies whose identification is described in the relevant literature (e.g., Boore and Bommer, 2005; Akkar and Bommer, 2006; Douglas and Boore, 2011). In brief, the theoretical corner frequencies of Atkinson and Silva (2000) double-corner source spectrum are used as guidance to the selection of low-cut filter frequencies. These magnitude-dependent corner frequencies are designated as fa and fb that are related to the major and sub-fault sub-fault sizes, respectively. Although the use of Atkinson and Silva (2000) double-corner source spectrum is still not justified for Europe, the low-cut filter frequencies that are greater than fb can be interpreted as the removal of an integral part the signal while filtering the low-frequency noise. The selection of high-cut filter values is based on the high-low-frequency noise
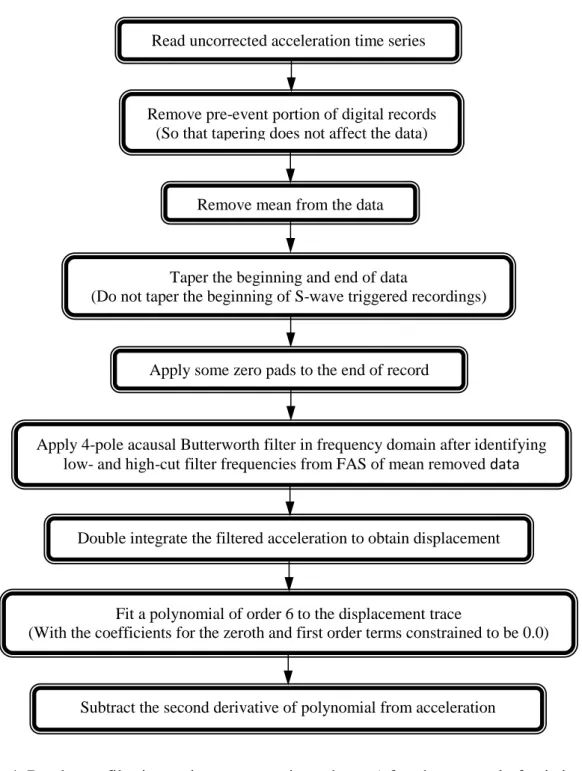
behavior discussed in Douglas and Boore (2011). The flat portion at the high-frequency end of FAS that is contrary to the expected high-frequency attenuation of ground acceleration is removed by choosing an appropriate high-cut filter frequency. If such an unexpected behavior is not observed at the high-frequency end of FAS, the record is not high-cut filtered and the Nyquist frequency of the accelerogram is considered to represent its high-cut filter frequency value. The selected high- and low-cut filter frequencies are documented in RESORCE. The Butterworth acausal filter is preferred as acausal filters do not distort the phase content of processed records that results in lesser sensitivity of response spectrum ordinates as well as peak ground motions to the chosen filter cut-off frequencies. 4-pole Butterworth acausal filtering is applied in the frequency domain and the post processing procedure described in Boore et al. (2012) is used to remove the additionally introduced zero pads during band-pass filtering. The entire RESORCE data processing scheme is given in Figure 4 for completeness. The RESORCE provides the raw accelerometric data as well as those processed by the methodology outlined in Figure 4.
Figure 3. Example waveforms featuring different types of non-standard errors in time domain. Poor Quality Time (s) 0 10 20 30 40 50 60 70 80 A cc el er at ion (m/s 2) -0.010 -0.005 0.000 0.005 0.010 Multiple-Event Time (s) 0 20 40 60 80 100 120 140 A cc el er at ion (m/s 2) -1.0 -0.5 0.0 0.5 1.0 S-Wave Triggered Time (s) 0 10 20 30 40 50 60 A cc el er at ion (m/s 2 ) -1.0 -0.5 0.0 0.5 1.0
Interval considered as main shock
Spike Time (s) 0 10 20 30 40 50 60 70 80 90 100 A cc el er at ion (m/s 2 ) -1.0 -0.5 0.0 0.5 1.0 Spike
Figure 4. Band-pass filtering and post-processing scheme (after the removal of existing non-standard errors) used in RESORCE (modified from Boore et al., 2012). The original version
of the implemented procedure is given in Chiou et al. (2008).
Modifications Made on ISESD during the Compilation of RESORCE
The major emphasis of the previous section is the use of ISESD as the primary reference source while structuring RESORCE. The content of ISESD is either updated (if necessary) or expanded from the other reference sources by following a hierarchical methodology. The first
Read uncorrected acceleration time series
Remove pre-event portion of digital records (So that tapering does not affect the data)
Remove mean from the data
Taper the beginning and end of data
(Do not taper the beginning of S-wave triggered recordings)
Apply 4-pole acausal Butterworth filter in frequency domain after identifying low- and high-cut filter frequencies from FAS of mean removed data
Double integrate the filtered acceleration to obtain displacement
Fit a polynomial of order 6 to the displacement trace
(With the coefficients for the zeroth and first order terms constrained to be 0.0)
Subtract the second derivative of polynomial from acceleration Apply some zero pads to the end of record
part of this section describes the modifications to ISESD in metadata information. This subsection is followed by summarizing the improvements brought over ISESD in terms of data processing.
Metadata Modifications to ISESD
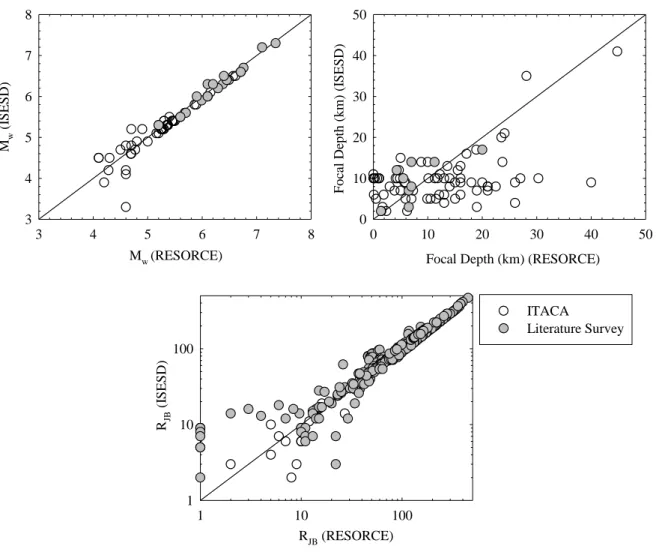
Figure 5 presents the magnitude, depth and source-to-site distance differences between the original ISESD strong-motion databank and the version integrated in RESORCE. The upper left panel of Figure 5 indicates that the modifications in moment magnitude are noticeable in the small magnitude range (Mw < 5). Almost all events that show a difference of 0.1 magnitude units come from the updates using the recent ITACA information. The upper right panel of the same figure shows the changes in the ISESD depth information after the modifications. The differences are noticeable as depth computation involves significant uncertainties. The modifications in depth stem from the information retrieved from the literature survey and the ITACA project. The lower panel of Figure 5 addresses the source-to-site distance differences. The discrepancies in distance are emphasized by using the RJB distance measure as its computation would also reflect the overall modifications made in ISESD in terms of depth, epicentral location as well as the geometry of ruptured fault plane. The major differences in RJB between the original and modified versions of ISESD appear at short distances because extended-source metrics are sensitive to the above source parameters within this distance range. As in the case of changes in magnitude and depth, the major sources of distance modifications are recent literature studies and updated Italian event and station information by ITACA.
Figure 5. Differences in moment magnitude (Mw), focal depth and source-to-site distance information before and after updating the ISESD strong-motion databank by following the
strategy outlined in the previous section. (Grey circles show the modifications based on recent literature survey. White circles denote the modifications due to ITACA).
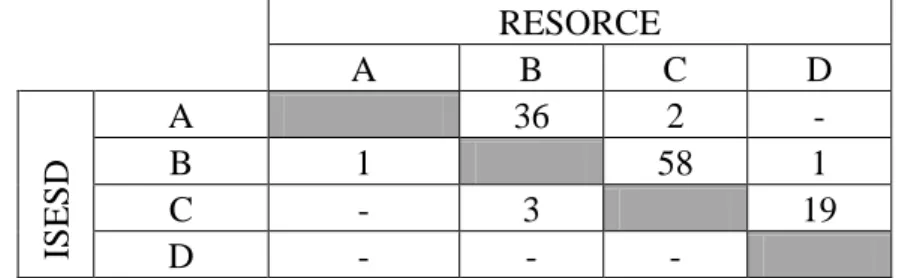
Table 3 shows the changes in strong-motion station site classification of ISESD after evaluating the updates made by the HEAD, ITACA, T-NSMP as well as other sources from the literature. The modifications are listed as Eurocode 8 (CEN, 2004) site classes (site class A: VS30 ≥ 800 m/s; site class B: 360 m/s ≤ VS30 < 800 m/s; site class C: 180 m/s ≤ VS30 < 360 m/s and site class D: VS30 < 180 m/s). The information given in Table 3 indicates that the strong-motion site class updates are significant. A considerable amount of strong-motion sites that are previously categorized as site class B is identified as site class C in RESORCE. Similarly, strong-motion stations falling under rock sites are modified as site class B in
Mw (RESORCE) 3 4 5 6 7 8 M w (I SESD) 3 4 5 6 7 8 ITACA Literature Survey Focal Depth (km) (RESORCE)
0 10 20 30 40 50 F oc al De pth ( km) (I SESD) 0 10 20 30 40 50 RJB (RESORCE) 1 10 100 RJB (I SESD) 1 10 100
RESORCE after the recent information released by the above reference sources. Although not listed in Table 3, a total of 362 strong-motion stations that lack site information in ISESD are classified into one of the site categories of Eurocode 8 (via measured VS30 values) after the compilation of RESORCE. Of these strong-motion stations 195 sites are identified as site class C whereas 148 stations are defined as site class B. The rest of the strong-motion stations are site class A (7) and D (12). The reliability of new site classification in RESORCE is high with respect to the previous information given by ISESD as it is mainly based on VS30 values that are determined from the geophysical site exploration techniques (Table 1).
Table 3. Changes in site classes between RESORCE and ISESD RESORCE A B C D ISES D A 36 2 - B 1 58 1 C - 3 19 D - - -
Comparisons between ISESD and RESORCE data processing
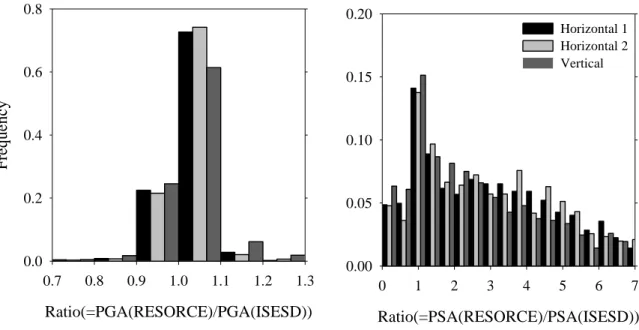
Figure 6 summarizes the modifications in ISESD due to the adopted data processing scheme in RESORCE. The histograms describe the processed PGA (left panel) and spectral acceleration (PSA(T=4.0s); right panel) ratio statistics of ISESD vs. RESORCE data processing. The differences in spectral acceleration ratios are quite noticeable with respect to those of PGA statistics. This observation indicates the importance of low-cut filter frequency choice in strong-motion data processing that is emphasized in various articles (e.g., Boore and Bommer, 2005; Akkar and Bommer, 2006; Douglas and Boore, 2011; Akkar et al., 2011) by studying the influence of high- and low-cut filter values on short- and long-period spectral ordinates, respectively. The common finding of these papers is the lesser influence of the
selected high-cut filter frequency on short-period spectral values, which is exactly the opposite trend in terms of the low-cut filter effect on the long-period spectral band. The PSA(T=4.0s) statistics suggest that the spectral ordinates at long periods after RESORCE data processing are significantly larger than those originally reported by ISESD. This observation points out that the RESORCE processing scheme that tailors the decision on filter cut-offs from the frequency content of each ground motion results in lesser low-cut filter frequencies than the constant filter cut-off (0.25 Hz) used by ISESD for most of the accelerometric data. The insignificant differences in the PGA ratio statistics certify the lesser influence of high-cut filter frequencies on the short and very short spectral periods. However, the consideration of ground-motion frequency content by the RESORCE processing is believed to result in minimum interference to the high-frequency content of the processed accelerometric data rather than the use of a constant high-cut filter frequency of 25 Hz, which is the case in ISESD.
Figure 6. PGA and PSA (T=4 s) ratio statistics of ISESD vs. RESORCE data processing schemes Ratio(=PGA(RESORCE)/PGA(ISESD)) 0.7 0.8 0.9 1.0 1.1 1.2 1.3 Freq ue nc y 0.0 0.2 0.4 0.6 0.8 Ratio(=PSA(RESORCE)/PSA(ISESD)) 0 1 2 3 4 5 6 7 0.00 0.05 0.10 0.15 0.20 Horizontal 1 Horizontal 2 Vertical
Overall Seismological Features
The compilation strategy of RESORCE and the summary of updates with respect to ISESD are given in the previous sections. This section presents a general picture about the characteristics of RESORCE in order to understand the extents as well as the limitations of the most recent pan-European strong-motion databank.
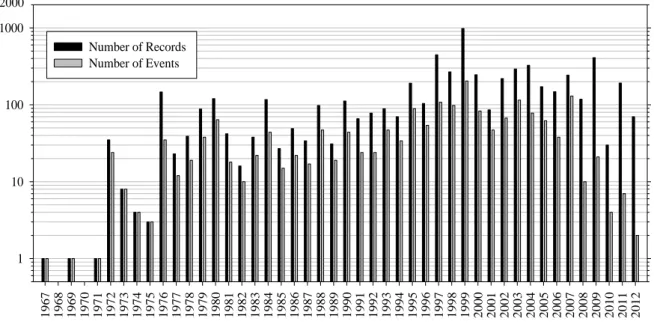
The databank consists of 5882 accelerograms from 1540 strong-motion stations and 1814 earthquakes. A total of 5810 accelerograms are tri-axial recordings whereas the rest miss either one of the horizontal components or the vertical component. The total number of singly-recorded events is 1021 in RESORCE. Events with 2 and 3 recordings constitute 14% and 9% of RESORCE, respectively. This percentage decreases to 3.3% for earthquakes having 5 recordings. There are only 245 events in the RESORCE inventory that have 6 or above strong-motion accelerograms. Figure 7 demonstrates the yearly distribution of the earthquakes and accelerograms in the databank. The strong motions archived by the databank date back to the 1970s; the 1967 Debar Earthquake record occurred in Debar, Macedonia. More than half of the events and approximately 65% of accelerograms in the databank are compiled from the earthquakes that occurred in the last 15 years (1998-2012). Consequently, the current compilation efforts summarized in this paper resulted in an increase of ~30% in data size over ISESD. The higher concentration of events and records within the last 15-year time span can be attributed to the increased number of strong-motion stations all around the pan-European region. Most of the accelerograms collected in the last 15 years are recordings of digital sensors. As a matter of fact the analog and digital waveform percentages in RESORCE are 27% and 68%, respectively and almost the entire digital data (98% of the digital accelerograms) were collected in the last 2 decades.
Figure 7. Annual distribution of accelerograms and earthquakes in RESORCE
The geographical distribution and the country-based breakdown of earthquakes and stations in RESORCE are displayed in Figure 8 and Table 4, respectively. Table 4 also shows the limitations of RESORCE in terms of Mw, distance and depth ranges. These two separate sources of information, when interpreted together, indicate that almost all recorded events are shallow active crustal earthquakes and most of the accelerograms are from Turkey, Italy and Greece on the Mediterranean coast as well as from Switzerland in central Europe. This information emphasizes the importance of updates and expansion of metadata as well as accelerometric waveform content from above stated countries in RESORCE. The upcoming versions of RESORCE will include French accelerometric data for a wider coverage of low-to-moderate size events in Europe.
1967 1968 1969 1970 1971 1972 1973 1974 1975 1976 1977 1978 1979 1980 1981 1982 1983 1984 1985 1986 1987 1988 1989 1990 1991 1992 1993 1994 1995 1996 1997 1998 1999 2000 2001 2002 2003 2004 2005 2006 2007 2008 2009 2010 2011 2012 1 10 100 1000 Number of Records Number of Events 2000
Figure 8. Geographical distributions of (a) earthquakes and (b) strong-motion stations in RESORCE
Table 4. Country based contributions to the RESORCE Country Name Number of Events Number of Records Number of Stations Focal Depth Range (km) Mw Range Repi Range (km) Albania 4 5 3 5-25 5.4-5.9 7-35 Algeria 22 28 5 2-12 5.2-5.9 3-50 Armenia 13 38 12 3-28 5.48-6.7 3-77 Austria 5 20 7 7-8 3.3-3.6 12-247 Bosnia and Herzegovina 7 13 11 10-33 5.7 7-44 Bulgaria 3 3 2 3-10 - 6-12 Croatia 10 15 9 0-39 5.5 4-132 Cyprus 1 1 - 19 6.8 435 Egypt 3 9 - 12-24 4.5-7.1 32-93 France 19 84 20 0-18 3.38-4.9 5-302 Georgia 13 46 10 4-19.7 4.8-6.8 9-115 Germany 12 74 19 4-22 3.1-5.2 4-260 Greece 386 772 130 0-127 3-6.91 1-238 Hungary 1 1 2 6 - 17 Iceland 47 205 31 1.4-17 4.3-6.57 4-64 Iran 44 396 325 0-44 4.56-7.42 1-375 Israel 3 6 15 9-18 5.1-5.3 22-46 Italy 315 1577 361 0-255.3 3.3-6.93 1-427 Kyrgyzstan 2 5 3 0-18 - 28-29 Lebanon 1 1 - 5 5.1 75 Liechtenstein 1 4 1 11 3.7 4 Macedonia 3 9 12 12-20 6.1 21-80 Montenegro 22 59 13 4-40 5.4-6.9 3-91 Netherlands 1 3 - 14.6 5.3 83 Norway 7 10 3 0-21 3.6-5.5 26-309 Portugal 60 125 32 0-77 4.69-7.8 5-332 Romania 4 32 14 86-137 6.3-7.53 7-484 Serbia 8 8 3 3-10 5.5 8-237 Slovenia 14 32 16 4-16 4.3-5.7 1-88 Spain 12 23 16 5-28 3.9-5.3 1-486 Switzerland 30 208 110 1-31 3-3.92 2-119 Syria 1 10 10 29 5.5 303 Turkey 724 2027 330 0-98 2.8-7.6 2-399 United Kingdom 3 3 3 8-19 - 35-135 Uzbekistan 13 30 12 0-45 6.76 1-53
Figure 9 shows the earthquake (left column) and accelerometric (right column) data distributions in RESORCE for moment magnitude, depth and SoF. A total of 838 events have
the reported moment magnitude information from international and local seismological agencies as well as earthquake-specific literature studies (first row plots). When moment magnitudes that are estimated from empirical magnitude conversion relations are included, the number of events with Mw information raises to 1460. The moment magnitude estimations are concentrated between 3.5 ≤ Mw ≤ 5.5. These relatively small events come from T-NSMP, HEAD and ITACA. They are originally reported as duration magnitude (Md), local magnitude (ML) and body-wave magnitude (mb) for Turkish events; whereas ML is the original magnitude scale in Italian and Greek earthquakes. The total number of accelerograms having Mw information is 5285 (4269 reported and 1016 estimated) out of 5882. The event and record based distributions of moment magnitude suggest the dominancy of moderate-size events (4 ≤ Mw ≤ 6) in RESORCE (41% of earthquakes and 50% of accelerograms). The fraction of events that can be considered as large earthquakes (i.e., Mw ≥ 6.5) is only 2% in the entire population. The corresponding number of accelerograms constitutes 8% of the accelerometric data in RESORCE. The total number of events without moment magnitude information is 354 (20% of RESORCE). These events (labeled as “Unknown” on the histograms) are reported in different magnitude scales but their corresponding Mw values cannot be estimated due to the lack of proper empirical magnitude conversion relationships. The second row histograms display depth distribution in RESORCE. The depth range is less than 30km for about 94% of the events in RESORCE. The corresponding percentage in terms of strong-motion recordings is also 94% indicating that RESORCE is dominated by shallow crustal events. The events of depths ranging between 50 km and 140 km are mainly from the Hellenic and Cyprus Arc subduction zone, Vrancea region, Portugal and southern Turkey. The distribution of event and accelerometric data in terms of SoF is given in the last column of Figure 9. The majority of events and accelerograms are from the strike-slip, SS, (31% of events and 35% of records) and normal, N, (25% of events and 31% of records) faults. The
data size of reverse, R, events and accelerograms are small when compared to the other SoF classes but they still constitute 11% of the events and 16% of the strong-motion records. The depth and SoF distributions also indicate that the corresponding information is still missing (designated as “Unknown” on each histogram) for some earthquakes in RESORCE that mainly fall into the small magnitude range (Mw ≤ 5). Earthquakes and accelerograms falling into this category are more prominent in the SoF statistics. The major reason behind this deficiency is the lack of double-couple fault-plane solutions for small magnitude earthquakes that provide direct information for the identification of SoF and depth parameters. Inherently, the literature survey (i.e., earthquake-specific publications) rarely focuses on the solutions of such small events unless they are associated with a major destructive earthquake. There are pragmatic solutions grossly determining the style-of-faulting of such small-size events. One alternative methodology is to overlay them on the seismotectonic maps to judge their SoF from their proximity to the fault zones. The complexity of source kinematics as well as insufficient resolution of seismotectonic maps in Europe and surrounding countries would increase the associated uncertainty in such classification. Thus, such an approach should be discouraged in SoF classification and is not implemented in the current version of RESORCE.
Figure 9. Distributions of events (first column) and accelerograms (second column) in RESORCE in terms of moment magnitude (first row), depth (second row) and SoF (third
row). The vertical bars labeled as “Unknown” refer to the events or accelerograms that cannot be classified within any one of these parameters due to missing event or strong-motion
station metadata information. 8 7 6 5 4 3 2 Focal Depth (km) Nu m b er o f Ea rt h q u ak es 0.1 1 10 100 1000 Focal Depth (km) Nu m b er o f R ec o rd in g s 0.1 1 10 100 1000 Style of Faulting Nu m b er o f Ea rt h q u ak es 10 100 1000 Style of Faulting Nu m b er o f R ec o rd in g s 10 100 1000 0 N Mw Nu m b er o f Ea rt h q u ak es 0.1 1 10 100 1000 Reported Estimated Mw Nu m b er o f R ec o rd in g s 0.1 1 10 100 1000 Un k n o w n 10 20 30 40 50 100 200300 0 10 20 30 40 50 100 200300 Un k n o w n Un k n o w n Un k n o w n 8 7 6 5 4 3 2 O R SS N O R SS Un k n o w n Un k n o w n
Figure 10 presents similar histograms as of Figure 9 to describe the distributions of strong-motion stations (left panel) and accelerograms (right panel) in terms of Eurocode 8 (CEN, 2004) site classification. The statistics are based on measured VS30 values and inferred site classes from local site geology. The site information of RESORCE contains a total of 423 strong-motion stations with known VS30 values due to the site characterization studies in Greece, Italy and Turkey (details are given in Table 1). The corresponding number of accelerograms recorded at these stations is 2936. The number of strong-motion sites and accelerograms with site classes inferred from the local geological conditions is 627 and 1876, respectively. Of the entire accelerometric data 1070 records (18% of strong-motion records in RESORCE) do not have any site characterization. The majority of accelerometric data (38%) is recorded at site class B strong-motion stations. Only 3% of the accelerograms in RESORCE fall into site class D. The accelerograms in site class A and C constitute 17% and 24% of the databank, respectively.
Figure 10. Distributions of strong-motion stations (left panel) and accelerograms (right panel) in RESORCE in terms of Eurocode 8 (CEN, 2004) site classes. The explanation about the
labels designated as”Unknown” is similar to the one given in the caption of Figure 9.
Figure 11 shows a general picture for Mw vs. distance distributions in RESORCE. The red and black dots refer to analog and digital recordings, respectively. Figure 11 depicts
Site Class Nu m b er o f St ati o n s 1 10 100 1000 Estimated Measured Site Class Nu m b er o f R ec o rd in g s 1 10 100 1000 A B C D E A B C D E Un k n o w n Un k n o w n
relatively large volumes of analog recordings in RESORCE. Inherently, the recording quality of digital accelerograms is better than those of analog recordings except for the first-generation digital recorders having 12 bit resolution. In most cases the dynamic range of analog accelerographs varies between 45-55 dB (Trifunac and Todorovska, 2001) indicating high noise contamination that particularly dominates the recording quality of small-amplitude and distant events. The sampling intervals of accelerograms is RESORCE are mostly 0.01s and 0.005s regardless of the recorder type. The record quality of accelerograms in RESORCE is further emphasized while discussing the filter cut-off frequencies in the subsequent paragraphs.
The distance metrics (Repi, Rhyp, RJB and Rrup) are plotted up to 200 km to have a better perception in the Mw vs. distance distributions. The calculations of Repi and Rhyp distance metrics are easier than RJB and Rrup as the latter two distance measures require additional information about the ruptured fault geometry. The entire accelerometric data in RESORCE (5882 records) contain the Repi information. The number of accelerograms having Rhyp information is 5751 as 131 recordings lack depth information. A total of 3906 records in RESORCE have RJB values. This number reduces to 2490 recordings for Rrup as the calculation of this distance measure involves the largest number of seismic parameters, which is difficult to acquire with the current content of the reference sources used during the compilation process. The information on ruptured fault geometry as well as double-couple fault-plane solutions becomes poor towards smaller magnitude events in RESORCE (see discussions in the previous paragraphs) and these adverse features primarily affect the Rrup computations in the small magnitude range. The scatters in Figure 11 depict that the Mw vs. distance distribution is fairly uniform for distances greater than 10 km and moment magnitudes approximately greater than 4. For shorter distances and smaller magnitudes, the
homogeneity in Mw vs. distance distributions diminishes and this is more visible in Rhyp and Rrup.
Figure 11. Distribution of Mw vs. (a) Repi, (b) Rhyp, (c) RJB and (d) Rrup. Scatter points in red color indicate analog records whereas black scatter points designate digital records. Moment
magnitude information given on each plot is either directly extracted from the original reference source (see Tables A1 and A2) or estimated from an empirical relationship as explained under the “Compilation of Earthquake and Strong-Motion Station Metadata”
subsection. (a) Repi (km) 1 10 100 Mw 2 3 4 5 6 7 8 (b) Rhyp (km) 1 10 100 Mw 2 3 4 5 6 7 8 Digital data Analog data (c) RJB (km) 1 10 100 Mw 2 3 4 5 6 7 8 (d) Rrup (km) 1 10 100 M w 2 3 4 5 6 7 8
Figures 12 and 13 show the magnitude-dependent variation of low-cut (flow-cut) and high-cut (fhigh-cut) filter cut-off frequencies used in the RESORCE data processing, respectively. Each row shows the chosen filter cut-off frequencies for a different site class in Eurocode 8 (CEN, 2004). The panels on the left show the filter cut-off values of the horizontal acceleration components. The right-hand-side panels describe the same information for vertical acceleration components. The straight lines on Figure 12 also show the magnitude-dependent variation of theoretical corner frequencies, fa and fb, that are used for guidance while deciding on the individual low-cut frequencies of accelerograms. The scatter diagrams in Figure 12 indicate that only few selected low-cut frequencies are above the corresponding fb values suggesting that the actual low-frequency content of the processed accelerograms is preserved fairly well. The low-cut filter values tend to decrease with increasing magnitude except for site class A (VS30 ≥ 800 m/s) ground motions. The described trend in flow-cut vs. Mw is not very clear with respect to similar type of comparisons made by previous studies (e.g., Akkar et al., 2010). The major reason behind this observation might be the large percentage of analog accelerograms (30%) among the processed data whose resolution in time- and frequency-domain does not permit the selection of very low flow-cut values with increasing magnitude. The marginal drop in flow-cut with increasing Mw for site class A recordings justifies the above assertion as 73% of ground motions in this site class are analog recordings. The scatters given in Figure 13 indicate that, except for a few cases, the chosen high-cut filter frequencies are almost exclusively above the 10 Hz limit. The records subjected to severe high-cut filtering are mainly from low-quality analog and digital waveforms. These accelerograms constitute approximately 23% of the entire RESORCE archive. This discussion once again advocates the importance of waveform quality in order to extract the utmost information from the processed recordings.
Figure 12. Variation of low-cut filter frequencies as a function of Mw for different site classes in RESORCE. Moment magnitude information given on each plot is either directly extracted
from the original reference source (see Tables A1 and A2) or estimated from an empirical relationship as explained under the “Compilation of Earthquake and Strong-Motion Station
Metadata” subsection. Site Class A f lo w -cu t (H z) 0.01 0.1 1 10
Horizontal Components Vertical Components
Site Class A f lo w -cu t (H z) 0.01 0.1 1 10 Site Class B f lo w -cu t (H z) 0.01 0.1 1 10 Site Class B f lo w -cu t (H z) 0.01 0.1 1 10 Site Class C f lo w -cu t (H z) 0.01 0.1 1 10 Site Class C f lo w -cu t (H z) 0.01 0.1 1 10 Site Class D Mw 2 3 4 5 6 7 8 f lo w -cu t (H z) 0.01 0.1 1 10 Site Class D Mw 2 3 4 5 6 7 8 f lo w -cu t (H z) 0.01 0.1 1 10 fa fb fa fb fb fa fa fa fa fa fa fb fb fb fb fb
Figure 13. Same as Figure 12 but for high-cut filter frequencies. Site Class A f hi gh -cut (Hz) 1 10 100
Horizontal Components Vertical Components
Site Class A f hi gh -cut (Hz) 1 10 100 Site Class B f hi gh -cut (Hz) 1 10 100 Site Class B f hi gh -cut (Hz) 1 10 100 Site Class C f hi gh -cut (Hz) 1 10 100 Site Class C f hi gh -cut (Hz) 1 10 100 Site Class D Mw 2 3 4 5 6 7 8 f hi gh -cut (Hz) 1 10 100 Site Class D Mw 2 3 4 5 6 7 8 f hi gh -cut (Hz) 1 10 100
Summary and Conclusions
This paper summarizes the general features of the most recent pan-European strong-motion databank that updates and expands its predecessor developed by Ambraseys et al. (2004a). The details of the topics discussed in this paper will be posted as a separate document on the official web site of RESORCE when the databank is made available for public use. The online documentation will use flags to describe the specific features of each entry (e.g., reference source of magnitude and VS30 information, specific literature on fault rupture information or data processing parameters etc.) in the metadata. The dissemination of RESORCE will be realized in the near future under the collaboration of multi-national European projects SIGMA, NERA (Network of European Research Infrastructures for Earthquake Risk Assessment and Mitigation) and EPOS (European Plate Observing System) together with non-profit European data centers (EMSC and ORFEUS – Observatories and Research Facilities for European Seismology –). As a matter of fact, a working group has already been established under ORFEUS and EPOS to coordinate these efforts for long-term sustainability of RESORCE. This new structure aims to shape the future policies among accelerometric networks in the broader Europe region to enhance integral approaches for the efficient use of strong-motion data in engineering seismology and earthquake engineering studies.
The current version of RESORCE increases the record and event size of its predecessor by approximately 2.5 times with improvements in magnitude and distance distributions through additional data from recent Turkish, Italian, Swiss and Greek events. The data size will be increased further in the upcoming versions of RESORCE by including recordings of the French Accelerometric Network (RAP, http://www-rap.obs.ujf-grenoble.fr). The inclusion of French accelerograms in RESORCE will result in a larger coverage of moderate-to-low seismic events in Europe. The methodology followed in the compilation of RESORCE results
in more reliable earthquake and station metadata. The strong-motion site characterization is primarily calibrated by measured VS30. The extended- and point-source distance measures are computed from reliable literature studies or by following a systematic methodology. The uniform strong-motion data processing, as part of these efforts, has increased the usable period range of the accelerograms in the inventory as the choice of filter cut-offs is guided by the frequency content of the accelerograms. This step, implemented efficiently in the evolution of RESORCE, supersedes the use of the constant filter cut-off approach in ISESD.
The current size of RESORCE consists of 5882 multi-component accelerograms from 1814 events between 1967 and 2012. The number of strong-motion stations in the inventory is 1540 out of which one-third of stations have direct shear-wave velocity profiles. Almost 80% of the events have moment magnitude information. The earthquake magnitudes range between 2.8 and 7.8 in RESORCE. The entire databank has the Repi source-to-site distance information. The corresponding numbers for Rhyp, RJB and Rrup source-to-site distance metrics are 5751, 3906 and 2490, respectively. The total number of uniformly processed accelerograms is approximately 86% of the entire RESORCE population.
The information summarized in this paper comprises of the entire accelerometric recordings that are evaluated in RESORCE. The public open version will not include the accelerograms suffering from extremely low quality waveforms in all three components. A set of source-to-site distance vs. event size criteria will also be established to remove small-amplitude and far distance accelerograms from final version of RESORCE that are limited in use for engineering seismology and earthquake engineering.
The overall picture given in the above paragraphs makes RESORCE an important source of information for hazard and risk studies in and around Europe. The quality and content of RESORCE is comparable with similar type of databanks such as those from the NGA-West1 (Power et al., 2008) and NGA-West2 (Bozorgnia et al., 2012) projects. As summarized in the
first paragraph the efforts put forward in the compilation of RESORCE should be supplemented by long-term research projects within the European context to complete the missing or (partially) unreliable metadata information. In particular, efficiently oriented financial funds for site characterization of strong-motion stations in terms of measured shear-wave velocity profiles or well-defined source characterization projects that seek double-couple solutions of small-to-moderate size events from regional seismotectonic and stress field studies as well as relocation of earthquakes for improvements in the spatial distribution of events will certainly minimize the metadata related uncertainties in RESORCE. Projects encouraging the inclusion of recordings from pan-European countries other than those contributing significantly to the accelerometric archive of RESORCE will also lead to a better reflection of seismic activity in the region covered by this strong-motion databank. Such grants will also create numerous research opportunities in the fields of earthquake engineering and engineering seismology in Europe. As a matter of fact the growth rate of accelerometric data in the broader Europe in the last two decades makes such Europe-wide projects indispensable.
Acknowledgments
The strong-motion databank presented in this paper has been developed within the SeIsmic Ground Motion Assessment (SIGMA) project. The SIGMA project is funded and supported by EDF, AREVA, CEA and ENEL. The initial phase of the study used the SHARE strong-motion databank that is one of the deliverables of the SHARE (Seismic Hazard Harmonization in Europe) Project funded under contract 226967 of the EC-Research Framework Programme FP7. The authors benefitted significantly from the suggestions and comments of two anonymous reviewers for their comments for improving the quality of the article. The authors would like thank Mr. Ozkan Kale and Mr. Saeed Moghimi for their
support during the data processing stage of RESORCE. The manuscript is revised thoroughly by Prof. Tanvir Wasti.