HAL Id: inserm-02155110
https://www.hal.inserm.fr/inserm-02155110
Submitted on 13 Jun 2019HAL is a multi-disciplinary open access archive for the deposit and dissemination of sci-entific research documents, whether they are pub-lished or not. The documents may come from teaching and research institutions in France or abroad, or from public or private research centers.
L’archive ouverte pluridisciplinaire HAL, est destinée au dépôt et à la diffusion de documents scientifiques de niveau recherche, publiés ou non, émanant des établissements d’enseignement et de recherche français ou étrangers, des laboratoires publics ou privés.
Significant variation between SNP-based HLA
imputations in diverse populations: the last mile is the
hardest
Derek Pappas, Antoine Lizee, Vanja Paunic, Karl Beutner, Allan Motyer,
Damjan Vukcevic, Stephen Leslie, Jacek Biesiada, Jarek Meller, Kent Taylor,
et al.
To cite this version:
Derek Pappas, Antoine Lizee, Vanja Paunic, Karl Beutner, Allan Motyer, et al.. Significant variation between SNP-based HLA imputations in diverse populations: the last mile is the hardest. Phar-macogenomics Journal, Nature Publishing Group, 2018, 18 (3), pp.367-376. �10.1038/tpj.2017.7�. �inserm-02155110�
Significant variation between SNP-based HLA imputations in
diverse populations: The last mile is the hardest
Derek J. Pappas1, Antoine Lizee2, Vanja Paunic3, Karl R. Beutner2, Allan Motyer4,5, Damjan
Vukcevic4,5, Stephen Leslie4,5, Jacek Biesiada6, Jarek Meller6, Kent D. Taylor7, Xiuwen
Zheng8, Lue Ping Zhao9, Pierre-Antoine Gourraud2,10,11,¶, Jill A. Hollenbach2,¶, Steven J.
Mack1,¶, and Martin Maiers3,¶,*
1Center for Genetics, Children’s Hospital Research Institute, Oakland, California, United States of America
2Department of Neurology, University of California, San Francisco, California, United States of America
3Bioinformatics Research, National Marrow Donor Program, Minneapolis, Minnesota, United States of America
4Centre for Systems Genomics, Schools of Mathematics and Statistics, and BioSciences, The University of Melbourne, Melbourne, Australia
5Murdoch Children’s Research Institute, Melbourne, Australia
6Department of Biomedical Informatics, Cincinnati Children’s Hospital Medical Center &
Department of Environmental Health, University of Cincinnati, Cincinnati, Ohio, United States of America
7Los Angeles Biomedical Research Institute, Torrance, California, United States of America 8Department of Biostatistics, University of Washington, Seattle, Washington, United States of America
9Fred Hutchinson Cancer Research Center, Seattle, Washington, United States of America 10ATIP-Avenir Team UMR Inserm 1064, Nantes, France
11Nantes University Hospital Department of Public Health, Nantes, France
Abstract
Four SNP-based HLA imputation methods (e-HLA, HIBAG, HLA*IMP:02 and MAGPrediction) were trained using 1000 Genomes SNP and HLA genotypes and assessed for their ability to accurately impute molecular HLA-A, -B, -C, and –DRB1 genotypes in the Human Genome Diversity Project cell panel. Imputation concordance was high (> 89%) across all methods for both
*Corresponding author: [email protected] (MM). ¶These authors contributed equally to this work.
Conflict of Interest
HHS Public Access
Author manuscript
Pharmacogenomics J
. Author manuscript; available in PMC 2018 November 22.Published in final edited form as:
Pharmacogenomics J. 2018 May 22; 18(3): 367–376. doi:10.1038/tpj.2017.7.
A
uthor Man
uscr
ipt
A
uthor Man
uscr
ipt
A
uthor Man
uscr
ipt
A
uthor Man
uscr
ipt
HLA-A and HLA-C, but HLA-B and HLA-DRB1 proved generally difficult to impute. Overall, less than 27.8% of subjects were correctly imputed for all HLA loci by any method. Concordance across all loci was not enhanced via the application of confidence thresholds; reliance on
confidence scores across methods only led to noticeable improvement (+3.2%) for HLA-DRB1. As the HLA complex is highly relevant to the study of human health and disease, a standardized assessment of SNP-based HLA imputation methods is crucial for advancing genomic research. Considerable room remains for the improvement of HLA-B and especially HLA–DRB1 imputation methods, and no imputation method is as accurate as molecular genotyping. The application of large, ancestrally diverse HLA and SNP reference datasets and multiple imputation methods has the potential to make SNP-based HLA imputation methods a tractable option for determining HLA genotypes.
Introduction
Located on the short arm of chromosome 6p21, the human Major Histocompatibility Complex (MHC) contains 226 genes with pivotal roles in the immune system. These include the Human Leukocyte Antigen (HLA) genes, which have been extensively studied as central determinants of allogeneic transplantation success. More than 100 infectious, autoimmune, inflammatory diseases and cancers are associated with HLA variation1. Furthermore, HLA genes have been associated with a number of immunologically mediated drug interactions. For example HLA-B*57:01, DR7 and DQ3 are associated with hypersensitivity to the HIV/ AIDS antiviral drug Abacavir2, 3, HLA-B*58:01 is associated with adverse reactions to the chronic gout treatment allopurinol4, and HLA-B*15:02 and HLA-A*31:01 are associated with hypersensitivity to the epilepsy and neuropathic pain medication carbamazepine5. Knowledge of patients’ HLA genotypes will help exclude those at risk of drug reactions that confer considerable morbidity and mortality6. The HLA genes are highly polymorphic, with 15,635 allelic variants identified as of October 2016, and a variety of PCR-based HLA genotyping methods have been applied to identify specific HLA alleles 7.
While genome-wide association studies (GWAS) have identified genetic association signals for many common diseases8–10, the structural complexity, high polymorphism and extensive linkage disequilibrium (LD) that characterize the MHC11, 12 have posed challenges for the interpretation of GWAS in this region. While many of the strongest associations revealed to-date by GWAS with disease1, 13 and drug-induced hypersensitivity 2–5 are in the MHC, these associations have generally identified non-coding single nucleotide polymorphisms (SNPs), which are primarily related to gene function through linkage disequilibrium 14. When association signals have been identified in the vicinity of HLA genes, the complexity of HLA polymorphism and the cost of molecular HLA genotyping have often limited efforts to fine-map causal HLA variants 7. The appreciation that individual SNPs, SNP haplotypes and other genetic markers are in strong LD with specific HLA alleles15, 16 has motivated the development of methods for the imputation of HLA genotypes from SNP genotypes, with the goal of interpreting associations identified within the MHC region17–19 in light of HLA allelic variation. These HLA imputation methods have also been applied to existing SNP data to confirm findings based on molecular HLA genotyping5, 11.
A
uthor Man
uscr
ipt
A
uthor Man
uscr
ipt
A
uthor Man
uscr
ipt
A
uthor Man
uscr
ipt
While HLA imputation has primarily been evaluated in cohorts of European ancestry15 (and in non-Europeans to a lesser extent), no studies of multiple HLA imputation methods, applied to a worldwide range of populations, have been performed. Here, we describe the results from the ImmPute project, a consortium effort evaluating four HLA imputation methods (e-HLA [described in Supplementary Information], HIBAG17, HLA*IMP:0219 and MAGPrediction 18). Each method was applied to impute HLA genotypes using SNP genotypes in the Human Genome Diversity Project (HGDP) 20 cell panel after being trained on HLA and SNP genotypes in phase one 1000 Genomes (1000G) Project samples 21 alone, and the results evaluated for accuracy and performance against HLA genotypes determined through standard molecular methods. The only variable in this approach is the applied imputation method, allowing the unobstructed comparison of method-specific variations in imputation outcome.
Methods
MHC SNPS
12,352 extended MHC (xMHC; chr6: 26,000,000–36,000,000; genome build HG19/ GRCh37) SNPs were obtained from two sources for 889 HGDP cell panel subjects. 11,149 MHC SNPs were extracted from the UCLA Medical Center Illumina Immunochip22 HGDP Dataset 15 (ftp://ftp.cephb.fr/hgdp_supp15/), and additional 1203 MHC SNPs were
extracted from the Stanford HGDP SNP Genotyping Dataset 2 (http://www.hagsc.org/hgdp/ files.html). 164,876 xMHC SNPs for the 1000G samples were extracted from whole-genome sequence data from the phase one 1000G Project repository21 using VCF tools23. 10,268 SNPs common to both datasets were used for this study.
HLA Genotyping
Sequence-based molecular HLA genotyping (SBT) was performed for the HLA class I (HLA-A, -B, -C) and class II (HLA-DRB1) genes in the 1000G samples as previously described24. HGDP HLA genotypes were generated using reverse-format sequence-specific oligonucleotide (rSSO) probe typing methods as previously described25. The A, HLA-C, HLA-B, and HLA-DRB1 loci were typed using Roche linear-array strips. In both methods, immobilized SSO probes, selected for maximum discriminating power between alleles in a given IMGT/HLA Database nomenclature epoch, are hybridized to locus-specific PCR products. Exons 2 and 3 were amplified and assessed for each of the HLA-A, HLA-C and HLA-B loci and exon 2 was amplified and assessed for HLA-DRB1. Historically, and in particular for transplantation, these are the four most commonly typed HLA loci7. The HGDP and KG datasets were genotyped independently and at different, but overlapping loci. HLA-A, -C, -B, -DRB1, and -DPB1 data were available for the HGDP subjects, but DQB1 data were only available for African and European HGDP subjects. HLA-A, -C, -B, -DRB1 and -DQB1 data were available for the KG subjects.
Reference, Testing and Evaluation Datasets
The ‘reference’, or training, dataset consisted of genotypes for 10,268 xMHC SNPs and SBT molecular HLA genotypes data for 930 subjects in the phase one 1000G Project repository21. These data are available online at immpute-project.immunogenomics.org.
A
uthor Man
uscr
ipt
A
uthor Man
uscr
ipt
A
uthor Man
uscr
ipt
A
uthor Man
uscr
ipt
These HLA genotypes were recorded as G groups26 and represented only HLA-A, HLA-B, and HLA-C exons 2 and 3 and HLA-DRB1 exon 2 nucleotide sequence variants. The ‘testing dataset’ consisted of genotypes for the same 10,268 xMHC SNPs for 889 HGDP subjects. The ‘evaluation dataset’ consisted of rSSO molecular HLA genotypes for the same 889 HGDP subjects. These HGDP subjects represent 27 distinct populations from five continental regions. For detailed subject ancestry, please refer to Supplementary Table 1. Imputation Methods
Ensemble-based HLA prediction (e-HLA) uses an ensemble of classifiers to generate consensus predictions and confidence scores. HLA Genotype Imputation with Attribute Bagging (HIBAG) uses unphased SNP genotypes to predict HLA genes by averaging HLA posterior probabilities over an ensemble of classifiers constructed on K bootstrap samples with the same number of individuals17. HLA*IMP:02 extends Browning and Browning’s method for SNP phasing and inference to predict HLA alleles from SNP genotypes using a graphical model of MHC haplotype structure19. Multi-allelic Gene Prediction
(MAGPrediction) uses a likelihood model for prediction of HLA genes from un-phased SNP genotype data18. For a detailed description of each method, see Supplementary Information. The developers of the e-HLA, HIBAG, HLA*IMP:02, MAGPrediction and SNP2HLA imputation methods were supplied with the reference and testing datasets. HLA imputation was performed independently for each method. Detailed descriptions of each method are in the Supplementary Information. Following the initial submission of imputations, the performance of all methods was shared with all method developers, and each developer was given the opportunity to submit a second round of imputations reflecting algorithm
improvement. The SNP2HLA developers withdrew from the study after the initial
performance review. Data for this method were not included in the analyses presented here. The HIBAG and HLA:IMP*02 developers submitted second rounds of imputations. Only the most recently generated imputations performed with HIBAG version 1.3 and
HLA:IMP*02 version 2.Fast (2.F) were used for the scoring and analyses presented here. Scoring Methods
Imputation accuracy (IA) was assessed by comparing concordance between the imputed genotypes and the evaluation dataset at both 1-field and 2-field resolution26. Accuracy included any imputation that (1) correctly imputed the known allele or (2) imputed an allele with identical nucleotide sequence (same G group, http://hla.alleles.org/alleles/
g_groups.html) or identical encoded amino acid sequence (same P group, http://
hla.alleles.org/alleles/p_groups.html) within exons 2 and 3 (HLA class I) or exon 2 (HLA class II)26. Imputation accuracy metrics reported at each locus included the total number of correctly imputed alleles, the total number of correctly imputed alleles per individual (zero, one, or two matches), and the total number of correctly imputed four-locus genotypes (correct for all loci, in all alleles). Within each locus the IA was defined as the total number of correctly imputed alleles across all subjects (N) relative to the number of total
chromosomes imputed (2N).
A
uthor Man
uscr
ipt
A
uthor Man
uscr
ipt
A
uthor Man
uscr
ipt
A
uthor Man
uscr
ipt
IA = ∑ i = 1
N (scoreallele1i + scoreallele2i) 2N
Score is a binary prediction accuracy value for each imputed allele at each locus, which was set to 1 or 0 for accurate and inaccurate predictions, respectively. The scores for each subject had a maximum of 2 and an overall combined locus maximum of 2N (Supplementary Table 1).
Confidence values between 0 and 1 (inclusive) were reported for each imputed allele at each locus (e-HLA, HLA*IMP:02) or for the entire genotype at each locus (HIBAG,
MAGPrediction). Imputation performance was assessed by iteratively applying a confidence value threshold and recalculating the IA for the remaining imputed genotypes. The locus call rate was defined as the ratio of imputed genotypes remaining, relative to the number of total chromosomes (2N) remaining after each threshold reevaluation. Method and locus specific thresholds were obtained from the unique list of confidence values reported with each imputed dataset. Imputation performance was visualized by graphing the IA relative to the call rate. To aid in visualization, x- and y-axes were adjusted accordingly.
Results
Overall Imputation Accuracy
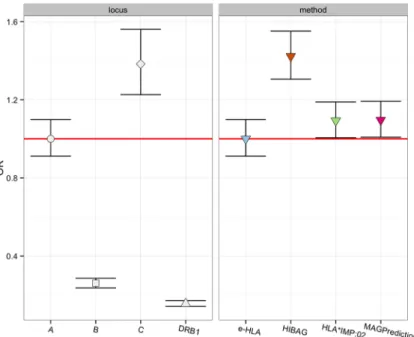
Table 1 outlines the accuracy metrics for each method, including the 2-field imputation accuracy (IA), total count for correct imputations of zero, one, or two alleles (Supplementary Table 2 for percentages), and number of subjects whose four-locus HLA genotypes were correctly imputed. We observe a statistically significant hierarchy of IA between loci, as illustrated in Figure 1. HLA-C ranks highest, with an IA range of 89.9%–94.6% across methods, followed by HLA-A (IA 89.7%–92.2%), HLA-B (IA 69%–77%) and HLA-DRB1 (IA 62.4%–70.1%) (all inter-method p < 1e-07). As further illustrated in Figure 1, we observe fewer differences in IA across methods, with IA for HIBAG ranking higher (p=4.59) than MAGPrediction and HLA*IMP:02, which ranks higher (p=0.037) than e-HLA. Supplementary Table 3 identifies those imputed alleles with IA > 95% or < 50% across all methods. Similar trends result from IA analyses restricted to European HGDP subjects (Supplementary Figure 1), and to sub-Saharan African or randomly selected subsets of HGDP subjects (data not shown). These variable levels of accuracy resulted in low performance overall for correctly imputed four-locus HLA genotypes, with HIBAG
imputation demonstrating a marginal advantage (HIBAG = 27.8% versus 20–17.2%, p = 1.6 e-4).
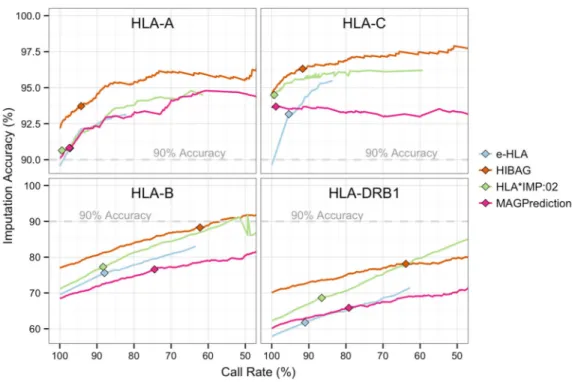
In addition to the imputed genotype, each method reported a per subject imputation confidence value [0–1], either for each individual allele (e-HLA, HLA*IMP:02) or for the genotype (HIBAG, MAGPrediction) at each locus. Figure 2 compares each method’s IA to the call rate (proportion of imputation results) at increasing confidence thresholds. As expected, removing lower confidence results increased accuracy at the expense of call rate, with the exception of MAGPrediction at HLA-C. IA increases in HLA-B and HLA-DRB1
A
uthor Man
uscr
ipt
A
uthor Man
uscr
ipt
A
uthor Man
uscr
ipt
A
uthor Man
uscr
ipt
were linear with respect to a wide range of call rates (50%–80%), and confidence values for these loci failed to demonstrate robust correlations with correct imputations. In contrast, HLA-A and HLA-C exhibited a sharp increase in IA over a narrow range of call rates (80%– 100%), again with the exception of MAGPrediction at HLA-C. Variation in the 0.5
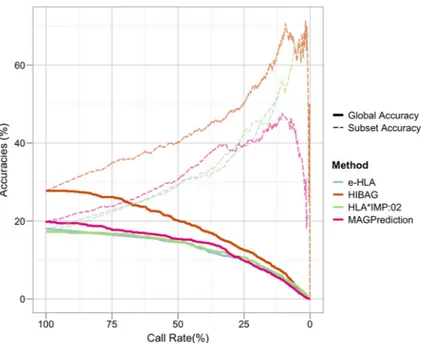
confidence threshold (diamonds, Figure 2), further illustrates the inconsistency of confidence values across methods; for HLA-B and HLA-DRB1, the 0.5 threshold is associated with a wide call rate range (60–90%) depending on method, whereas this threshold is restricted to 90–100% call rates in all methods for HLA-A and HLA-C. The number of subjects correctly imputed across all four loci is shown at the bottom of Table 1. Fewer than 27.8% of subjects were correctly imputed by any method. As illustrated in Supplementary Figure 2, only 77 (9.4%) subjects were correctly imputed by all four methods, and 51 (6.3%) subjects were correctly imputed by only one method. The call rates at which 50% of correctly imputed subjects remain for each method (21.2%, e-HLA; 25.5%, HIBAG; 12.1%, HLA*IMP:02; and 25%, MAGPrediction) decrease in step with the percentage of correctly imputed subjects, as illustrated in Figure 3, wherein the percentage of correctly imputed subjects decreases with call rate, as IA increases. HIBAG generated more correct imputations than the other methods, but over a larger range of confidence values. Regardless of the method applied, confidence values serve as unreliable predictors of correct four-locus imputations.
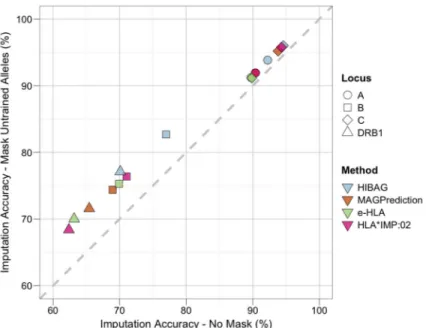
To examine the extent to which variation in IA between loci results from the presence of HLA alleles in the evaluation dataset that were absent from the reference dataset (untrained alleles), subjects with untrained alleles were removed on a per locus basis and IA was recalculated. As illustrated in Figure 4, the locus specific changes in IA (ΔIA) were smallest for HLA-C (max ΔIA 1.5%), followed by HLA-A (max ΔIA 1.6%), and were largest for HLA-DRB1 (max ΔIA 7%), followed by HLA-B (max ΔIA 5.7%). On average, the change in IA was 3.7% across all loci, suggesting that untrained alleles were not a major factor in the overall IA.
Imputation Accuracy within Ancestries
The HGDP subjects were stratified into nine broad categories of continental origin (sub-Saharan Africa, North Africa, Europe, Southwest Asia, Southeast Asia, Oceania, Northeast Asia, North America and South America) to investigate variation in IA between samples from different world regions27. Table 2 summarizes IA within these continental origin categories for each method and locus. Relative to the locus-specific median, IA values for sub-Saharan Africa and Oceania were consistently lower across all loci, while IA values for Northeast Asia were consistently higher. For individual loci, IA values for North America, Oceania, and South America were lowest across all methods for HLA-A (max IA 83.9%, 81.5%, 81.0%, 88.0% respectively) and HLA-B (max IA 59.7%, 48.1%, 39.7%
respectively). IA values for Oceania were lowest for HLA-C (max IA 87%), while IA values for North America and South America were lowest for HLA-DRB1 (max IA 30.6% and 39.7%, respectively). Interestingly, despite the absence of North African and Southwest Asian individuals in the reference dataset, IA for these regions was higher than the locus specific median.
A
uthor Man
uscr
ipt
A
uthor Man
uscr
ipt
A
uthor Man
uscr
ipt
A
uthor Man
uscr
ipt
Application of Multiple Methods
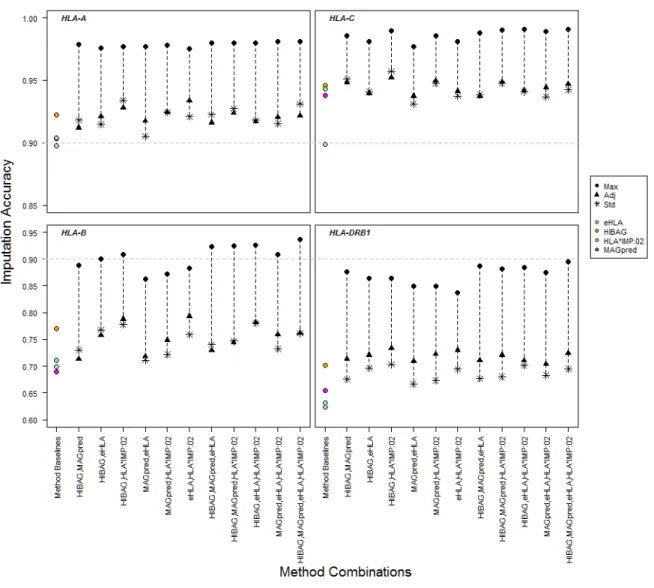
The potential for imputation improvement through the application of multiple methods is illustrated in Figure 5. Although, the maximum possible IA for all combinations of methods is consistently higher than for any individual method (e.g. 99.1% Max IA for HLA-C across all four methods), adjudicated IA values surpass individual method IAs by ~2% for all loci but HLA-DRB1, where with the maximum adjudicated improvement for HIBAG
+HLA*IMP:02 is 3.2%.
The relationship between inter-method imputation agreement and the likelihood of a correct call at individual loci is illustrated in Supplementary Figure 3. Higher inter-method
prediction agreement was associated with higher score (i.e., number of correct imputations) and higher IA frequency. However, the frequency of agreement differed across loci (S3 Figure, red line). Agreement between all methods was less frequent for B and HLA-DRB1 (~40%), and in the case of HLA-HLA-DRB1, total agreement was associated with large variations in scores. Average IA within each method agreement category differed between loci, with IA for subjects with no inter-method agreement lowest for HLA-DRB1 (35%) and highest for HLA-C (47%). In cases where all methods agreed, IA is consistent with Figure 2 (HLA-A, 94.4%; HLA-C, 96.4%; HLA-B, 88.6%; HLA-DRB1, 76.5%), indicating greater agreement between methods at lower call rates.
Imputation using Different Developmental Versions
The developers of HIBAG and HLA:IMP*02 opted to provide updated imputations, reflecting continued development of their methods. Supplementary Figure 4 details the imputation performance for both the legacy (initial submission) and the current versions of these methods. The updated imputation using HIBAG (v1.3) did not differ significantly from initial submission (p = 0.89). However, of the two sets of updated HLA:IMP*02 imputations (“-v2 standard” and “-v2 fast”), only “-v2 fast” demonstrated an increase in performance over the legacy version (p = 0.0013). For HLA*IMP:02-v2 fast, HLA-B demonstrated the greatest increase in performance relative to other loci, as illustrated in Supplementary Figure 5.
Discussion
Given the importance of the HLA genes in disease association and drug induced hypersensitivity reactions1–5, 13, and the abundance of SNP associations identified on chromosome 6p21 through GWAS, an in-depth investigation of HLA polymorphism is often warranted in disease association studies. Prediction of HLA genotypes through imputation from SNP data has been applied as an alternative to molecular HLA genotyping28, especially in cohorts where chromosome 6 SNP data are already available. However, a detailed
assessment of an imputation methods’ accuracy across a global selection of disparate populations has not been undertaken. In this study, the capacity of e-HLA, HIBAG,
HLA*IMP:02 and MAGPrediction to correctly impute HLA genotypes at the A, HLA-B, HLA-C and HLA-DRB1 loci was assessed in the HGDP subjects, using the 1000G as a training dataset. This is the first comprehensive comparison of multiple HLA genotype
A
uthor Man
uscr
ipt
A
uthor Man
uscr
ipt
A
uthor Man
uscr
ipt
A
uthor Man
uscr
ipt
imputation methods across a wide range of populations, using large, well-characterized cohorts.
The accuracy of HLA allele imputation for the four most polymorphic and commonly investigated HLA loci (HLA-A, HLA-C, HLA-B, and HLA-DRB1) varied more with respect to locus than with the method applied. When considering all predictions (100% call rate), imputation was most accurate for HLA-C, with IAs exceeding 89%, followed by HLA-A. HLA-DRB1 and HLA-B were the most difficult to impute across all methods, with IAs below 80%. That HLA-B proved difficult to impute is perhaps not surprising, as this is the most polymorphic HLA locus29. However, HLA-DRB1 is less polymorphic than either HLA-A or HLA-C, suggesting that variation is not necessarily the primary obstacle to accurate imputation.
Studies involving three of the methods evaluated here have also indicated HLA-DRB1 as being difficult to impute17–19. A recent comparison of sequence-based HLA genotyping with imputation of HLA-DRB1 alleles using HLA*IMP30, HLA*IMP:02, and SNP2HLA8 (withdrawn from this study) in a small Finnish cohort also found accuracy rates to be very low (< 30%) for this locus31. HLA-DRB1 imputation also demonstrated the lowest concordance with sequence-based genotyping in an association study of Parkinson Disease and HLA polymorphism in the NeuroGenetics Research Consortium dataset32. IA for this locus was also low in study of HIBAG imputation in the ethnically and racially diverse Women’s Interagency HIV Study (WIHS) cohort33. It is possible that the SNPs in these studies did not sufficiently tag HLA-DRB1 allele or sequence variation.
As illustrated in Supplementary Figure 6, DRB1 imputation accuracy in the ImmPute study was dependent on the DRB haplotype. Subjects with HLA-DRB1 alleles on the DR8 haplotype were most difficult to impute. This haplotype consists of the non-polymorphic DRA gene, DRB1 alleles in the DRB1*08 allele family and the HLA-DRB9 pseudogene, and may have been generated in a contraction of the DR52 haplotype resulting in the deletion of >60KB of DNA between the HLA-DRB1 and HLA-DRB3 genes34, 35. Traherne et al (2006) have described a “SNP desert” on the DR52 haplotype extending from HLA-DRB3 to HLA-DQB336. Gene content variation between DRB haplotypes may result in increased missing SNP rates and the systematic exclusion of DRB SNPs from panels during quality control evaluation, creating an effective SNP desert around DRB1.
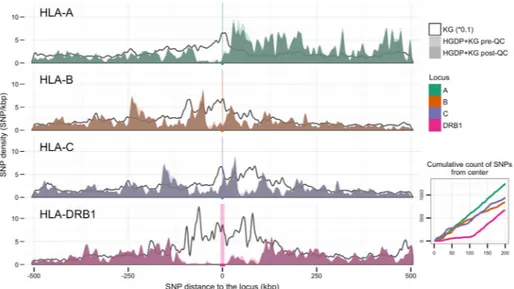
Figure 6 illustrates the distribution of the SNPs included in this study relative to the HLA-A, HLA-B, HLA-C, and HLA-DRB1 genes. Significantly fewer SNPs occur within 100 kb of the HLA-DRB1 locus relative to the class I loci. An effective SNP desert surrounding the HLA-DRB1 locus derives not from the absence of HLA-DRB1 SNPs in the genome, but from the absence of proximal HLA-DRB1 SNPs on the immunoChip and Illumina 650Y panels. As shown in Supplementary Figure 7, this SNP desert is also present on the Affymetrix Genome-Wide Human SNP Array 6.0 release 35 and the Illumina
InfiniumOmniExpress-24 version 1.2 Array. This absence of informative SNPs contributes to lower HLA-DRB1 imputation performance, and suggests that the reassessment of SNP ascertainment in panel design, allowing the detection of structural variants in the DRB
A
uthor Man
uscr
ipt
A
uthor Man
uscr
ipt
A
uthor Man
uscr
ipt
A
uthor Man
uscr
ipt
region, may improve HLA-DRB1 imputation accuracy. Imputation concordance rates have been shown to be higher for SNP test datasets generated using genotyping platforms with higher SNP densities, as well as through increased numbers of reference SNPs37, 38. Chromosomes with highly similar SNP patterns have been observed to carry different HLA alleles39, so that SNP patterns across the HLA region may be generally difficult to
distinguish. The SNPs included in the reference dataset were extracted from genomic sequence data rather than determined using established SNP genotyping methods; however, many more genomic SNPs were identified than were detectable with the applied SNP typing panels (Fig 6), and comparison of these extracted SNP data to HapMap40 data for a subset of the same cohort, revealed minimal discrepancies (see Supplementary Information).
HLA imputation accuracy may also be diminished by the multi-population, multi-regional nature of the 1000G and HGDP collections; however, while the HGDP is a much more diverse sample than the 1000G, both capture the same variation (Supplementary Figure 8). In these cases, accuracy is challenged by the extent to which the reference data reflect the diversity and patterns of linkage disequilibrium in the populations being tested30. Such variation can affect performance and is a function of the underlying SNP framework, with its history of recombination, mutation, natural selection, genetic drift and gene flow30.
Individual HLA alleles have been observed on diverse SNP frameworks across populations15, and multi-locus HLA haplotypes have been shown to be geographically restricted41, posing challenges for imputation when there is low population-level correspondence between reference and testing datasets. These challenges are evident in Table 2, where sub-Saharan African and Oceanian IA was consistently below locus-specific median values; Oceanian populations were not represented in the training dataset, whereas sub-Saharan African populations display the highest levels of genetic diversity in the human species, reducing the likelihood of correspondence between the training and testing datasets for these populations. These challenges can be addressed through the public availability of large reference datasets representing an ethnically diverse selection of populations.
Further to this point, SNP ascertainment has primarily been conducted in European cohorts, and most HLA imputation studies have been performed in cohorts of European ancestry as well. However, clinical use cases for HLA imputation (e.g., patients seeking transplants from potential donors in unrelated donor registries) are likely more cosmopolitan. Of the methods evaluated in this study, only HIBAG and HLA*IMP:02 have been developed using multi-population datasets17, 19. Hsieh et al (2014) imputed HLA alleles in Han Chinese using MAGprediction, and found a generally high concordance between imputation and molecular HLA genotyping for A and C, but poor concordance with B and HLA-DRB1 using ancestry specific reference panels38. Similarly, Kuniholm et al. (2016) found higher concordance between HIBAG imputation and molecular HLA genotyping for HLA-A and -C than for HLA-B and –DRB1 in the ethnically diverse WIHS cohort33. Pillai et al. (2014) compared SNP2HLA predictions to molecular HLA genotyping for the Singapore Genome Variation Project (SVGP) in southern Han Chinese, Southeast Asian Malays and Tamil Indians42. Using ethnic-specific reference panels, they reported similarly poor performance for HLA-B and HLA-DRB1. However, by combining the SGVP and International HapMap Project42 reference panels, they were able to markedly increase
A
uthor Man
uscr
ipt
A
uthor Man
uscr
ipt
A
uthor Man
uscr
ipt
A
uthor Man
uscr
ipt
prediction performance for these two loci. Khor et al. (2015) developed specific custom classifiers for the Japanese population, and applied these in HIBAG to achieve high IAfor high-risk class II haplotypes in Japenese narolepsy patients43. Similarly, Levin et al. (2014) improved HIBAG IA, relative to that of HLA*IMP:02, in African Americans by applying models reflecting the African and European ancestry of this population44.
As illustrated in Figure 5, the application of multiple imputation methods has the potential for large increases in IA, relative to individual methods. However, as they are currently generated, confidence scores cannot be effectively applied across methods to realize this potential. Only in the case of HLA-DRB1 did the application of confidence scores across methods result in a marked improvement in IA. Confidence thresholding may serve as an attractive option for increasing imputation accuracy for an individual method, at the expense of call rates. However, the derivation of the confidence values is unique to the method and cannot be reliably compared across methods or HLA loci. Because they are calculated differently and thus have different meanings, no single threshold can be applied to obtain commensurate IAs, and normalization of confidence values across methods does not improve their utility. Moreover, confidence metrics did not reliably correlate with IA, especially for HLA-B and HLA-DRB1. Continued increases in the confidence threshold increased the likelihood of dropping correct imputations as demonstrated by the asymptotic nature of the performance curves, and combined four-locus confidence scores correlated poorly with correctly imputed subjects. Care should be exercised when considering where to set a confidence threshold for imputation of HLA genotypes, and the associated call rate should be reported for reliable comparison. Overall, this poor correlation between IA and confidence metrics stems from both the application of nonstandard confidence values across methods, and the mechanisms by which HLA diversity is generated and maintained. While LD is high across the MHC, recombination within HLA genes, recombination hotspots between HLA genes, selection for novel polymorphisms, and high HLA heterozygosity will degrade the utility of intergenic SNPs for imputing HLA genotypes45–47. All these
mechanisms have posed challenges for molecular HLA genotyping, and they suggest that the application of rare and tagging SNPs is not likely to improve IA39, and that HLA imputation is unlikely to accurately predict the presence of rare HLA alleles. Rather than considering confidence scores, consensus predictions from multiple methods may ensure the most reliable, accurate imputation results, in particular for HLA-A, HLA-B, and HLA-C. To realize the full potential of HLA imputation, the burden may be placed on method developers to devise prediction confidence ratings that can be applied across methods. The prediction accuracies reported in this study may be considered to be over-estimates when the total diversity of allelic HLA polymorphism is considered. The number of HLA alleles identified in the 1000G and HGDP datasets is a fraction of the number of alleles in the IMGT/HLA Database29, a number that is likely to increase every three months for the foreseeable future48, although most of these alleles have been reported only once49. In addition, imputation scoring was generous in that matching was evaluated both for individual alleles and for the members of P and G groups (see Methods for definition). Perhaps most importantly, the imputation results reported here are based on restricted reference and testing datasets. Larger, multi-population, multi-ancestry reference datasets would be required to successfully predict a larger proportion of observed HLA alleles19, 37.
A
uthor Man
uscr
ipt
A
uthor Man
uscr
ipt
A
uthor Man
uscr
ipt
A
uthor Man
uscr
ipt
Klitz et al. (2012) have estimated that millions of distinct HLA alleles are maintained in the human population48, with many combinations of alleles present in population-specific haplotypes41. Suitable reference datasets appropriate for HLA imputation at these levels may prove elusive, as earlier studies have suggested that at least ten copies of an allele may be required in a reference dataset for accurate imputation39.
Finally, the improvement in performance for the second round of HLA*IMP:02 imputation underscores the importance of applying the most up-to-date version of a method for HLA imputation. Imputation method developers leverage programming innovations, larger, more comprehensive reference datasets and enhanced knowledge of the genomics of the HLA region to ensure a robust algorithm that maximizes imputation accuracy.
Conclusions
Accurate determination of classical HLA allele genotypes is critical for clinical applications such as transplantation and important for enabling association studies to uncover the genetic risk of complex diseases. While HLA-A and HLA-C imputation remains a tractable option for research, our results strongly suggest that further development will be necessary before such cost-effective methods should be considered suitable for all HLA loci in both the research and clinical settings.
Supplementary Material
Refer to Web version on PubMed Central for supplementary material.
Acknowledgments
We thank Janelle Noble, Marc Salit and P. Scott Pine for helpful discussions and Abeer Madbouly for assistance with the PCA plots. The content is solely the responsibility of the authors and does not necessarily represent the official views of the National Institutes of Health (NIH), National Institute of Allergy and Infectious Diseases (NIAID), National Institute of General Medical Sciences (NIGMS), National Institute of Neurological Disorders and Stroke (NINDS), National Multiple Sclerosis Society (NMSS), Office of Naval Research (ONR) or United States Government. This work was supported by ONR grant N00014-08-1-1207 (KB, DP, PAG, JAH, AL, SJM, MM and VP), NIH grants U01AI067068 (JAH and SJM) and U19AI067152 (ARRA administrative supplement) (PAG) awarded by the NIAID, R01GM109030 (JAH, SJM and DJP) and P01GM099568 (XZ) awarded by the NIGMS, RO1NS076492 (PAG), RO1NS046297 (PAG) and R01NS049477 (PAG) awarded by the NINDS, NMSS grant RG 2899-D11 (PAG), the Australian National Health and Medical Research Council (NHMRC) Career Development Fellowship ID 1053756 (SL), and by the Victorian Life Sciences Computation Initiative (VLSCI) grant number VR0240 on its Peak Computing Facility at the University of Melbourne, an initiative of the Victorian Government, Australia (SL). Research at the Murdoch Childrens Research Institute was supported by the Victorian Government’s Operational Infrastructure Support Program. PAG is a recipient of the Race to Erase MS Junior Investigator Award and the European Federation for Immunogenetics Julia Bodmer Award. We thank President Barack H. Obama for his support and appreciation of American science and basic research.
References
1. Welter D, MacArthur J, Morales J, Burdett T, Hall P, Junkins H, et al. The NHGRI GWAS Catalog, a curated resource of SNP-trait associations. Nucleic Acids Res. 2014; 42(Database issue):D1001– 1006. [PubMed: 24316577]
2. Martin AM, Nolan D, Gaudieri S, Almeida CA, Nolan R, James I, et al. Predisposition to abacavir hypersensitivity conferred by HLA-B*5701 and a haplotypic Hsp70-Hom variant. Proc Natl Acad Sci U S A. 2004; 101(12):4180–4185. [PubMed: 15024131]
A
uthor Man
uscr
ipt
A
uthor Man
uscr
ipt
A
uthor Man
uscr
ipt
A
uthor Man
uscr
ipt
3. Mallal S, Nolan D, Witt C, Masel G, Martin AM, Moore C, et al. Association between presence of HLA-B*5701, HLA-DR7, and HLA-DQ3 and hypersensitivity to HIV-1 reverse-transcriptase inhibitor abacavir. Lancet. 2002; 359(9308):727–732. [PubMed: 11888582]
4. Hung SI, Chung WH, Liou LB, Chu CC, Lin M, Huang HP, et al. HLA-B*5801 allele as a genetic marker for severe cutaneous adverse reactions caused by allopurinol. Proc Natl Acad Sci U S A. 2005; 102(11):4134–4139. [PubMed: 15743917]
5. McCormack M, Alfirevic A, Bourgeois S, Farrell JJ, Kasperaviciute D, Carrington M, et al. HLA-A*3101 and carbamazepine-induced hypersensitivity reactions in Europeans. N Engl J Med. 2011; 364(12):1134–1143. [PubMed: 21428769]
6. Pavlos R, Mallal S, Phillips E. HLA and pharmacogenetics of drug hypersensitivity. Pharmacogenomics. 2012; 13(11):1285–1306. [PubMed: 22920398]
7. Erlich H. HLA DNA typing: past, present, and future. Tissue Antigens. 2012; 80(1):1–11. [PubMed: 22651253]
8. Jia X, Han B, Onengut-Gumuscu S, Chen WM, Concannon PJ, Rich SS, et al. Imputing amino acid polymorphisms in human leukocyte antigens. PLoS One. 2013; 8(6):e64683. [PubMed: 23762245] 9. Hirschhorn JN, Daly MJ. Genome-wide association studies for common diseases and complex traits.
Nat Rev Genet. 2005; 6(2):95–108. [PubMed: 15716906]
10. McCarthy MI, Abecasis GR, Cardon LR, Goldstein DB, Little J, Ioannidis JP, et al. Genome-wide association studies for complex traits: consensus, uncertainty and challenges. Nat Rev Genet. 2008; 9(5):356–369. [PubMed: 18398418]
11. de Bakker PI, Raychaudhuri S. Interrogating the major histocompatibility complex with high-throughput genomics. Hum Mol Genet. 2012; 21(R1):R29–36. [PubMed: 22976473]
12. Traherne JA. Human MHC architecture and evolution: implications for disease association studies. Int J Immunogenet. 2008; 35(3):179–192. [PubMed: 18397301]
13. Fernando MM, Stevens CR, Walsh EC, De Jager PL, Goyette P, Plenge RM, et al. Defining the role of the MHC in autoimmunity: a review and pooled analysis. PLoS Genet. 2008; 4(4):e1000024. [PubMed: 18437207]
14. Moore JH, Asselbergs FW, Williams SM. Bioinformatics challenges for genome-wide association studies. Bioinformatics. 2010; 26(4):445–455. [PubMed: 20053841]
15. de Bakker PI, McVean G, Sabeti PC, Miretti MM, Green T, Marchini J, et al. A high-resolution HLA and SNP haplotype map for disease association studies in the extended human MHC. Nat Genet. 2006; 38(10):1166–1172. [PubMed: 16998491]
16. Malkki M, Single R, Carrington M, Thomson G, Petersdorf E. MHC microsatellite diversity and linkage disequilibrium among common HLA-A, HLA-B, DRB1 haplotypes: implications for unrelated donor hematopoietic transplantation and disease association studies. Tissue Antigens. 2005; 66(2):114–124. [PubMed: 16029431]
17. Zheng X, Shen J, Cox C, Wakefield JC, Ehm MG, Nelson MR, et al. HIBAG-HLA genotype imputation with attribute bagging. Pharmacogenomics J. 2013; 14(2):192–200. [PubMed: 23712092]
18. Li SS, Wang H, Smith A, Zhang B, Zhang XC, Schoch G, et al. Predicting multiallelic genes using unphased and flanking single nucleotide polymorphisms. Genet Epidemiol. 2011; 35(2):85–92. [PubMed: 21254215]
19. Dilthey A, Leslie S, Moutsianas L, Shen J, Cox C, Nelson MR, et al. Multi-population classical HLA type imputation. PLoS Comput Biol. 2013; 9(2):e1002877. [PubMed: 23459081] 20. Cann HM, de Toma C, Cazes L, Legrand MF, Morel V, Piouffre L, et al. A human genome
diversity cell line panel. Science. 2002; 296(5566):261–262. [PubMed: 11954565]
21. Abecasis GR, Auton A, Brooks LD, DePristo MA, Durbin RM, Handsaker RE, et al. An integrated map of genetic variation from 1,092 human genomes. Nature. 2012; 491(7422):56–65. [PubMed: 23128226]
22. Parkes M, Cortes A, van Heel DA, Brown MA. Genetic insights into common pathways and complex relationships among immune-mediated diseases. Nat Rev Genet. 2013; 14(9):661–673. [PubMed: 23917628]
23. Danecek P, Auton A, Abecasis G, Albers CA, Banks E, DePristo MA, et al. The variant call format and VCFtools. Bioinformatics. 2011; 27(15):2156–2158. [PubMed: 21653522]
A
uthor Man
uscr
ipt
A
uthor Man
uscr
ipt
A
uthor Man
uscr
ipt
A
uthor Man
uscr
ipt
24. Gourraud PA, Khankhanian P, Cereb N, Yang SY, Feolo M, Maiers M, Rioux JD, Hauser S, Oksenberg J. HLA diversity in the 1000 genomes dataset. PLoS One. 2014 Jul 2.9(7):e97282. [PubMed: 24988075]
25. Erlich H, Bugawan T, Begovich AB, Scharf S, Griffith R, Saiki R, et al. HLA-DR, DQ and DP typing using PCR amplification and immobilized probes. Eur J Immunogenet. 1991; 18(1–2):33– 55. [PubMed: 2069944]
26. Marsh SG, Albert ED, Bodmer WF, Bontrop RE, Dupont B, Erlich HA, et al. Nomenclature for factors of the HLA system, 2010. Tissue Antigens. 2010; 75(4):291–455. [PubMed: 20356336] 27. Mack, SJS-MA., Meyer, D., Single, RM., Tsai, Y., Erlich, HA. Methods used in the generation and
preparation of data for analysis in the 13th International Histocompatibility Work- shop; Seattle, WA: IHWG Press; 2007.
28. Frangoul H, Crowe D. Cost saving associated with implementing a stepwise approach to HLA typing of related donors before hematopoietic SCT. Bone Marrow Transplant. 2014; 49(6):850– 851. [PubMed: 24566707]
29. Robinson J, Halliwell JA, McWilliam H, Lopez R, Parham P, Marsh SG. The IMGT/HLA database. Nucleic Acids Res. 2013; 41(Database issue):D1222–1227. [PubMed: 23080122] 30. Dilthey AT, Moutsianas L, Leslie S, McVean G. HLA*IMP--an integrated framework for imputing
classical HLA alleles from SNP genotypes. Bioinformatics. 2011; 27(7):968–972. [PubMed: 21300701]
31. Vlachopoulou E, Lahtela E, Wennerstrom A, Havulinna AS, Salo P, Perola M, et al. Evaluation of HLA-DRB1 imputation using a Finnish dataset. Tissue Antigens. 2014; 83(5):350–355. [PubMed: 24666112]
32. Wissemann WT, Hill-Burns EM, Zabetian CP, Factor SA, Patsopoulos N, Hoglund B, et al. Association of Parkinson disease with structural and regulatory variants in the HLA region. Am J Hum Genet. 2013; 93(5):984–993. [PubMed: 24183452]
33. Kuniholm MH, Xie X, Anastos K, Xue X, Reimers L, French AL, et al. Human leucocyte antigen class I and II imputation in a multiracial population. Int J Immunogenet. 2016; 43(6):369–375. [PubMed: 27774761]
34. Andersson G. Evolution of the human HLA-DR region. Front Biosci. 1998; 3:d739–745. [PubMed: 9675159]
35. Gorski J. The HLA-DRw8 lineage was generated by a deletion in the DR B region followed by first domain diversification. J Immunol. 1989; 142(11):4041–4045. [PubMed: 2785571]
36. Traherne JA, Horton R, Roberts AN, Miretti MM, Hurles ME, Stewart CA, et al. Genetic analysis of completely sequenced disease-associated MHC haplotypes identifies shuffling of segments in recent human history. PLoS Genet. 2006; 2(1):e9. [PubMed: 16440057]
37. Zhang XC, Li SS, Wang H, Hansen JA, Zhao LP. Empirical evaluations of analytical issues arising from predicting HLA alleles using multiple SNPs. BMC Genet. 2011; 12:39. [PubMed: 21518453] 38. Hsieh AR, Chang SW, Chen PL, Chu CC, Hsiao CL, Yang WS, et al. Predicting HLA genotypes
using unphased and flanking single-nucleotide polymorphisms in Han Chinese population. BMC Genomics. 2014; 15:81. [PubMed: 24476119]
39. Leslie S, Donnelly P, McVean G. A statistical method for predicting classical HLA alleles from SNP data. Am J Hum Genet. 2008; 82(1):48–56. [PubMed: 18179884]
40. Thorisson GA, Smith AV, Krishnan L, Stein LD. The International HapMap Project Web site. Genome Res. 2005; 15(11):1592–1593. [PubMed: 16251469]
41. Single, RM., Meyer, D., Mack, SJ., Lancaster, A., Nelson, MP., Fernández-Viña, M., Erlich, HA., Thomson, G. Haplotype Frequencies and Linkage Disequilibrium among classical HLA genes. Vol. 1. IHWG Press; Seattle, WA: 2007.
42. Pillai NE, Okada Y, Saw WY, Ong RT, Wang X, Tantoso E, et al. Predicting HLA alleles from high-resolution SNP data in three Southeast Asian populations. Hum Mol Genet. 2014; 23(16): 4443–4451. [PubMed: 24698974]
43. Khor SS, Yang W, Kawashima M, Kamitsuji S, Zheng X, Nishida N, et al. High-accuracy imputation for HLA class I and II genes based on high-resolution SNP data of population-specific references. Pharmacogenomics J. 2015; 15(6):530–537. [PubMed: 25707395]
A
uthor Man
uscr
ipt
A
uthor Man
uscr
ipt
A
uthor Man
uscr
ipt
A
uthor Man
uscr
ipt
44. Levin AM, Adrianto I, Datta I, Iannuzzi MC, Trudeau S, McKeigue P, et al. Performance of HLA allele prediction methods in African Americans for class II genes HLADRB1, DQB1, and -DPB1. BMC Genet. 2014; 15:72. [PubMed: 24935557]
45. Sasazuki T, Inoko H, Morishima S, Morishima Y. Gene Map of the HLA Region, Graves’ Disease and Hashimoto Thyroiditis, and Hematopoietic Stem Cell Transplantation. Adv Immunol. 2016; 129:175–249. [PubMed: 26791860]
46. Begovich AB, McClure GR, Suraj VC, Helmuth RC, Fildes N, Bugawan TL, et al. Polymorphism, recombination, and linkage disequilibrium within the HLA class II region. J Immunol. 1992; 148(1):249–258. [PubMed: 1727870]
47. Solberg OD, Mack SJ, Lancaster AK, Single RM, Tsai Y, Sanchez-Mazas A, et al. Balancing selection and heterogeneity across the classical human leukocyte antigen loci: a meta-analytic review of 497 population studies. Hum Immunol. 2008; 69(7):443–464. [PubMed: 18638659] 48. Klitz W, Hedrick P, Louis EJ. New reservoirs of HLA alleles: pools of rare variants enhance
immune defense. Trends Genet. 2012; 28(10):480–486. [PubMed: 22867968]
49. Mack SJ, Cano P, Hollenbach JA, He J, Hurley CK, Middleton D, et al. Common and well-documented HLA alleles: 2012 update to the CWD catalogue. Tissue Antigens. 2013; 81(4):194– 203. [PubMed: 23510415]
A
uthor Man
uscr
ipt
A
uthor Man
uscr
ipt
A
uthor Man
uscr
ipt
A
uthor Man
uscr
ipt
Figure 1. Statistical Significance of Imputation Accuracy across Loci and Methods
Statistical significance of imputation accuracy (IA) across loci and methods was assessed using a logistic regression model, as detailed in the Supplementary Information. Odds ratios and their confidence intervals are plotted relative to IA for a locus or method predictor, for all HGDP subjects, as informed by the model. HLA-A was selected as the predictor for locus comparisons, and e-HLA for method comparisons.
A
uthor Man
uscr
ipt
A
uthor Man
uscr
ipt
A
uthor Man
uscr
ipt
A
uthor Man
uscr
ipt
Figure 2. Locus-level Imputation Performance
Imputation accuracy (IA) was assessed at different call rates by iterative application of a confidence value threshold and recalculation of the IA. Confidence value thresholds were derived from the unique list of confidence values reported for each allele or genotype. Line length was a function of the lowest reported confidence value (only non-zero call-rates are graphed). Each panel corresponds to a different locus (HLA-A, -B, -C, and -DRB1). Color corresponds to method: blue, e-HLA; orange, HIBAG; green, HLA*IMP:02; magenta, MAGprediction. For comparison, the 90% IA (gray dotted line) and the 0.5 confidence thresholds (diamonds) for each imputation are indicated. Only non-zero accuracies are graphed. For e-HLA and HLA*IMP:02, the distribution of confidence values was small compared to HIBAG and MAGPrediction and results in line termination at higher call-rates. Different IA scales are presented for HLA-A and -C than for -B and -DRB1.
A
uthor Man
uscr
ipt
A
uthor Man
uscr
ipt
A
uthor Man
uscr
ipt
A
uthor Man
uscr
ipt
Figure 3. Subject-level Imputation Performance
For each method evaluated, two different imputation accuracy (IA) measures are plotted for each call rate (x-axis) at the subject-level; only subjects for which the imputations at all four loci are correct are scored as accurate. “Subset Accuracy”, the percentage of correctly imputed subjects at each call rate threshold (dashed lines), as presented for individual loci in Figure 2, is plotted alongside “Global Accuracy”, the percentage of subjects out of the total dataset that are correctly imputed for each call rate threshold (solid lines). Color corresponds to method: blue, e-HLA; orange, HIBAG; green, HLA*IMP:02; magenta, MAGprediction.
A
uthor Man
uscr
ipt
A
uthor Man
uscr
ipt
A
uthor Man
uscr
ipt
A
uthor Man
uscr
ipt
Figure 4. Imputation Accuracy when Masking Untrained Alleles
Imputation accuracy (IA) was assessed for each locus and method before and after removing carriers of untrained HLA alleles (i.e., not present in the reference dataset). HGDP subjects carrying one or two untrained HLA alleles were removed (masked) and IA recalculated on the remaining subjects, for which all alleles were present in the reference dataset. The diagonal represents identical IA between masked and unmasked evaluation datasets. Changes in IA resulted in a shift from the diagonal. Shape corresponds to locus: circle, HLA-A; square, -B; diamond, -C; triangle, -DRB1. Color corresponds to method: blue, e-HLA; orange, HIBAG; green, HLA*IMP:02; magenta, MAGprediction.
A
uthor Man
uscr
ipt
A
uthor Man
uscr
ipt
A
uthor Man
uscr
ipt
A
uthor Man
uscr
ipt
Figure 5. Maximum, Adjudicated and Standardized Imputation Accuracies in Method Combinations
At each locus, and for each combination of two, three and four methods, the difference between the maximum imputation accuracy (IA), the adjudicated IA, and the standardized IA is shown in comparison to the overall IA for each method (Method Baselines). Maximum IA was calculated over all HGDP subjects by scoring the imputation for a given subject as correct if any of the predictions in a given combination of methods was accurate.
Adjudicated IA was calculated over all HGDP subjects by choosing the prediction with the highest confidence score from among the predictions in a given combination of methods for each subject, and then comparing that prediction to the evaluation dataset for accuracy. Standardized IA was calculated over all HGDP subjects by normalizing the confidence score distributions for each method and then choosing the highest confidence score as for
Adjudicated IA. Ninety percent IA is indicated with the dotted line. The y-axis for HLA-A and -C uses a different scale than the y-axis for -B and -DRB1. Solid shapes correspond types of IA scores: circle, maximum IA score (Max); triangle, adjudicated IA score (Adj); asterisk, standardized IA (Std). Color corresponds to method: blue, e-HLA; orange, HIBAG;
A
uthor Man
uscr
ipt
A
uthor Man
uscr
ipt
A
uthor Man
uscr
ipt
A
uthor Man
uscr
ipt
green, HLA*IMP:02; magenta, MAGprediction. Each panel corresponds to a different locus -- HLA-A, -B, -C, and -DRB1. For DRB1, the overall IA values for e-HLA and HLA*IMP: 02 overlap.
A
uthor Man
uscr
ipt
A
uthor Man
uscr
ipt
A
uthor Man
uscr
ipt
A
uthor Man
uscr
ipt
Figure 6. SNP Proximity and Density for the HLA-A, -B, -C and DRB1 Loci
Primary Panel. The density of SNPs (ranging from 0–12) within 500,000 bases of the HLA-A, -B, -C and -DRB1 loci is shown. A distance of 0 indicates the location of each respective gene. Negative distances are telomeric of the gene in question; positive distances are centromeric. Bold line: Proximal subsets of the 164,876 SNPs present in the 1000G dataset, prior to merging with the HGDP dataset. Light shaded area: SNPs present after the merger of the 1000G and HGDP datasets (merged SNPs), prior to quality control (QC) evaluation. Dark shaded area: merged SNPs remaining after QC evaluation. Inset Panel: The cumulative number of SNPs, out of the 10,268 SNPs included in this study, within 200,000 bases of the HLA-A, -B, -C, and –DRB1 loci is shown. Color corresponds to locus: green, HLA-A; orange, HLA-B, purple; HLA-C; magenta, HLA-DRB1.
A
uthor Man
uscr
ipt
A
uthor Man
uscr
ipt
A
uthor Man
uscr
ipt
A
uthor Man
uscr
ipt
A
uthor Man
uscr
ipt
A
uthor Man
uscr
ipt
A
uthor Man
uscr
ipt
A
uthor Man
uscr
ipt
Table 1 Imputation Accuracy Across Imputation MethodsMethod e-HLA HIBAG HLA*IMP:02 MAGPrediction Imputation Overall Accuracy
A 1592 (89.7) 1636 (92.2) 1604 (90.4) 1603 (90.4) B 1236 (69.9) 1361 (77) 1256 (71) 1219 (69) C 1594 (89.9) 1678 (94.6) 1673 (94.3) 1664 (93.8) DRB1 1031 (63.2) 1144 (70.1) 1018 (62.4) 1068 (65.4) Match 0, 1, 2 Alleles† A 23, 136, 728 20, 98, 769 21, 128, 738 18, 135, 734 B 111, 310, 463 66, 275, 543 95, 322, 467 131, 287, 466 C 25, 130, 732 9, 78, 800 9, 83, 795 16, 78, 793 DRB1 133, 335, 348 89, 310, 417 132, 350, 334 113, 338, 365 Correct Individuals‡ All Loci 145 (18) 224 (27.8) 139 (17.2) 161 (20) †
Parenthetical values are percentages. For match percentages, see Supplementary Table 2 ‡
4-locus (HLA-A, -C, -B and -DRB1) genotypes were available for 807 HGDP subjects. Correct Subjects are defined as having both alleles at each of these loci correctly imputed.
A
uthor Man
uscr
ipt
A
uthor Man
uscr
ipt
A
uthor Man
uscr
ipt
A
uthor Man
uscr
ipt
T ab le 2 Imputation Accurac y across Global Re gions Ancestry 1000G (T raining) N HGDP (T esting) N HLA-A HLA-C e-HLA HIB A G HLA*IMP:02 MA G Pr ediction e-HLA HIB A G HLA*IMP:02 MA G Pr ediction SSA 178 100 87.0% 88.0% 84.0% 86.0% 82.5% 94.0% 93.5% 92.0% N AF 0 29 96.6% 96.6% 87.9% 96.6% 98.3% 98.3% 98.3% 100.0% EUR 317 103 89.8% 96.1% 93.7% 91.7% 90.3% 95.6% 96.6% 95.1% SW A 0 312 91.8% 93.3% 93.3% 91.7% 88.0% 92.1% 92.3% 92.0% SEA 185 178 88.8% 91.6% 88.8% 89.9% 90.4% 96.1% 94.9% 95.5% OCE 0 27 81.5% 81.5% 81.5% 79.6% 81.5% 81.5% 87.0% 72.2% NEA 80 80 94.4% 96.9% 95.0% 95.6% 95.0% 96.9% 94.4% 98.8% N AM 110 31 83.9% 83.9% 83.9% 83.9% 98.4% 100.0% 96.8% 98.4% SAM 60 29 70.7% 81.0% 79.3% 79.3% 100.0% 100.0% 100.0% 93.1%Per Locus Method IA
89.7% 92.2% 89.2% 90.4% 89.9% 94.6% 92.7% 93.8% Locus Specif ic Median IA 88.8% 95.1% Ancestry 1000G (T raining) N HGDP (T esting) N HLA-B HLA-DRB1 e-HLA HIB A G HLA*IMP:02 MA G Prediction e-HLA HIB A G HLA*IMP:02 MA G Prediction SSA 178 100 58.5% 69.5% 65.5% 64.0% 42.5% 55.5% 49.5% 53.0% N AF 0 29 65.5% 77.6% 58.6% 55.2% 70.7% 74.1% 58.6% 74.1% EUR 317 103 84.0% 89.3% 83.0% 86.9% 53.4% 59.2% 53.4% 52.9% SW A 0 312 71.5% 78.7% 73.4% 72.8% 68.9% 73.1% 66.8% 68.8% SEA 185 178 69.9% 79.5% 71.1% 70.8% 55.6% 63.2% 54.8% 59.6% OCE 0 27 48.1% 48.1% 37.0% 31.5% 46.3% 64.8% 53.7% 57.4% NEA 80 80 79.4% 86.3% 84.4% 76.9% 65.0% 71.9% 65.6% 65.0% N AM 110 31 59.7% 59.7% 58.1% 37.1% 24.2% 30.6% 17.7% 25.8% SAM 60 29 39.7% 31.0% 31.0% 19.0% 39.7% 31.0% 31.0% 31.0%
Per Locus Method IA
69.9% 77.2% 64.8% 69.0% 63.2% 70.2% 63.0% 65.4% Locus Specif ic Median IA 67.5% 55.6% Bold-Italicized values
indicate imputation accurac
y (IA) less than the Per Locus Method IA (from T
able 1). Color gradient: Red, White, Blue correspond to lo
west v
alue, 50
th percentile, and highest v
alue
within each locus respecti
v
ely
A
uthor Man
uscr
ipt
A
uthor Man
uscr
ipt
A
uthor Man
uscr
ipt
A
uthor Man
uscr
ipt
SSA, sub-Saharan Africa; N
AF
, North Africa; EUR, Europe; SW
A, Southwest Asia; SEA, Southeast Asia; OCE, Oceania; NEA, Northeast Asia; N

![[PDF] Cours Visual Basic avancé : Classes et Modules | Cours informatique](data:image/gif;base64,R0lGODlhAQABAIAAAP///wAAACH5BAEAAAAALAAAAAABAAEAAAICRAEAOw==)