Fuel
Volume 117, Part A, 30 January 2014, Pages 598–607
Coke–pitch interactions during anode preparation
Arunima Sarkara,, Duygu Kocaefea,, Yasar Kocaefea, , Dilip Sarkara, Dipankar Bhattacharyaya, Brigitte Moraisb, Jérôme Chabotb
a University of Quebec at Chicoutimi, Dept. of Applied Sciences, 555, boul. de l’Université, Chicoutimi, Quebec G7H 2B1, Canada
b Aluminerie Alouette Inc., 400, Chemin de la Pointe-Noire, C.P. 1650, Sept-Îles, Quebec G4R 5M9, Canada
Received 4 July 2013, Revised 19 August 2013, Accepted 6 September 2013, Available online 21 September 2013
doi:10.1016/j.fuel.2013.09.015
Highlights
• Study of coke pitch interaction by XPS, FTIR and sessile-drop techniques. • Interactions of three cokes and two pitches were studied.
• Studied calcined coke and coke–pitch by FTIR–DRIFT, not reported in published article.
• Atomic wt% and functional groups present on coke and pitch surfaces analyzed by XPS.
• Wetting was correlated with the functional groups and evidence of reaction found.
Abstract
The information on the interactions between coke and pitch is of great value for the aluminum industry. This information can help choose the suitable coke and pitch pairs as well as the appropriate mixing parameters to be used during the production of anodes. In this study, the interaction mechanisms of pitch and coke at the mixing stage were
petroleum cokes as the substrate. The results showed that the coke–pitch interactions are related to both pitch and coke chemical compositions. The contact angle of different coke–pitch systems decreased with increasing time and temperature. At high
temperatures, decreasing the pitch viscosity facilitated the spreading of pitch and its penetration into the coke bed. The chemical behavior of petroleum cokes and coal tar pitches were studied using the FT-IR spectroscopy and XPS. The results showed that the wettability behavior of cokes by pitches depends on their physical properties as well as the presence of surface functional groups of coke and pitch which can form chemical bonds.
Keywords : Petroleum coke; Coal tar pitch; Wettability; Contact angle; Coke–pitch interactions
1. Introduction
Coal tar pitch is widely used as a binder for the granular material (also called the filler) during the carbon anode production in aluminum industry because of their excellent binding properties. In general, the preparation of carbon anodes involve the following three steps: mixing calcined petroleum coke with recycled anodes and butts (all of which constitute the granular material) with the binder pitch to make an anode paste, vibro-compacting or pressing this paste to form green anodes, and finally baking the green anodes to produce baked anodes that are consumed during the alumina electrolysis for aluminum production.
The final properties of baked carbon anodes are partly determined by the interactions that take place in the kneader during the mixing of the paste [1], [2] and [3]. Pitch has to penetrate through coke pores and fill the voids between the coke particles. Good interaction between coke and pitch is an essential condition for the generation of
satisfactory bonding between these two components. The wettability of coke by pitch is a direct indication of the degree of their interaction. The interaction between the filler and the binder depends on the characteristics of the binder (softening point, chemical composition, surface tension, viscosity) and the coke (particle size, texture, chemical functional groups at the surface, porosity, etc.) [4]. A number of authors found that coal tar pitches behave as Newtonian fluids within the temperature range of 140–231 °C at a shear rate ranging from 0.13 to 7 s−1[5], [6] and [7]. It implies that pitch viscosity does not
kneader. However the mixing efficiency of the kneader is important because it helps disperse and spread pitch around the aggregate and improves the contact [7].
During anode baking, the carbonization of pitch takes place. New bonds form between the granular material and the carbonized pitch. This keeps the structure intact [8]. Wetting and, consequently, the quality of interactions between these two components greatly affect the final anode properties. The aim is to produce high density, low electrical resistivity, and structurally sound anodes with good mechanical properties. Therefore, choosing a coke–pitch pair that has a tendency to form bonds is the first important step for reaching this goal.
The wettability of calcined coke by a molten pitch drop can be characterized with the contact angle formed between the molten pitch drop and the coke bed. The first widely accepted correlation between the interfacial tension and the contact angle for a liquid drop on a solid surface is expressed by the following equation suggested by Young in 1805 [9]:
Equation (1)
γsv=γsl+γlvc o sθ
where γsvγsv is the interfacial tension of the solid–vapor interface, γslγsl is the interfacial tension of the solid–liquid interface, γlvγlv is the interfacial tension of the liquid–vapor interface, and θ is the contact angle. γlvγlv is also known as the surface
tension.
The calcined petroleum coke is one of the raw materials used for anode production. Various authors studied the chemical structure of green petroleum cokes by different analytical methods such as FT-IR and XPS for different applications. The importance of calcined coke is not just limited to anode production. It is important to know the chemical structure and the sulfur content of petroleum coke as they are used as fuel in boilers to produce electricity and are attractive feedstock for gasification. Petroleum coke is also utilized in coal blends that are commonly used in steel plants. The chemical functionality often has an effect on petroleum coke [10].
No significant literature is found on the utilization of FT-IR on calcined coke as the calcined coke has lower absorption characteristics with respect to baseline levels [10]. The presence of aromatic hydrocarbons in petroleum cokes may be responsible for the chemical activity during the coking process. Different authors studied the XPS spectra of
green petroleum coke and carbonaceous materials and found that they contain mostly carbon. In addition, they contain oxygen, nitrogen, sulfur, calcium, and sodium [11], [12], [13] and [14].
A qualitative analysis of different functional groups present in calcined coke was carried out by FT-IR analysis; and based on this information; a quantitative analysis of these functional groups has been done by XPS analysis. XPS is one of the conventional methods better suited to perform quantitative analyses. To understand the nature of interaction between calcined petroleum coke and coal tar pitch, it is also important to study the chemical structure of pitch. The purpose of this study is to evaluate the degree of wetting of cokes by pitches and to investigate their interactive characteristics.
2. Materials and methodology 2.1. Materials
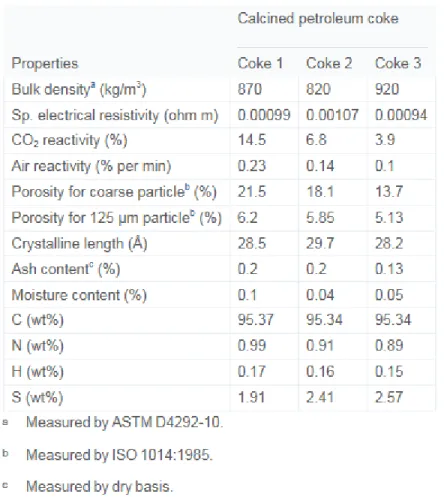
In this study, commercially available calcined petroleum cokes and coal tar pitches have been used for all the tests. The physical and chemical properties of the cokes and the pitches are given in Table 1 and Table 2.
Table 2. Physical and chemical properties of pitches used in the study.
2.2. Sessile drop experimental system
The sessile-drop experimental system consists of a tube furnace (thermolyne 21100), an inconel tube with a pitch injection system, a graphite sample crucible, a digital video
camera (B/W, APPRO, model KC), and a secondary rotary vacuum pump (GE, Precision Vacuum Pump, Model D25) (see Fig. 1). The compacted coke powder is placed in the sample crucible. The injection chamber holds the solid pitch sample. This chamber has a small hole at the bottom and is placed just above the coke sample during the
experiment.
Fig. 1. Schematic diagram of Sessile Drop Experimental Set-up at UQAC.
In this study, two types of coal tar pitch and three types of petroleum coke used by the industry were tested. Coke particles were grounded, and an average particle size of 125 µm was used for wetting tests. This particle size was also used by other researchers [8] and [15]. The particles were compacted in the sample crucible in order to have a smooth coke bed surface. The experiments were conducted under nitrogen (N2)
atmosphere. There are two entry lines for nitrogen. The main line is directly connected to the Inconel tube for maintaining the inert atmosphere inside this tube. The other line that connects the injection chamber to the inert gas supply carries the N2 gas necessary for
slightly pressurizing this chamber in order to force the liquid pitch out on to the solid sample. Pitch is placed in the graphite injection chamber above the substrate holder. The molten pitch droplet is directly dropped onto the coke substrate by arranging the
position of the injection chamber hole. The drop size can be changed by adjusting the hole size. The substrate holder can be removed from the hot region of the furnace by using a specially designed mechanism, and the sample can be quenched for further analysis. A video of the drop is captured for 25 min. The system can capture both static and dynamic images. To measure the contact angle, the FTA 32 software is used. In order to decrease the O2 and humidity content of N2, the gas is passed through O2
(Chromatographic Specialties, Oxygen Trap C36084) and humidity traps
(Chromatographic Specialties, Glass Moisture Trap – C36150) before it enters the system. The sessile drop experiments were carried out at two different temperatures (170 °C and 190 °C). For each experiment, the contact angle was taken as the average of the angles measured on two sides of the drop. Each experiment was repeated twice. Three different cokes and two different pitches were studied using a sessile-drop system in order to understand their interactions. A comprehensive understanding of these interactions helps produce better quality carbon anodes for use in primary aluminum production.
2.3. FT-IR analysis
The chemical structure of different coke and pitch samples were examined by FT-IR spectroscopy at room temperature. In addition, three different coke–pitch mixtures (85:15 wt%) were kept at 170 °C and 190 °C for 1 h in N2 atmosphere. Then, the
chemical structure of this mixture was also examined by FT-IR analysis in order to compare with those of pure coke and pitch and to determine their interactions. The main objective was to identify the new bond formation in such a mixture which is used in anode production. The IR spectra were collected in the wavenumber range of 500– 4000 cm−1, and the entire spectra were recorded using 4 cm−1 resolution. Each time, 20
scans were carried out prior to the Fourier transformation. All spectra were collected using a DRIFTS (Diffuse Reflectance Infrared Fourier Transform Spectroscopy) technique (Parkin Elmar Instrument, Spectrum one), and each result is the average of four experimental runs. The DRIFTS technique was used with an aperture mask of 2 mm-diameter and a reflector angle of 16°. All spectra were analyzed using the Spectrum-version 5.0.1 software. The effective depth of the surface scanning is 0.5– 5 µm.
2.4. XPS analysis
Different coke samples were studied by AXIS Ultra XPS spectrometer (Kratos Analytical) using Mono-chromate Al K[α] (h [upsilon] = 1486.6 eV) source at a power of 210 W at the Alberta Centre for Surface Engineering and Science (ACSES), University of Alberta. The working pressure in the analytical chamber was lower than 2 × 10⁻⁸ Pa. The
resolution function of the instrument for the source in hybrid lens mode was calibrated at 0.55 eV for Ag 3d and 0.70 eV for Au 4f peaks. The photoelectron exit was along the normal of the sample surface with an analysis spot of 400 × 700 m2. During the analysis,
a separate charge neutralizer was used to compensate for sample charging. Survey spectra were scanned from 1100 to 0 eV binding energy and collected with an analyzer, pass energy (PE) of 160 eV and a step of 0.35 eV. For the high-resolution spectra, the PE of 20 eV with a step of 0.1 eV was used. The XP-spectra fitting was performed using the CASAXPS software. The peak area was evaluated and scaled to the instrument’s sensitivity factors after a linear background was subtracted from each peak. The
composition was calculated from the survey spectra using the CasaXPS 2.3.16 software. High-resolution spectra were used to carry out the spectra fitting and the component analysis. The analyzed surface depth of the sample was 2–5 nm.
2.5. SEM analysis
Three different coke samples (125 µm) were vacuum-dried for one day at room temperature prior to SEM analysis. Each coke sample was then sputtered with gold– platinum coating using a plasma current of 10 mA, a chamber pressure of 6 × 10⁻² mbar,
and a sputtering time of 140 s with a Polaron Range sputter coater. The SEM analysis was done by using JEOL-JSM-6480LV with secondary electron scattering and with a voltage of 20 kV and WD of 16 mm.
3. Results and discussion
3.1. Wettability of different cokes by different pitches at two different temperatures The change of contact angle with time was found to be nonlinear for all the coke/pitch combinations. Fig. 2 and Fig. 3 demonstrate the change in contact angle of different coke/pitch combinations as a function of time at 170 °C and 190 °C. The mixing
temperature of coke and pitch is around 170 °C in the industry. A temperature of 190 °C was also tried in order to see if there is any advantage of mixing at higher temperatures, especially for higher viscosity pitches.
Fig. 2. Dynamic contact angles of (a) Pitch 1 (b) Pitch 2 on three different cokes at 170 °C.
Fig. 3. Dynamic contact angle of (a) Pitch 1 and (b) Pitch 2 on three different cokes at 190 °C.
The contact angle for different pitch/coke systems decreased with increasing time. The initial and final contact angles observed with Coke 1 were the lowest among all the cokes studied. Coke 3 had the highest final contact angle. All three cokes had almost similar initial contact angles. For this system, the contact angle for Coke 2 and Coke 3 decreased together down to 600s; but afterwards, the contact angle of Coke 2
decreased relatively faster compared to that of Coke 3. The final contact angle of the Coke 1, Coke 2, and Coke 3 were 23°, 33°, and 49°, respectively.
A similar trend was observed for Pitch 2 with the same cokes as shown in Fig. 2b with the exception that the contact angles of Coke 2 and Coke 3 started to differ after 200 s. Coke 1 had the lowest and Coke 3 had the highest initial and final contact angles. It can clearly be seen from this figure that the initial contact angle of Pitch 2 is nearly the same
for Coke 1 and Coke 2; afterwards, the contact angle of Coke 1 further decreased. Thus, it was wetted more by this pitch compared to Coke 2. The final contact angle of the Coke 1, Coke 2, and Coke 3 were 18°, 28°, and 47°, respectively.
The results indicate (Fig. 2a and b) that all coke/pitch systems studied show similar trends at this temperature. Coke 3 had the highest contact angle, and Coke 1 had the lowest contact angle at all times. If the physical properties of the cokes (Table 1) are compared, it can be seen that the porosity of Coke 1 is the highest and Coke 3 is the lowest. Therefore, this might be one of the factors affecting the wettability since the highest porosity coke is wetted the most and the lowest porosity one is wetted the least by both pitches. Pitch 2 has lower viscosity than that of Pitch 1 at this temperature (Table 2). However, the final contact angles are not very different, and those of Pitch 2 are slightly lower. To be able understand their behavior; the chemical surface analysis was carried out. The results of the FT-IR and XPS analyses for cokes and pitches and their relationship to wettability are discussed in the following sections.
Fig. 3a and b present the results of the wetting experiments carried out with the two pitches, which had different viscosities at the higher temperature (190 °C). For Coke 1, contact angle changed rapidly for the initial 500 s and reached 0° within 1244 s (Fig. 3a). In case of Coke 3, the contact angle changed gradually with time; and even after 1500 s, its value was 32° (Fig. 3a). The change of contact angle with time found to be fast with Pitch 2, and Coke 1 and Coke 2 were completely wetted by this pitch (Fig. 3b). For Coke 1, the contact angle change was rapid and reached 0° within 591 s; for Coke 2 however, the contact angle approached 0° within 1030 s (Fig. 3b). For Coke 3, the contact angles were found to be highest (least wetting) at all times; but, considerable decrease in the dynamic contact angle was observed with increasing temperature. The coke with the highest porosity (Coke 1) had the lowest contact angle while the lowest porosity coke (Coke 3) had the highest contact angle as it was the case at the lower temperature. The lower viscosity pitch (Pitch 2) completely wetted Coke 1 and Coke 2 during the
experiment whereas the higher viscosity pitch (Pitch 1) completely wetted only the highest porosity coke (Coke 1).
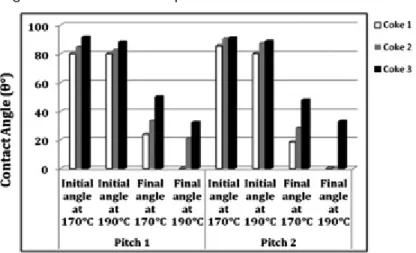
The initial and final contact angles are shown in Fig. 4 for all cokes and pitches at the two temperatures studied. The initial contact angles of Coke 1 at lower and at higher temperatures are almost the same for Pitch 1; however, for all the other cokes, the initial contact angles are lower at the higher temperature (190 °C) compared to those
measured at the lower temperature (170 °C). The initial contact angle of Coke 3 was highest at the lower temperature for both Pitch 1 and Pitch 2 (Fig. 4).
Fig. 4. Intial and final contact angles of Pitch 1 and Pitch 2 on three different cokes at two different temperatures.
As seen from the contact angle tests, increasing temperature has a favorable effect on the wetting behavior of pitch due to the change in viscosity, which leads to better spreading and penetration of pitch through the porous structure of coke. However, the change in viscosity with temperature seems to affect some cokes more than the others. This might be due to the structure of coke (porosity) as explained above or their
chemical nature. It is possible that an increase in temperature provokes chemical
reactions (bonding) to take place at the coke–pitch interface. The initial contact angles of all coke/pitch systems were found to be very high; however, they decreased with time. Therefore, it is possible that the interfacial reactions facilitate the wetting of cokes by pitches at prolonged times. However, the verification of the occurrence of interfacial reactions requires further investigation. In order to explain the wettability results based on the chemical surface characteristics of both pitch and coke, their FT-IR and XPS analyses were carried out, and the results are presented below. First, a qualitative FT-IR analysis was done to determine the possible bonds present on the surface of a given material. Then, a quantitative XPS analysis was performed. The information required for the detailed XPS analysis on these bonds was obtained from the FT-IR analysis results. Therefore, these two analyses are complimentary to each other.
3.2. FT-IR analysis
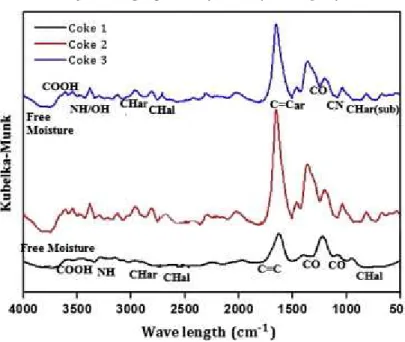
The surface functional groups of the samples were identified with FT-IR. Fig. 5 shows the FT-IR spectra of the three calcined petroleum cokes. The calcined petroleum coke has very low transmission characteristics to baseline levels [10]. The assignment of the bands was done (Table 3) based on the literature FT-IR data for a green coke system because no FT-IR study of calcined coke is documented in the literature. Before the detailed analysis, each sample was tested four times and each of the spectra was obtained by averaging four spectra (see Fig. 5).
Fig. 5. FT-IR analysis of calcined petroleum cokes by DRIFT method at room temperature.
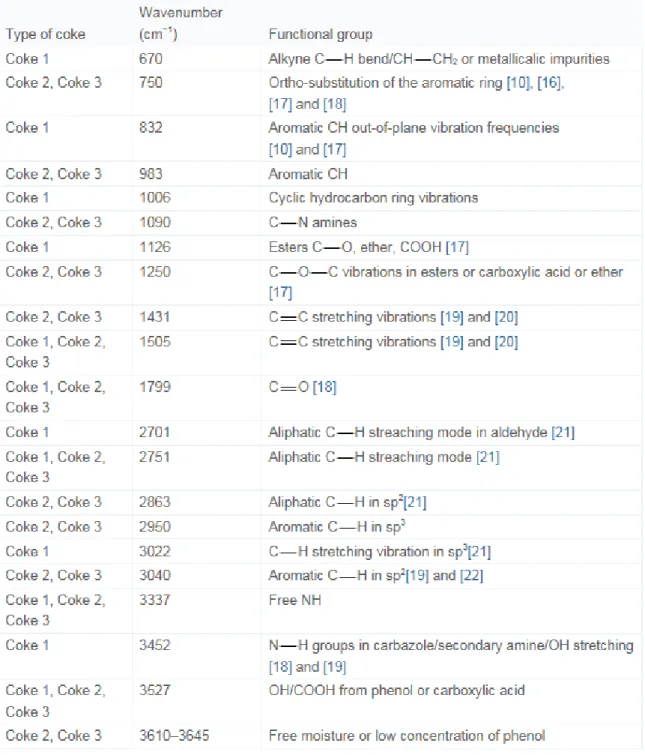
Table 3. List of functional groups in different petroleum cokes from the FTIR study.
The FT-IR spectra for Coke1 are significantly different than those of Coke 2 and Coke 3 (Fig. 5). The FT-IR spectra typically display a transmittance band near 3022 cm−1 due to
aromatic C H stretching vibrations for Coke 1; but, for other two cokes, the transmittance band was found near 3040 cm−1 due to aromatic C H stretching
from the out-of-plane vibration of aromatic C H bonds and bands corresponding to aromatic C C bond near 1500 cm−1 were observed for all three coke particles.
Carbonyl and C C bond stretching exhibited transmission peaks close to each other; and they were sometimes difficult to assign because of the overlap with each other. CO (acid)/C N amines and the ortho-substitution of aromatic rings were found at the transmittance frequency of 1090 and 729 cm−1, respectively, for Coke 2 and Coke 3; this
was not significantly present in Coke 1. This ortho-substituted aromatic ring could lead to condensation or cyclization during mixing with pitch at high temperatures. The infrared spectra showed characteristic group frequencies at 679 cm−1 for vinyl group and at
1006 cm−1 for cyclohexane ring vibrations for Coke 1 while no transmittance band was
found for the other two cokes. In addition, C O stretching of aliphatic or aromatic acid/alcohol/ether or ester appeared approximately at 1122 cm−1 for Coke 1.
On the aliphatic side, the spectra consist of a pattern of transmittance bands corresponding to saturated C H stretching vibrations of alkyl substituents and methylene groups in hydro-aromatic compounds (the region between 3000 and
2700 cm−1), C C stretching vibrations for aromatics or alkane (1431 cm−1), and C O
C vibrations in ester, ether or carboxylic acid (1250 cm−1) groups as petroleum cokes
contains carboxylic acid [23]. The FT-IR spectra showed that, in the region of 3000 and 2700 cm−1, Coke 1 contains a diffused peak of aliphatic hydrocarbon which indicated the
presence of smaller chains of aliphatic groups compared to other cokes. It can also be noted that phenolic functionalities, free OH or moisture are related to the transmittance band at 3610–3645 cm−1.
In general, the FT-IR spectra of two of the cokes (Coke 2 and Coke 3) were similar with regard to functionality although there were some qualitative as well as quantitative differences. As reported by Michel et al. and Pruski et al. [24] and [25], petroleum cokes are composed of polynuclear aromatic hydrogen-deficient structures with few alkyl side chains as substituents and naphthenic groups such as naphthalene, phenanthrene, anthracene, tri-phenylene, benzo-pyrene, coronene, and pyrene, which is in agreement with the FT-IR result of the present work. For Coke 2 and Coke 3, cyclic hydrocarbon ring vibrations were observed. The presence of methyl group (2865 cm−1) as well as
those corresponding to C C stretching bending vibrations of methylene (1431 cm−1)
groups can be seen from the FT-IR spectra. It was assumed that most of the methyl groups are present in long chains and α-positions in the aromatic rings. The aliphatic chains in α-positions can easily undergo cyclization [10]. At 750 cm−1, ortho-substitution
groups were noticed. However, no direct information on the exact structure of the coke can be derived from the available FT-IR results.
Since the petroleum coke and the coal tar pitch contain complimentary functional groups, there is a possibility that the functional groups on the coke surface may interact with those present in pitches. Polycyclic aromatic hydrocarbons (PAH) are predominant in pitch. Also, alkylated PAH, PAH with cyclopenteno moieties, partially hydrogenated PAH, oligo-aryl methanes, hetero-substituted PAH:NH2, OH, carbonyl derivatives of PAH, polycyclic hetero-aromatic compounds are found in pitch [21], [26] and [27]. Carbonyl and small amounts of phenolic/carboxylic as well as amines (NH) groups are found on the surface of Coke 1. These groups can form covalent bonds with the oxygen or nitrogen containing functional groups in pitch; therefore, their presence in small quantities is desirable. They can also assist hydrogen bonding with oxygen and nitrogen atoms of other groups. The phenolic/carboxylic/aliphatic structures in pitch could react with the phenolic/alcoholic/aliphatic groups on the petroleum coke surface to form ester or ether. As presented in Fig. 7, there was a formation of a broad transmission band at 1114 cm−1 for C O stretching vibration in ester or ether and a broad transmission peak
(805 cm−1) for aromatic CH out-of-plane vibration. It is also possible that the aromatic
compounds of the coke can react with the aliphatic compounds of the pitch and vise-versa, which might result in an increase in the transmittance band at 1505 cm−1 for C
C bond. CN groups of the coke and pitch can form a new (pyridine) structure as a result of the reaction with aromatic hydrocarbons of coke and pitch. Compounds containing the nitrogen atom (free NH) in cokes might attach to a carbonyl structure to form amides or hydrogen bonds. Jiang (2007) performed FT-IR studies on a petroleum coke and stated that the surface functional groups such as C OH, COOH, and some alkyl groups of petroleum cokes play a key role in the chemical activation process [19].
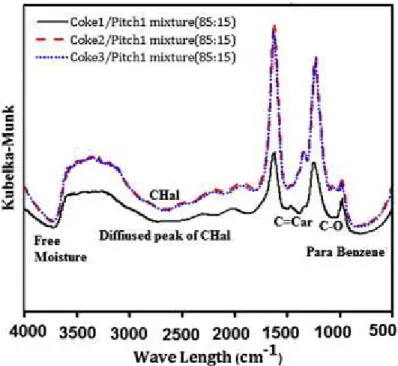
Fig. 7. FT-IR analysis of calcined petroleum cokes and Pitch 1 mixture (in a ratio of 85:15 wt % and heated at 170 °C for 1 hr in N2 atm) by DRIFTS method at room temperature.
First, the FT-IR analyses of cokes and pitches were carried out separately at room temperature. The FT-IR spectra of cokes are given in Fig. 5. The FT-IR spectra of Pitch 1 and Pitch 2 are given Fig. 6. The FT-IR spectra of two pitches showed the presence of similar chemical functionalities. Pitch 1 and Pitch 2 displayed a broad peak around 3428 cm−1 for free moisture. Around 3038 cm−1, a peak was obtained due to aromatic
CH stretching vibrations, and other peaks were observed due to aliphatic CH stretching vibrations on pitch surfaces around 2903 cm−1 and 2837 cm−1. Various bands related to
aromatic CH out-of-plane bending with different degrees of substitution were observed in the region of 700–900 cm−1. A very sharp peak at 742 cm−1was detected due to
o-substituted aromatic ring vibrations. A weak peak at1725 cm−1 was found due to
carbonyl. The band at 1595 cm−1 is attributed to aromatic C C stretching. Multiple
peaks were detected in the region of 1200–1300 cm−1 due to C O (acid)/CN vibrations,
and those in the range of 1050–1150 cm−1 are due to C O stretching of
acid/alcohol/ether/ester. Peaks around 1438 cm−1 and 1374 cm−1 were obtained due to
Fig. 6. FT-IR analysis of pitches by DRIFT method at room temperature.
In order to see the effect of the mixing of pitch and coke at the temperatures of interest during the paste preparation in industry, they were mixed at 170 °C and cooled to room temperature, and then the FT-IR analysis of the mixture was carried out. This was repeated for 190 °C. The results for all three cokes with Pitch 1 are shown in Fig. 7 at 170 °C. As it can be seen from Fig. 5, Fig. 6 and Fig. 7, the individual spectra of coke and pitch are different than those of their mixture.
The mixtures exhibited the formation of similar functional groups, i.e., broad transmission peaks for C O stretching in ester or ether (1116 cm−1), C H outer plane vibration
(836 cm−1), and C C (1506 cm−1) stretching vibration (Fig. 7). In the spectral region of
2700–2900 cm−1, a clear difference can be seen in the FT-IR spectra when different
cokes are used. A diffused peak is formed due to chemical reactions. In addition, Coke1 shows further diffused peak for aliphatic hydrocarbons. This phenomenon can be
elucidated by the presence of smaller aliphatic chains which created less stearic
hindrance to the cyclization or condensation reactions for Coke 1. This might explain the reason for better wettability of this coke by the pitches investigated compared to those of the other two cokes. The FT-IR analysis of the mixtures showed that interactions
occurred between pitch and coke when they were mixed. The results obtained at 190 °C were very similar to those obtained at 170 °C. This indicates that increasing the
temperature within the range studied does not affect the nature of the interactions. Similar results were obtained for Pitch 2 with all the cokes studied.
3.3. XPS analysis
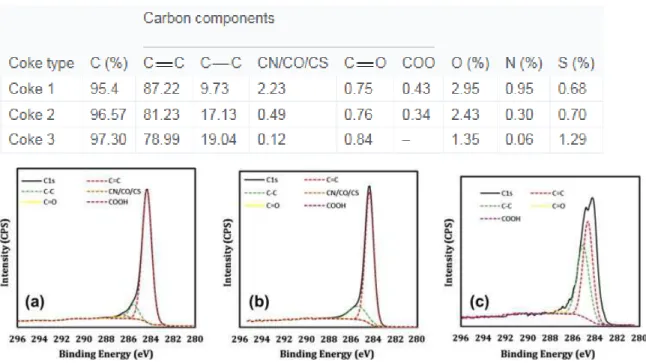
FT-IR analysis was used to identify the chemical functionality of coke and pitch surfaces. During the XPS analysis, the information obtained from the FT-IR analysis was used to carry out the de-convolution of C1s peak. Atomic percentages of different components for the three different calcined coke samples are presented in Table 4 for the survey spectra and the de-convoluted C1s spectrum. The de-convoluted C1s spectra of calcined cokes are presented in Fig. 8. It was evident from the XPS results that all the coke samples contained greater quantities of C C and C C bonds and trace amount of oxygen, nitrogen, and sulfur components. Also, it can be seen from Table 4 that Coke 1 had the highest oxygen percentage whereas Coke 3 had the lowest. The greater the oxygen percentage is, the higher the possibility for the formation of bonds between coke and pitch functional groups is; consequently, the wettability increases with increasing oxygen percentage. As it is well known, bonds containing oxygen and nitrogen are more reactive. Also, the presence of COOH might play a key role in chemical reactions. Coke 1 and Coke 2 contain COOH functional groups, but Coke 3 does not contain any.
Therefore, it is possible that Coke 3 was able to form fewer chemical bonds with different pitches compared to the other two cokes both at 170 °C and 190 °C. The lower nitrogen concentration in Coke 3 can be attributed to the lower concentration of amine (C N) groups. This probably reduced the interaction between pitch and coke, and,
consequently, decreased the wettability (higher contact angles) of Coke 3 by both pitches. CN, C O, C O, COOH functional groups are highly reactive and form new chemical bonds with the C C/C C components of pitch; therefore, their presence results in better wetting. This is in agreement with the results of wetting tests at both temperatures (Fig. 2 and Fig. 3). In addition, Coke 3 has the highest sulfur percentage compared to those of the other two cokes. The presence of sulfur containing functional groups might increase the possibility of intra-molecular bonds and thus reduces the wettability. This is also in agreement with the wettability results of Coke 3 which is the least wettable.
Table 4. Atomic percentages of different components of the three different industrial cokes.
Fig. 8. De-convoluted C1s peak of three different cokes (a) Coke 1 (b) Coke 2 (c) Coke 3.
Also, Coke 1 contains more C C bonds than Coke 2 and Coke 3. While double bonds are stronger than single bonds, they are also more restrictive to movement. The reason double bonds are more reactive is that they contain both σ-bonds and π-bonds. π-bonds are not as strong as σ-bonds and therefore are easier to break; thus π-bonds are the ones that end up reacting more. This might explain the reason for Coke 1 to be wetted best by pitches.
Atomic percentages of the different components of two coal tar pitches studied are presented in Table 5 for the de-convoluted C1s spectrum. The de-convoluted C1s spectrum of coal tar pitches are presented in Fig. 9.
Fig. 9. Deconvoluted C1s peak of two different pitches (a) Pitch 1 (b) Pitch 2.
The high resolution C1s spectrum of pitches shows that Pitch 2 contains high amount of oxygen and nitrogen, which makes it more reactive compared to Pitch 1. Therefore, in general, Pitch 2 wets the coke better than Pitch 1. This is also in agreement with the wettability test results. Usually the C C bonds in aromatic compounds help wetting via electrostatic bond. Thus the C C bonds in aromatic compounds need compounds having a positive center (such as NH4+) for interaction. However, these kinds of
positive-center compounds are not present in notable quantities in calcined petroleum coke. Thus, the low quantities of C C bonds in Pitch 2 do not affect the wettability.
3.4. Porosity analysis
During the measurement of contact angles by the sessile drop method, 125 µm coke particles were used. This particle size was chosen so that the effect of bed porosity could be minimized. Also, the particles were compacted to minimize the bed porosity. To study the effect of porosity on wetting, the porosity of the 125 µm coke particles were measured by water pycnometer according to ISO 1014:1985. Due to crushing, porosity may change. The porosity of the bulk material and the porosity of the crushed 125 µm coke particles were plotted, and it was observed that there exists a good correlation between them (see Fig. 10). For the particles with the highest bulk porosity, the porosity after crushing remained the highest whereas for the sample having the lowest porosity, the value was found to be the lowest.
Fig. 10. Correlation between % porosity of crushed and coarse particle of calcined petroleum cokes.
To study the effect of physical and chemical wetting, the contact angle measurements were performed using 40 µm particles. Usually, the real density of coke is measured using 40 µm particles. This eliminates the effect of porosity. Fig. 11 shows that the trends found for the wetting angles with 125 µm and 40 µm particles are the same. The value with the 40 µm particles was found to be slightly higher than that for the 125 µm particles for the same coke. Initially, the contact angles for both 40 µm and 125 µm particles were similar; but, after 100 s, 125 µm coke particles are wetted more by the pitch. The results clearly indicate that the increase in porosity increases the wetting and decreases the contact angle. However, the elimination of porosity clearly signifies that the chemical nature of the coke surfaces controls the wetting to a large extent since the trends were the same. It is difficult to analyze the effect of the porosity only because of the difficulty to maintain all other parameters constant.
Fig. 11. Comparative wetting studies of 40 µm and 125 µm particles with time for three different calcined cokes.
Scanning electron microscopy (SEM) is an important tool to visualize the surface texture of coke particles at nano-scale. SEM makes it easy to identify the size of pores and to visualize their inner structural details in the case of a small coke sample. It has an inherent limitation in sample size, making it difficult to analyze large coke surfaces. Fig. 12 shows the SEM images of three different calcined petroleum cokes. All coke surfaces contain pores and cracks. The dimensions of some pores are very small although there are also larger pores in addition to some interconnected pores. The presence of very small pores prevents the penetration of pitch into the coke particles [28] and reduces the wetting of coke by pitch. It is possible that the structural differences affect the wetting behavior of pitch into pores. Apparently, Coke 3 has the lower pores; but since coke is highly nonhomogeneous, SEM images may not represent the actual pore distribution in the bulk of the coke sample.
4 Conclusions
There was a significant difference between the final contact angles of Coke 1 and Coke 3 for all two pitches at both temperatures studied. In general, the contact angle
decreased with increasing time and temperatures. This might be due to the fact that both the extent of reactions between coke and pitch and the penetration of pitch through the pores increase as the temperature and time increase.
The FT-IR spectroscopy results showed that there is a significant difference in the chemical nature of the three cokes. It was difficult to determine the nature of the products formed during the mixing of coke and pitch from the results of the FT-IR analysis of coke/pitch mixtures. The peaks in the rage of 2800–2950 cm−1 are diffused
for Coke 1 which has smaller lengths of aliphatic chains. This creates less steric hindrance for wetting in the case of Coke 1, which might facilitate the formation of
hydrogen bonds that improves its wettability. The other two cokes had similar structures, but Coke 3 has lower porosity. This is probably another reason for the low wettability of Coke 3.
The FT-IR analysis of coke and pitch mixtures indicated the presence of chemical interaction between them shown by the pronounced growth of carbonyl (C O), aromatic hydrocarbon (C H), and alkene or olifin (C C) bonds for all three mixtures due to the chain reaction between hydrocarbons and the addition reaction between C C bonds to form C C (alkene) or ester (RCOOR) after reaction with carbonyl. XPS results showed that Coke 3 is significantly different from the other two cokes in terms of chemical composition. Coke 1 has more oxygen and nitrogen groups which might be the reason for its better wettability as these two surface functional groups are easy to decompose and interact with those of pitch. Also, Coke 1 contains more carbon double bonds which are reactive. However, Coke 3 contains high quantities of C S bonds on the surface resulting in its low wettability by two pitches studied compared to the wettability of other cokes. This might be due to the possibility that sulfur atoms on the surface of the coke might form intra or inter molecular hydrogen bonds, which makes them unavailable for hydrogen bonding with pitch. Also Coke 1 is more porous (see Table 1), which could lead to better penetration of pitches into the pores. It is quite evident that an SEM image of coke which is highly nonhomogeneous does not illustrate the actual pore distribution in the bulk of the coke sample. It is also evident that the surface functional groups predominantly control the wetting when the effect of porosity is eliminated.
Pitch 2 penetrates better into coke due to its lower viscosity (Table 2) and higher content of nitrogen and oxygen functional groups compared to Pitch 1. The exact mechanism of pitch/coke interactions is not evident, and further work is needed to understand this mechanism.
Acknowledgements
The technical and financial contributions of Aluminerie Alouette Inc. as well as the financial support of the Natural Sciences and Engineering Research Council of Canada (NSERC), the Développement économique Sept-Sept-Îles (DESI), the University of Québec at Chicoutimi (UQAC), and the Foundation of the University of Québec at Chicoutimi (FUQAC) are greatly appreciated.
References
[1] P. Couderc, P. Hyvernat, J.L. Lemarchand
Correlations between ability of pitch to penetrate coke and the physical characteristics of prebaked anodes for the aluminium industry
Fuel, 65 (1986), pp. 281–287
[2] V.G. Rocha, M. Granda, R. Santamaría, C. Blanco, E.I. Diestre, R. Menéndez Pyrolysis behaviour of pitches modified with different additives
J Anal Appl Pyrol, 73 (2005), pp. 276–283 [3] J. Cao, A.N. Buckley, A. Tomsett
Re-examining the pitch/coke wetting and penetration test JOM, 54 (2002), pp. 30–33
[4] V.G. Rocha, C. Blanco, R. Santamaría, E.I. Diestre, R. Menéndez, M. Granda Pitch/coke wetting behaviour
Fuel, 84 (2005), pp. 1550–1556
[5] Eie M, Sorlie M, Torklep K. Rheological characterization of standard and cut back anode pitches. In: Extended abstract presented at the 22nd biennial conference on carbon. San Diego: American Carbon Society; 1995, p. 752–53.
[6] J.A. Branscomb
Bituminous materials: asphalt, tars and pitches
A.J. Hoiberg (Ed.), Carbon electrode pitches, John Wiley & Sons Inc. (1966), pp. 359– 384
[7] H.K. Louise
Anode manufacture: raw materials, formulation and processing parameters R&D Carbon Ltd., Sierre, Switzerland (2000)
[8] A.N. Adams
Characterization of the pitch wetting and penetration behavior of petroleum coke and recycled butts in pre-baked carbon anode
The department of energy and geo-environmental engineering, Pennsylvania State University, Pennsylvania (2004), pp. 1–220
[9] Adamson AW. Physical chemistry of surfaces; 1990.
[10] J.A. Menéndez, J.J. Pis, R. Alvarez, C. Barriocanal, E. Fuente, M.A. Díez
Characterization of petroleum coke as an additive in metallurgical cokemaking. Modification of thermoplastic properties of coal
Energy Fuels, 10 (1996), pp. 1262–1268
[11] K.N. Tran, A.J. Berkovich, A. Tomsett, S.K. Bhatia
Influence of sulfur and metal microconstituents on the reactivity of carbon anodes Energy Fuels, 23 (2009), pp. 1909–1924
[12] X.L. Zhang, Y. Zhang, F.S. Ding, Q.J. Huang, Y. Li
Effect of the surface properties of an activated coke on its desulphurization performance
Min Sci Technol (China), 19 (2009), pp. 769–774
[13] R.I.R. Blyth, H. Buqa, F.P. Netzer, M.G. Ramsey, J.O. Besenhard, M. Winter X-ray photoemission studies of surface pre-treated graphite electrodes J Power Sources, 97–98 (2001), pp. 171–173
[14] R.I.R. Blyth, H. Buqa, F.P. Netzer, M.G. Ramsey, J.O. Besenhard, P. Golob, et al. XPS studies of graphite electrode materials for lithium ion batteries
Appl Surf Sci, 167 (2000), pp. 99–106
[15] V.G. Rocha, C. Blanco, R. Santamaría, E.I. Diestre, R. Menéndez, M. Granda An insight into pitch/substrate wetting behaviour. The effect of the substrate processing temperature on pitch wetting capacity
Fuel, 86 (2007), pp. 1046–1052
[16] J. Alcañiz-Monge, D. Cazorla-Amorós, A. Linares-Solano
Characterization of coal tar pitches by thermal analysis, infrared spectroscopy and solvent fractionation
[17] S.H. Lee, C.S. Choi
Chemical activation of high sulfur petroleum cokes by alkali metal compounds Fuel Process Technol, 64 (2000), pp. 141–153
[18] M.D. Guillén, M.J. Iglesias, A. Domínguez, C.G. Blanco, F.T.I.R. Semiquantitative Analysis of a coal tar pitch and its extracts and residues in several organic solvents
Energy Fuels, 6 (1992), pp. 518–525
[19] B. Jiang, Y. Zhang, J. Zhou, K. Zhang, S. Chen
Effects of chemical modification of petroleum cokes on the properties of the resulting activated carbon
Fuel, 87 (2008), pp. 1844–1848
[20] Malekshahian M, Hill J. Chemical and thermal modification of petroleum coke. In: 8th World congress of, chemical engineering; 2009, p. 520.
[21] Bo-Hye Kim, Arshad Hussain Wazir, Kap Seung Yang, Y.H. Bang, S.R. Kim Molecular structure effects of the pitches on preparation of activated carbon fibers from electrospinning
Carbon Lett, 12 (2011), pp. 70–80
[22] J. Alcañiz-Monge, D. Cazorla-Amorós, A. Linares-Solano
Characterization of coal tar pitches by thermal analysis, infrared spectroscopy and solvent fractionation
Fuel, 80 (2001), pp. 41–48 [23] A.N. Adams, H.H. Schobert
Characterization of the surface properties of anode raw materials Light Metals (2004), pp. 495–498
[24] D. Michel, M. Pruski, B.C. Gerstein
NMR of petroleum cokes I: relaxation studies and quantitative analysis of hydrogen by magnetic resonance
Carbon, 32 (1994), pp. 31–40
[25] M. Pruski, B.C. Gerstein, D. Michel
NMR of petroleum cokes II: studies by high resolution solid state NMR of 1H and 13C
Carbon, 32 (1994), pp. 41–49 [26] S. Uthaiporn
Characterization of coal and petroleum derived binder pitches and the interaction of pitch/coke mixtures in prebaked carbon anodes
Department of materials science and engineering, The Pennsylvania State University, Pennsylvania (2008), pp. 1–335
[27] C. Díaz, C.G. Blanco
NMR: a powerful tool in the characterization of coal tar pitch Energy Fuels, 17 (2003), pp. 907–913
[28] D. Belitskus, D.J. Danka
Comprehensive determination of effects of calcined petroleum coke properties on aluminum reduction cell anode properties