HAL Id: hal-01845774
https://hal.archives-ouvertes.fr/hal-01845774
Submitted on 20 Aug 2018HAL is a multi-disciplinary open access archive for the deposit and dissemination of sci-entific research documents, whether they are pub-lished or not. The documents may come from teaching and research institutions in France or abroad, or from public or private research centers.
L’archive ouverte pluridisciplinaire HAL, est destinée au dépôt et à la diffusion de documents scientifiques de niveau recherche, publiés ou non, émanant des établissements d’enseignement et de recherche français ou étrangers, des laboratoires publics ou privés.
Microencapsulation by a solvent-free supercritical fluid
process : use of density, calorimetric, and size analysis to
quantify and qualify the coating
Marilyn Calderone, Élisabeth Rodier, Jacques Fages
To cite this version:
Marilyn Calderone, Élisabeth Rodier, Jacques Fages. Microencapsulation by a solvent-free su-percritical fluid process : use of density, calorimetric, and size analysis to quantify and qualify the coating. Particulate Science and Technology, Taylor & Francis, 2007, 25 (3), pp.213-225. �10.1080/02726350701375741�. �hal-01845774�
Microencapsulation by a Solvent-Free Supercritical
Fluid Process: Use of Density, Calorimetric, and Size
Analysis to Quantify and Qualify the Coating
M. CALDERONE
E. RODIER
J. FAGES
Ecole des Mines d’Albi-Carmaux, Campus Jarlard, Albi, France
Coating of microparticles or microencapsulation is a widely used operation in which a thin layer of a coating agent is deposited onto a solid particle. Currently, the tech-nique faces two challenges: being solvent-free and being applicable for coating par-ticles smaller than 80 microns. In this work, several techniques are used to test the feasibility of a new solvent-free coating process using supercritical fluid technology. Some model microparticles, glass beads, and an active compound (AC) are coated with Precirol1, which is a mixture of fats. The process involves two steps: first supercritical CO2is dissolved in molten Precirol1, then the melt solution is sprayed onto the host particles by a rapid expansion. The particles coated in this way are examined by particle size analysis, environmental scanning electron microscopy (ESEM), and IR spectrophotometry. Also mass ratios of host particle to coating are evaluated using both helium pycnometry to determine sample density and calor-imetry to measure the heat of fusion of the coating agent. The results show that these analytical techniques can be used for qualitative analysis as well as quantification of the coating. Thus they give relevant information on reproducibility and feasibility of the new process.
Keywords coating, particle characterization, particle size analysis, supercritical fluids
Introduction
Supercritical fluids (SFs) are fluids at a pressure and a temperature above their criti-cal point. CO2is the most widely used supercritical fluid because it is abundant, safe,
and inexpensive and its critical properties are easy to reach at laboratory scale. The critical temperature of CO2 is 304.1 K and its critical pressure 73.8 MPa. Over the
past 20 years, SFs have found many applications in various fields such as extraction, reaction, and powder generation (Fages et al., 2004). They have been used to prepare micro-composite particles, especially for pharmaceutical purposes: protection of an active compound from deterioration, taste masking, formation of controlled-released systems, and enhancement of the dissolution rate of poorly soluble active ingredients (Perrut et al., 2005). The present work is included in this research domain.
Address correspondence to M. Calderone, Ecole des Mines d’Albi-Carmaux, LGPSD-UMR CNRS 2392, Campus Jarlard, 81013 Albi Cedex 09, France.
A review of coating processes based on supercritical technology shows that the characterization of microparticles is a delicate but essential point in order to validate the process. This implies the quantification of the coating agent deposited onto par-ticles and qualification of this coating. Qualification herein implies characterizing the way the coating is deposited (homogeneous deposition, agglomeration phenomena) and the coating efficiency. Usually, particle size measurements are performed together with other techniques. Thus, each new process faces analytical challenges. A few illustrations follow.
Kro¨ber and Teipel (2005) encapsulated monodispersed glass beads (between 7 and 80 microns) by stearyl alcohol solubilized into supercritical CO2using a fluidized
bed. The ratio of coating agent to coated particles was determined both by thermal gravimetric analysis (TGA) and density measurements to calculate the thickness of the deposited shell. However, no indication was given of the homogeneity of the coated samples or of the reproducibility of the process. Ribeiro Dos Santos et al. (2002) developed a process to coat bovine serum albumin, BSA (0–500mm), with fatty compounds. The raw materials were introduced into a vessel fitted with an impeller. Supercritical (SC) CO2solubilized the coating agent while BSA was
main-tained in suspension in the supercritical media. By adjusting both pressure and tem-perature, the solvent power of SC CO2was reduced and the lipid precipitated onto
BSA to form core=shell-designed particles. Morphology, surface appearance, and particle diameters were investigated by scanning electron microscopy (SEM). The mass ratio was determined by melting the coating and analyzing the remaining BSA by spectrophotometry. The coating efficiency was determined by the in-vitro release kinetics. Here the overall aggregation phenomenon was not investigated and optical microscopy did not allow a general overview of the whole sample. Perrut (2002) reported a technique where a coating agent was saturated with the super- or subcritical fluid and mixed with the solid particles in an agitated autoclave. The depressurization of the mixture induced solidification of the fat onto the particles. The final composition was determined by dissolving the microparticles. However, no additional indication of the coating efficiency was given.
A new microencapsulation process developed in our laboratory has the speci-ficity of processing separately the coating agent and the particles. This gives both protection of the particles from any deterioration and the opportunity to control the coating agent=particle ratio. The present article focuses on the analytical meth-ods used on the microcapsules formed to quantify or qualify the coating obtained and on the corresponding information given in terms of reproducibility and feasi-bility of the process. Micrometric glass beads and an active compound have been coated with a fatty component, Precirol1. Results for particle size analysis, environ-mental scanning electron microscopy (ESEM) observation, solids density, and calorimetric measurements are discussed.
Experiments and Characterization Methods
Materials
Two types of particles were used in the experiments: glass beads and an active com-pound (AC). Several sieve cuts of glass beads from 0 to 80 microns (Sovitec, France) were used as ‘‘model’’ particles to be coated. They are considered as a ‘‘model’’ because of their spherical shape, smooth surface, and well-defined size distribution.
The pharmaceutical active compound (AC) has a mean volume diameter of about 15 microns and the size distribution is very dispersed. The coating agent used was Precirol ATO51 powder (Gattefosse´, France), which is a commercial mixture of mono-, di-, and triglycerides, the main component being a mixed diglyceride with a C16 and a C18 saturated carbon chain. Its melting point at atmospheric pressure
measured by differential scanning calorimetry (DSC) (Perkin Elmer, UK) is 56.9!C. Precirol1 is widely used as an excipient in the pharmaceutical industry.
Operating Procedure
The coating experiments using supercritical CO2 were performed on a lab-scale
apparatus (Separex, France) modified for coating purposes (Figure 1). The pro-cedure was the following: solid Precirol1 was first introduced into a 500 cm3heated vessel. Liquid CO2(purity 99.8%, Air Liquide, France) was admitted from a bottle,
then cooled through a heat exchanger and pressurized to 11 MPa using a membrane pump (Lewa, Germany). The compressed CO2then flowed through a heater to reach
supercritical conditions. This SC CO2 was then introduced into the vessel and
dis-solved into the coating agent until equilibrium was reached. The vessel temperature had to be high enough to maintain the CO2 under supercritical conditions but was
held below the normal melting point of the Precirol1. The operating temperature was then around 323 K. This molten phase was expanded and Precirol1 solidified as a fine powder and deposited onto the uncoated particles. The mass ratio of Precirol1 to uncoated particles was 2:3. The resulting mixture was collected in a gas solid separator. The coated particles were then characterized.
Characterization Methods
Size Measurement
The particle diameter was measured using a time-of-flight particle size analyzer (PSD 3603, TSI, USA) (Figure 2). Using the measured time and a fixed reference
curve, the equivalent aerodynamic diameter (EAD) is determined as:
EAD¼ KU1=2 ð1Þ
K is a constant depending on the configuration of the apparatus, and U the velocity of the particle. This gives a number distribution of particle size. To take into account the true particle density, the Particle Instrument Manager1 (TSI, USA) software converts the EAD into an equivalent geometric diameter (EGD) according to relation (2):
EGD¼ EAD%pffiffiffiffiffiffiffiffiffiffiffiffiffiffiffiffiffiffiffiffiffiffiffiffiffiTrueDensity ð2Þ In this work, the number size distribution was numerically converted into volume size distribution to have a higher sensitivity to small changes in diameter, which should be the case in coating phenomena. In addition, the Aerosizer1is more accu-rate for the lower part of the size distribution. In the higher part, a big single particle may significantly diffract the incident light beam, thus perturbing the measure. As a consequence, the average volume diameter D[4,3] can be in error, and we have cho-sen to consider the median diameter D50 (Allen, 1997). The results are presented together with the cumulated volume size distributions. Each sample was measured twice so as to determine the homogeneity of the sample.
True Density Measurement
The true density was measured on the whole sample using a helium pycnometer (Accupyc 1330, Micromeritics, USA). These density measurements give an evalu-ation of the mass ratio of coating agent, fcoating agent, which is the mass of coating
agent divided by the total mass through relation (3): 1 dcoated particle¼ fcoating agent dcoating agentþ 1' fcoating agent duncoated particle ð3Þ
where di are the densities. However, the overall density measurements do not give any information on the coating quality.
Calorimetric Measurement
The mass ratio of the coating agent deposited onto the particles was determined by thermal analysis performed with a DSC 7 (Perkin Elmer, UK) apparatus. The weight
of the analyzed samples was about the thousandth part of the coated sample mass, around 5 mg. Heating curves were recorded from 20! to 90!C at the scan rate of 5!C=min, under nitrogen flow. The amount of Precirol1was then determined from relation (4):
x¼ DH
coating agent onto the sample melting
DHmeltingpure coating agent ð4Þ where x represents the mass ratio of the coating agent in the coated particles, DHmeltingcoating agent onto the sample is the heat of fusion of Precirol1 in the coated particles samples, and DHmeltingpure coating agent is the heat of fusion of Precirol1 solidified via the supercritical fluid process.
In addition, the coated particles were observed using an ESEM XL 30 FEG (Philips, Netherlands).
Results and Discussion
Coating of the Sieved Glass Beads
The glass bead coating experiment was repeated three times under identical experi-mental conditions to quantify a standard deviation, thus obtaining information in terms of process repeatability. Due to time constraints and application requirements, further repeatability experiments could not be performed. The sieved fraction stud-ied here is less than 20 microns. The true densities, the corresponding coating agent= glass bead mass ratio, and the same ratio determined by DSC are shown in Table 1. Table 2 gives the absolute and relative deviations; the relative deviation is defined as the absolute deviation divided by the mean value. The mass ratios obtained accord-ing to both methods are rather different (Table 2). True density measurements were performed on the whole sample, whereas DSC analysis was done on a sample repre-senting only a thousandth of the whole sample mass without taking the excess Precirol1 crystallized alone, which spontaneously segregates. Thus, true density gives information on the whole Precirol1sample but DSC better quantifies the Pre-cirol1deposited onto the particles. As for the relative deviations, that for the DSC results is greater than that for the density measurements. In DSC analysis, the error arising from the inhomogeneity of the sample is taken into account, which is not the case for density measurement. In any case, if we consider only the mass ratio quanti-fication, the reproducibility of the process is rather poor. Considering the particle size measurements, the three trials done on the coated 20–30 microns sieve fraction are shown in Figure 3(a). Accumulating the errors due to the analysis method and the three trials, a relative deviation of 5.3% (0.6%trialsþ 4.6%analysis) was found for the mean volume diameter and 3.4% (1.0%trialsþ 2.4%analysis) for the median diameter. Here the reproducibility of the process is reasonable, although it could be improved. In order to analyze the coating of the different particle size distributions, the particle size analysis results are shown in Figures 3(a)–(d). The volume median diam-eters D50 and the spans are in Table 3. The span is defined by the relation
(D90-D10)=D50 and characterizes the width of the distribution (Allen, 1997). The
spans remain unchanged for the coated particles above 20 microns compared to the uncoated particles; the span variation is less than 20%. This would mean that the particles are individually coated. In contrast, if one considers the distribution
Table 1. True densities and mass percent of coating agent measured for the raw materials used and the coated samples Sample Uncoated glass beads Precirol 1 solidified via supercritical process Coated glass beads, trial 1 øbeads < 20 m m Coated glass beads, trial 2 øbeads < 20 m m Coated glass beads, trial 3 øbeads < 20 m m True density (g = cm 3 ) 2.45 0.99 1.78 1.78 1.89 Precirol 1 determined by true density (% w = w) 0 100 29.9 29.9 23.4 D Hfus (J = g) — 114.3 22.8 13.8 27.4 Precirol 1 determined by DSC (% w = w) — 100 19.9 13.8 23.9
under 20 microns, the span is modified with a variation of more than 40%. It will be shown later that this can reasonably be attributed to agglomeration effects. In all cases, after coating the median diameter is shifted towards higher values.
The mass ratios of Precirol1contained onto the samples and evaluated by calor-imetry are listed in Table 4. Assuming that the mean surface diameter was close to the mean volume diameter, which is normally the case for spherical particles, the spe-cific surface area of the uncoated glass beads was calculated by the following relation: S0 ¼ 6 D½3; 2#$ 1 densitybeads ð5Þ
Knowing the specific surface area of each size class of beads and the mass ratio of Precirol1 deposited onto the particles, it is then possible to determine the volume of coating agent deposited onto particles versus the available surface area. The resulting calculations are presented in Table 4 and Figure 4.
The results show a good linear correlation between the calculated surface area and the quantities of Precirol1 deposited onto the different bead sizes, except for the smallest particles. This implies coating of individual particles. In contrast, the correlation is not valid for the highest specific surface area, which may be due to an agglomeration effect simultaneous with the coating. The results are in agreement with the span values before and after coating.
Table 2. Reproducibility of the process
Sample Coated glass beads, trial 1 øbeads< 20mm Coated glass beads, trial 2 øbeads< 20mm Coated glass beads, trial 3 øbeads< 20mm
Average Precirol1 determined by true density (% w=w)
27.7' 3.0 Relative deviation on true
density measurements
10.9
Average Precirol1 determined by DSC (% w=w)
19.2' 4.1 Relative deviation on DSC
measurements
21.6
Table 3. Granulometric parameters of the uncoated and coated glass beads Uncoated glass beads Coated glass beads Sieved class (mm) D[4,3] (mm) D50 (mm) Uncoated glass beads span D[4,3] (mm) D50 (mm) Coated glass beads span 20 17.1 13.4 1.9 17.0' 1.3 16' 1 1.06' 0.08 20–30 27.5 27.2 0.53 28.9' 0.1 29.3 ' 0.3 0.51' 0.12 30–40 32.3 31.9 0.43 39.4' 1.3 36.9 ' 3.6 0.46' 0.02 40–55 45.9 45.9 0.36 50.4' 0.8 51.2 ' 1.1 0.43' 0.02 55–80 59.5 59.3 0.37 64.7' 1.7 65.4 ' 1.5 0.41' 0
As for the obtained mass ratios, they vary between 0.26 for the largest glass beads to 0.37 for the smallest ones. These values may be compared to initial ratio of 0.66. Hence, a significant amount of excess coating agent is found.
However, these size measurements do not give any information on the homogen-eity of the coating layer on the particles. The ESEM pictures presented in Figure 5 provide insight into the deposition of Precirol1onto the surfaces of the glass beads. A representative coating of the beads displaying the linear correlation is shown in Figures 3(b) and 3(d). It seems to be relatively homogeneous and differs completely from a physical mixture of both components (Figure 5(c)). This means that the
Figure 3. Cumulative percent volume versus mean diameter of the coated particles of the sieved cut glass beads by a supercritical process (a) 20–30mm; (b) 30–40 mm; (c) 40–55 mm; (d) 55–80 mm.
Table 4. Quantification of the Precirol1 deposited onto the glass beads Coated glass beads Coating quantification Sieved class II (mm) D[4,3] (mm) Scalculated (m2=g) Precirol1 (% wt) R (m Precirol1= m glass beads) cm3Precirol1= m2glass beads 20 17.5! 0.8 0.14 22.9! 4.8 0.369 2.60 20–30 28.8! 0.1 0.09 23.4! 10.1 0.305 3.47 30–40 39.4! 1.3 0.07 24.1! 2.4 0.317 4.23 40–55 50.4! 0.8 0.06 22.3! 1.8 0.287 5.22 55–80 62.9! 2.6 0.04 20.8! 0.9 0.263 6.40
coating is not just a deposit of solid Precirol1 onto glass beads but implies a simul-taneous solidification=deposition phenomenon onto the bead surfaces.
This statement is confirmed by Fourier transform-infrared (FT-IR) spectral analysis. The coated sample is compared to a physical mixture of Precirol1, solidi-fied via SCF process, and glass beads. The corresponding spectra are shown in Figure 6. The spectrum of physical mixture is qualitatively different from that of the coated glass beads. The most relevant difference is located near 800–900 cm'1 region: the physical mixture presents the peak due to glass beads alone whereas the coated sample does not. The absence of this on the coated sample spectrum can be due to a deposit of Precirol1onto the glass beads surface.
Coating of the Active Compound
The experiment for coating the active compound (AC) was performed twice since we have already estimated the relative and absolute deviations on the process with the previous glass beads experiments. The measured true densities are shown in Table 5.
Figure 4. Volume of Precirol1 deposited onto the particles vs. specific surface area of the coated particles.
Figure 5. ESEM pictures of (a) uncoated glass bead( 1600, (b) glass bead coated by supercri-tical fluids process( 1600, (c) physical mixture ( 5194, (d) general view of coated glass beads( 200.
Cumulative particle size distributions are shown in Figure 7. The D[4;3] and span results for the AC are given in Table 6.
The cumulative size curves show that, in this case, the width of the coated par-ticle size distribution is slightly decreased compared to the uncoated parpar-ticles. The ESEM pictures in Figure 8 confirm that the uncoated particles are very polydis-persed. Furthermore, the coated particles tend to be agglomerated. In fact, there are more coated agglomerates than coated individual particles. In this case, agglom-eration may occur before coating between the AC particles and during coating. The obtained mass ratio is here around 0.59, which is near the initial one, the excess coat-ing agent contributcoat-ing here to agglomeration.
If one measures the specific surface area of the AC alone using nitrogen adsorp-tion-based apparatus and if we calculate the volumes of Precirol1deposited per sur-face area, one obtains, respectively, 0.71 m2=g and 0.45 cm3Precirol=m2glass beadfor trial
1 and 2.11 cm3Precirol=m2glass bead. for trial 2. These latter results suggest a poor
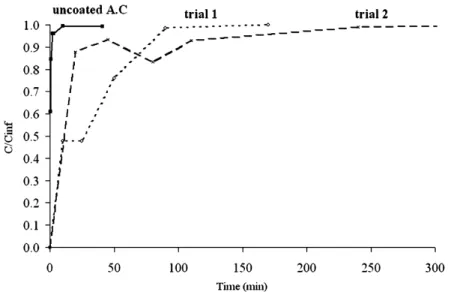
repro-ducibility of the experiments with this type of particle. Considering the relative devi-ation on the mass ratio determined by DSC measurement and given in Table 6, the poor reproducibility is confirmed. It may be mainly due to an uncontrolled agglom-eration phenomenon, indicating that the more dispersed the size distribution, the more important the agglomeration. However, dissolution tests performed in distilled water at room temperature showed that the coating is effective since a sustained release is observed for the coated active compound (Figure 9).
Figure 6. FT-IR spectra of the physical mixture and the coated particles.
Table 5. True densities measured for the coating of AC
Sample Uncoated AC Precirol1 solidified via supercritical process Coated AC, trial 1 True density (g=cm3) 1.215 0.99 1.14
Conclusions
In this study, several complementary analytical measurements were performed to study the feasibility of a new solvent-free encapsulation process based on the use of supercritical CO2. Sieved fractions of microparticles in 0–80 microns size range
as well as an active compound were successfully coated. Particle size analysis showed that the larger glass bead particles seemed to be coated individually, whereas the ones having a size less than 20 microns tended to be simultaneously agglomerated. Comparing ESEM pictures of the physical mixture of both components and coated particles suggested that two phenomena occur simultaneously: solidification of the coating agent and its deposition onto the particle surface. In addition, the ESEM visualizations and FT-IR spectra of a simple physical mixture and of the coated par-ticles turned out to be quite different. The coating of an active compound resulted mainly in agglomerates, which was confirmed by both ESEM visualization and size
Figure 7. Cumulative volume size distribution of both uncoated and coated AC compounds vs. mean EAD.
Table 6. Mean volume diameter for the AC coating experiment
Materials Uncoated AC Coated AC, trial 1 Coated AC, trial 2 D[4;3] (mm) 14.9) 1.4 22.2) 1.8 26.9) 0.4 D50 (mm) 11.4) 1.8 20.7) 0.8 27.2) 2.1 Span 4.75 1.68) 1.9 1.75) 0.9 DHfus (J=g) — 24.4 60.2 Precirol1determined by DSC (% w=w) — 21.4 52.7 Precirol1determined by DSC (% w=w) — 37.1) 15.7 Relative deviation — 42.3
distribution measurement. Yet, a dissolution test showed that the coating was effec-tive in sustaining release. The reproducibility of the process turned out to be accept-able when no agglomeration of coated particles occurred, but it has to be improved in the case of highly dispersed particles less than 20 microns, mainly by limiting their agglomeration.
The characterization methods presented here show that the encapsulation pro-cess seems to be a promising route for solvent-free coating of pharmaceuticals in the micron range. Especially, as the present process treats the coating agent and par-ticles separately, this permits processing of thermosensitive products and better con-trolling the coating agent=particle ratio.
Nomenclature
ø diameter, m
DHfus heat of fusion, J=g
di density of the compound i, kg=m3
D[4,3] mean volume diameter, m D50 median diameter, m
fi mass fraction of the compound i
S0 specific surface area, m2=g
Figure 8. ESEM analysis of the (a) uncoated AC( 800 and (b) coated AC ( 1600, (c) ( 1900.
Span (D90-D10)=D50 U velocity, m=s
References
Allen, T. 1997. Particle size measurement. In Powder Sampling and Particle Size Measurement, 5th ed. vol. 1. Londres: Chapman & Hall.
Fages, J., H. Lochard, J. J. Letourneau, M. Sauceau, & E. Rodier. 2004. Particle generation for pharmaceutical applications using supercritical fluid technology. Powder Technol. 141: 219–226.
Kro¨ber, H. & U. Teipel. 2005. Microencapsulation of particles using supercritical carbon dioxide. Chem. Eng. Process. 44: 215–219.
Perrut, M. 2002. Method for encapsulating fine solid particles in the form of microcapsules. World Patent WO 02=05944 A1.
Perrut, M., J. Jung, & F. Leboeuf. 2005. Enhancement of dissolution rate of poorly-soluble active ingredients by supercritical fluid processes. Part II: Preparation of composite par-ticles. Int. J. Pharm. 288: 11–16.
Ribeiro Dos Santos, I., J. Richard, B. Pech, C. Thies, & J. P. Benoit. 2002. Microencapsula-tion of protein particles within lipids using a novel supercritical process. Int. J. Pharm. 242: 69–78.