HAL Id: hal-03153173
https://hal.insa-toulouse.fr/hal-03153173
Submitted on 26 Feb 2021HAL is a multi-disciplinary open access archive for the deposit and dissemination of
sci-L’archive ouverte pluridisciplinaire HAL, est destinée au dépôt et à la diffusion de documents
CONTENT IN GLULAM STRUCTURES
Placide Uwizeyimana, Marianne Perrin, Florent Eyma
To cite this version:
Placide Uwizeyimana, Marianne Perrin, Florent Eyma. CONTINUOUS MEASUREMENT OF MOIS-TURE CONTENT IN GLULAM STRUCMOIS-TURES. 5th international conference on structural health assessment of timber structures, Sep 2019, Guimaraes, Portugal. �hal-03153173�
5th International Conference on Structural Health Assessment of Timber Structures
25-27 September 2019, Guimarães, Portugal
CONTINUOUS MEASUREMENT OF MOISTURE CONTENT IN
GLULAM STRUCTURES
Placide Uwizeyimana1, Marianne Perrin1, Florent Eyma1 1
Institut Clément Ader (ICA), CNRS UMR 5312, University of Toulouse, UPS, 1 rue Lautréamont, 65000 Tarbes, France
Keywords: Moisture content measurement, Glulam structures, Resistive method Abstract
Introduction:
Today, a strong expansion of timber bridges is promoted by using glulam. The glulam bridges are widespread in Nordic countries but also in France. However, durability issues related to moisture content (MC) variation or wetting/drying cycles limit their development. For this reason, timber bridges supervisors have expressed their needs on continuous MC monitoring. The MC of wood is commonly determined by measuring the electrical resistance within pin electrodes in-serted in the wood. To monitor locally MC between the lamellas of glulam, a previous study car-ried out in our laboratory highlighted the feasibility of resistive measurements using surface sensors embedded in glulam joints. Nevertheless, many parameters influence these measurements and need to be explored.
Developments:
In the present study, a series of experiments was conducted to highlight main important parame-ters influencing on MC measurement with surface sensors. This study focuses on “Douglas fir” which is the most used species in glulam bridges in France due to its good mechanical resistance and natural durability. Firstly, the influence of sensor-size and spacing between sensor and spec-imen-edge was studied. Then, the influence of temperature and MC variation on the electrical resistance of wood has been evaluated. Finally, the influence of embedded sensors inside lamel-las on mechanical properties of glulam beams was also investigated.
Remarks and Conclusion:
The results obtained highlighted the most impacting parameters on MC measurement with sur-face sensors. Moreover, a calibration curve expressing the MC as a function of the electrical re-sistance of wood was obtained. The influence of embedded sensors on mechanical properties was also studied to validate the instrumentation of glulam beams. Future work will focus on the influ-ence of wetting/drying cycles on mechanical integrity of glulam beams.
1 INTRODUCTION
In recent decades, the use of timber in civil engineering has become an interesting solution to the issues of sustainable development. Advantageous properties such as renewability, sus-tainability and high ratio strength to weight make the timber an excellent material to use in sustainable construction. The use of this material has been steadily increasing in recent times due to advances in engineered wood, especially the manufacturing of glue-laminated (glulam) timber.
However, durability issues related to moisture content (MC) variation or wetting/drying cycles limit the development of timber bridges. Indeed, the wood is a hygroscopic material, his behavior is affected by a change of temperature and moisture content. For the glulam beams, the problems of delaminations, cracks, dimensional stability due to swelling/ shrink-age have been observed [1, 2, 3]. For this reason, timber bridges supervisors have expressed their needs on continuous MC monitoring [4]. The aim of MC monitoring is to inform the bridges supervisors as early as possible of the damage risk so that appropriate maintenance operations and reinforcement can be planned. Recent studies have shown a great potential of resistive methods for MC measurement using pins electrodes inserted in wood [5, 6, 7]. A previous study carried out in our laboratory highlighted also the feasibility of resistive meas-urement using surface electrodes embedded in glulam joints for MC monitoring insides lamel-las [8].
Nevertheless, many parameters such as the size of electrodes, spacing between electrode to specimen-edge and temperature can influence MC measurements. However, none have been specifically determined for surface electrodes. Knowing that the electrical resistance of wood is related to its MC, in this paper, a series of experiments was designed to investigate the main important parameters influencing on electrical resistance of wood and MC monitoring using surface electrodes. It can be noted that the magnitude of electrical resistance depends not only the type of electrode, but also on wood species [9, 10]. This study focuses on “Douglas fir” which is the most used species in glulam bridges in France due to its good mechanical re-sistance and natural durability [3].
The first test was performed to determine the influence of electrode-size on the measured resistance. Then, once the size of the electrodes determined, the influence of spacing between electrode and specimen-edge on the electrical resistance was evaluated. The influence of tem-perature on the measured resistance has then been investigated. Finally, a calibration curve was obtained to correlate electrical resistance to the MC of wood. In the light of further work on durability of glulam beams, the effect of electrodes between lamellas on mechanical prop-erties of glulam beams was also evaluated.
2 MATERIALS AND METHODS
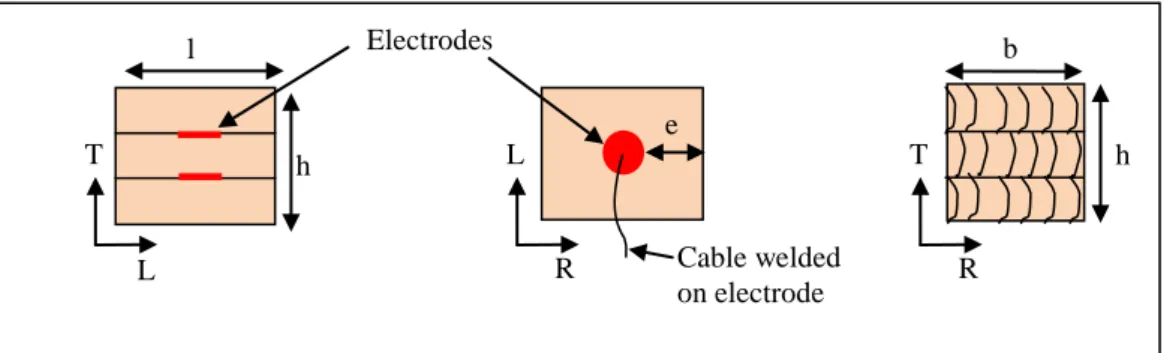
This study was based on glulam specimens made of three lamellas. The latter were cut from the same board of Douglas fir (Pseudotsuga menziesii) to reduce the wood variability. The glulam specimens were glued using polyurethane glue (KLEIBERT PUR 510 FiberBond) and pressed with a bonding pressure of 10 bars during 8 hours. The surface electrodes “copper patches” embedded between lamellas were used as MC sensors. They were stuck directly with their own adhesive layers on the timber. The cables (stripped at the end) for resistance meas-urements were then welded to the centre of the electrodes. The details of instrumentation are shown in Figure 1. A measurement device capable of measuring electrical resistance up to several tens of Giga-Ohms has been developed and used for resistance measurements. In fact,
Continuous measurement of moisture content in glulam structures
SHATiS’19 – Structural Health Assessment of Timber Structures 3
a voltage is applied across two electrodes stuck on the timber and the electrical resistance is measured in the tangential direction of wood.
..
Figure 1: Instrumentation of glulam specimen with surface electrodes (example of cube specimen 30 x 30 x 30
mm3)
L, R and T indicate the anatomical directions of wood, respectively longitudinal, radial and tangential
b x h is the cross section and l represents the length of specimen e indicates the spacing between electrode and specimen-edge
3 INFLUENCE OF SENSORS-SIZE ON ELECTRICAL RESISTANCE 3.1 Special conditions of the experiment
Five electrode diameters from 10 mm to 50 mm have been tested and three specimens have been prepared for each diameter. Spacing between electrode and specimen-edge was 10 mm for all specimens to have the same boundary and limit conditions. The electrodes sizes and specimens’ dimensions are presented in Table 1. The experiment was then performed at the equilibrium MC of 55% and 98% relative humidity (RH) and a temperature of 35°C. The specimens were considered to have attained the equilibrium MC when the mass was stable according to standard NF B 51-003[11].
Table 1: Sizes of electrodes and dimensions of specimens
Electrode di-ameter [mm] Spacing electrode to specimen-edge [mm] Dimensions of specimens [mm] L R T 10 10 30 30 30 20 10 40 40 30 30 10 50 50 30 40 10 60 60 30 50 10 70 70 30
3.2 Results and discussion
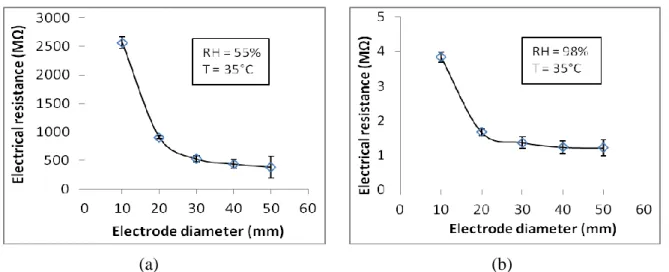
The results show that the electrical resistance decreases as the diameter of the electrode in-creases (Figure 2). For the two boundary conditions studied (55% RH and 98% RH), the trends are identical. These results are consistent with theoretical equations that relate electrical resistance to electrode dimensions [12]. On the other hand, it is interesting to note that, overall, the smaller the diameter of the electrode, the lower the standard deviation of the ments. This can be explained by the effect of wood heterogeneity on the resistance measure-ments. This test allowed choosing the diameter of the electrode for the instrumentation of glulam beams. Therefore, the electrodes of diameter 10 mm will be used in the following tests.
h b l Electrodes Cable welded on electrode e L R T L T R h
(a) (b)
Figure 2: Influence of electrode diameter on electrical resistance of wood: (a) at 55% RH and 35°C; (b) at 98%
RH and 35°C
4 INFLUENCE OF SPACING BETWEEN ELECTRODE AND SPECIMEN-EDGE 4.1 Special conditions of the experiment
The effect of distance between electrode and specimen-edge was studied from 5 mm to 30 mm by increments of 5 mm. The diameter of electrode was 10 mm for all specimens. The de-tails of the specimens are presented in Table 2. The experiment was performed at the equilib-rium MC of 55% RH and 98% RH and the temperature of 35°C.
Table 2: Spacing between electrode and specimen-edge, and dimensions of specimens
Electrode di-ameter [mm] Spacing electrode to specimen-edge [mm] Dimensions of specimens [mm] L R T 10 5 20 20 30 10 10 30 30 30 10 15 40 40 30 10 20 50 50 30 10 25 60 60 30 10 30 70 70 70
4.2 Results and discussion
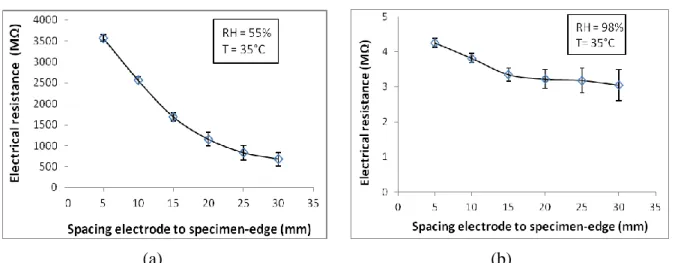
In Figure 3, the electrical resistance decreases with increasing spacing between the elec-trode and the specimen-edge. The hypothesis that is made here is that the equipotential curves are influenced by the quantity of material available between the electrode and the specimen-edge. So, more the quantity of material is limited, more the equipotential curves are concen-trated and the greater the resistance, as it can be observed from the results for two different humidity levels (55% RH and 98% RH). It can also be seen that the MC has an effect on the distribution of the equipotential curves. Indeed, the higher the MC, the lower the resistivity of the material and the less material between the specimen-edge and the electrode impacts the measurements. Regarding the standard deviation, it seems that the latter increases when the quantity of material between the specimen-edge and the electrode increases. This is certainly related to the heterogeneity of the material and the eventual MC gradients. So, for the rest of this work, a distance of 10 mm between the specimen-edge and the electrode will be used.
Continuous measurement of moisture content in glulam structures
SHATiS’19 – Structural Health Assessment of Timber Structures 5
(a) (b)
Figure 3: Electrical resistance as a function of spacing between electrode and specimen-edge: (a) at 55% RH and
35°C; (b) at 98% RH and 35°C
5 INFLUENCE OF TEMPERATURE ON ELECTRICAL RESISTANCE 5.1 Special conditions of the experiment
This test was performed to investigate how the variation of temperature affects the electri-cal resistance. Five specimens measuring 30 x 30 x 30 mm3 were used. Each specimen was equipped with surface electrodes for resistance measurement and with a thermocouple for temperature (Figure 4). The specimens were conditioned to 65% RH and then insulated with protective coating (M-Coat C Silicone Rubber) to avoid drying when temperature is changed. They were then placed in climate chamber, and the temperature was increased from -10°C to 40°C by increments of 10°C. The temperature inside specimen was controlled with the ther-mocouple, and the electrical resistance was measured when the temperature in wood was equal to the climate chamber. It can be noted that the mass of specimens was controlled to ensure no MC modification.
Figure 4: Specimen instrumentation for influence of temperature 5.2 Results and discussion
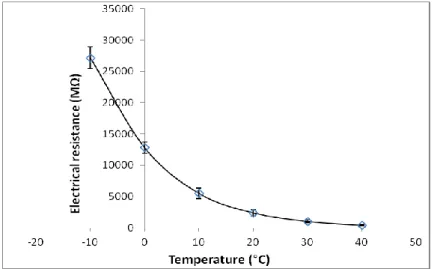
Very often in the literature, studies concerning the influence of temperature on the re-sistance measurements are carried out without considering the MC variation induced by the variation of temperature. In order to solve this problem, tests were carried out by isolating the specimens with a resin (M-COAT C Silicone Rubber) allowing keeping a constant MC in the wood and allowing the temperature transfer. The results of this study show clearly a logarith-mic decrease in electrical resistance as temperature increases (Figure 5). This effect has al-ready been observed by several authors [13, 14] on different types of materials. They showed
Thermocouple
Specimen with coating (
Cable welded on the electrodes
that the conduction of electric charges is activated by the increase of the temperature. As re-sult, the resistance to the electric current decreases. The curve obtained for this test will there-fore allow us to make a correction to the calibration curve established at a constant temperature with surface electrodes. Moreover, it can be noted that the standard deviations decrease with the increase of temperature.
Figure 5: The electrical resistance as a function of temperature at 65% RH 6 CALIBRATION CURVE MC VERSUS ELECTRICAL RESISTANCE 6.1 Special conditions of the experiment
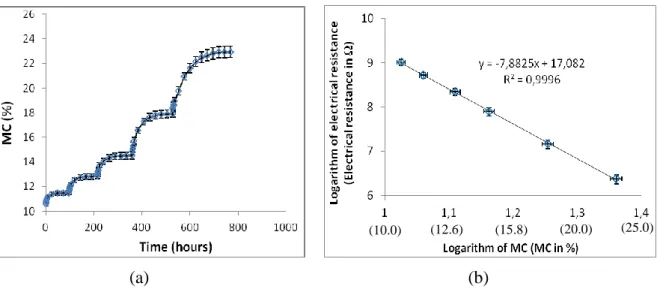
The electrical resistance of wood decreases with increasing MC. This has been known for long time [15, 16, 17]. Many investigations have been done over the years to establish a rela-tionship between electrical resistance and MC. However, very few of these were made with surface electrodes. This test was performed to determine the calibration curve on Douglas fir with surface electrode of diameter 10 mm embedded in a center of specimen. Ten specimens measuring 60 mm long and section of 30 x 30 mm² were used. The experiment was performed in climate chamber with six climate levels from 50% RH to 98% RH at 35°C (Table 3). From level to another, the mass and the resistance were measured every 24 hours up to the stabiliza-tion of mass according to the standard EN ISO 12571 [18].
Table 3: Conditioning levels in climate chamber for calibration curve
Relative humidity [%] Temperature [°C]
50 35 60 35 70 35 80 35 90 35 98 35
6.2 Results and discussion
The MC of specimens are calculated after determination of the anhydrous mass according to standard EN 13183-1 [19] (Figure 6 (a)). The measurements of electrical resistance made at the equilibrium MC for each level were used to determine the calibration curve. The curve presented in Figure 6 (b) shows the evolution law of the resistance as a function of the MC of
Continuous measurement of moisture content in glulam structures
SHATiS’19 – Structural Health Assessment of Timber Structures 7
important for low MC than for high MC. The calibration curve obtained will be used in future works to estimate MC from the resistance measurements with surface electrodes.
(a) (b)
Figure 6: (a) Equilibrium MC for calibration levels; (b) logarithm of electrical resistance as a function of
loga-rithm of MC
7 INFLUENCE OF EMBEDDED SENSORS ON MECHANICAL PROPERTIES OF GLULAM BEAMS
7.1 Special conditions of the experiment
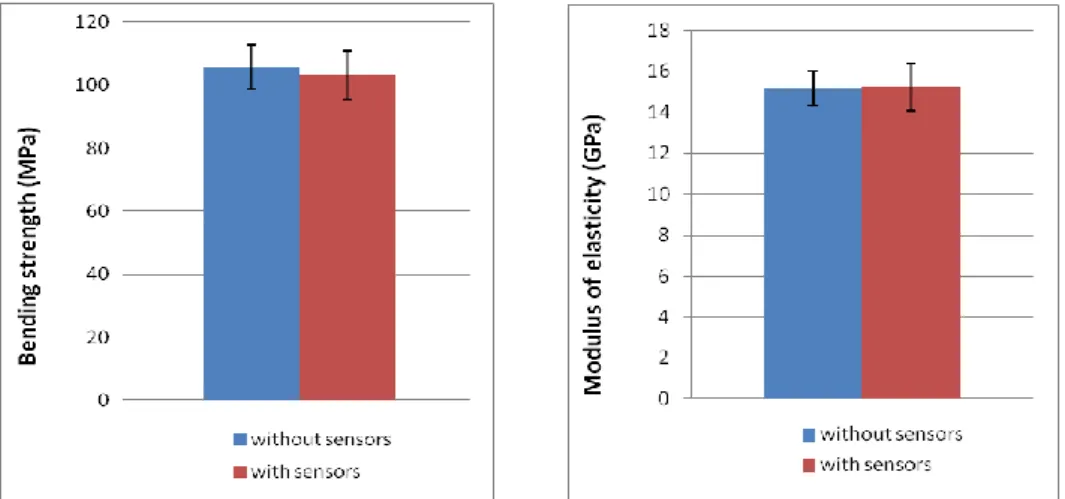
The objective of this test was to evaluate the effect of embedded sensors on the bending strength (BS) and the modulus of elasticity in bending (MOE) of glulam. To achieve that, four-point bending test was conducted on ten specimens with surface electrodes of diameter 10 mm (Figure 7) and ten specimens without electrodes. Each glulam specimen was made of three lamellas and measuring 480 mm long with cross-section of 30 x 30 mm². They were then conditioned at 65% RH and 20°C for two weeks to have equilibrium MC before bending tests.
Figure 7: Electrodes positions between two lamellas for instrumented specimens
The experiment consisted of carrying out four-point bending tests arranged in accordance with EN 408 [20] using the testing machine MTS with a cell capacity of 100 kN. The test was conducted at a speed of 5.4 mm/min, and the deflection allowing to calculate the MOE was measured with a Solatron LVDT displacement sensor (Figure 8). The BS and MOE were de-termined according to the standard EN 408 [20].
240 mm 30 mm
Bonding section between lamellas
Surface electrode Cable
Figure 8: Four-point bending test and LVDT sensor 7.2 Results and discussion
Figure 9 shows the comparison of the mechanical properties (BS and MOE) between the specimens with and without sensors. The average values obtained are in agreement with the literature. According to Gerard et al. [21], the BS of Douglas is between 70 and 100 MPa and the MOE between 11 and 16.8 GPa. Considering the average values and the standard devia-tions obtained on the specimens with and without sensors, it is observed that there is no sig-nificant difference for these two configurations. Consequently, the embedded sensors have no influence on the mechanical properties of the instrumented glulam beams. For information, the total section of the three electrodes used represents 1.64% of bonding section.
Figure 9: Comparison of the BS and MOE for specimens without sensors and specimens with sensors 8 CONCLUSIONS
This study was carried out to highlight the main parameters influencing the measurements of electrical resistance and as a result of MC in glulam using surface electrodes. The experi-ments highlighted the following conclusions:
1. The size of the electrodes and the distance between the electrode and the specimen-edge affect the measurements of electrical resistance. It should therefore be noted that the cal-ibration curve of resistance versus MC, must then mention the size of electrodes used. Moreover, the findings might not be transferable to other size without correction. 2. The electrical resistance is highly decreases when the wood temperature increases.
Therefore a correction is necessary for the MC measurements in the climate of variable temperature.
3. A calibration curve is defined to obtain the MC of Douglas fir from the electrical re-LVDT sensor
Continuous measurement of moisture content in glulam structures
SHATiS’19 – Structural Health Assessment of Timber Structures 9
4. The surface electrodes embedded between lamellas do not affect the mechanical re-sistance of glulam beams.
This study allowed validating the use of surface electrodes as a reliable system for MC measurement between lamellas of glulam beams. Future work will focus on the influence of wetting/drying (W/D) cycles on the mechanical integrity of glulam beams with embedded sensors for MC monitoring. Some accelerated W/D cycles and tests in an outdoor environ-ment will be carried out. Subsequently, the influence of aging on the mechanical properties will be evaluated. Currently, a wireless system able to send MC data to the acquisition center is developed. This technology will then be used in timber bridges monitoring.
ACKNOWLEDGEMENTS
This work has been funded by la Région Occitanie, la Communauté d’Agglomération Tarbes-Lourdes-Pyrénées and IUT de Tarbes. The authors would also like to thank the De-partment GEII (electrical engineering and industrial computing), in particular, Emmanuel Laügt for his contribution in developing the measurement devices. The contribution of Frédéric Leroy in experimentation is acknowledged.
REFERENCES
[1] Dietsch, P., Gamper, A., Merk, M., Winter, S. 2014. “Monitoring Building Climate and Timber Moisture Gradient in Large-Span Timber Structures”. J. Civ. Struct. Health Monit. 5:153–165.
[2] Angst-Nicollier, V. 2012. ”Moisture Induced Stresses in Glulam”. PhD Dissertation Nor-wegian University of Science and Technology, Trondheim, Norway.
[3] SETRA, 2006. “Les Ponts en Bois: Comment Assurer leur Durabilité. (Timber Bridges: How to Ensure their Durability)”. SETRA (Service d’Etudes Technique des Routes et Auto-routes), France, ISBN: 9782110946553.
[4] Kasal, B. 2013. “Assessment, Reinforcement and Monitoring of Timber Structures–COST FP1101”. Adv. Mater. Res., 778:1037–1040.
[5] Dietsch, P., Franke, S., Franke, B., Gamper, A., Winter, S. 2014. “Methods to Determine Wood Moisture Content and their Applicability in Monitoring Concepts”. J. Civ. Struct. Health Monit. 5:115–127.
[6] Bjorngrim, N., Hagman, O., Wang, X. 2016. “Moisture Content Monitoring of a Timber Footbridge”. BioResources 11:3904–3913.
[7] Koch, J., Simon, A., Arndt, RW. 2016. “Monitoring of Moisture Content of Protected Timber Bridges”. In Proceedings of WCTE 2016 (World Conference on Timber Engineering), Vienna, Austria.
[8] Li, H., Perrin, M., Eyma, F., Jacob, X., Gibiat, V. 2017. “Moisture Content Monitoring in Glulam Structures by Embedded Sensors via Electrical Methods”. Wood Sci. Technol. 52:733-752.
[9] James, WL. 1963. “Electric Moisture Meters for Wood”. Department of Agriculture, For-est Service, ForFor-est Products Laboratory, Madison, Wisconsin.
[10] Brischke, C., Rapp, AO., Bayerbach, R. 2008. “Measurement System for Long-Term Recording of Wood Moisture Content with Internal Conductively Glued Electrodes”. Build Environ 43:1566–1574
[11] AFNOR, 1985. “NF B 51-003, General Requirements for Physical and Mechanical Tests”
[12] Menguy, R. 1997. “Mesure des Caractéristiques des Matériaux Isolants Solides”. Tech-niques de l’Ingénieur, D 2310.
[13] Davidson, R.W. 1958. “The Effect of Temperature on the Electrical Resistance of Wood”. For. Prod. J. 8:160-164
[14] Clark, J.D., Williams, J.W. 1932. “The Electrical Conductivity of Commercial Dielec-trics and its Variation with Temperature”. J. Phys. chem. 37:119-131
[15] Stamm, AJ. 1927. “The Electrical Resistance of Wood as a Measure of its Moisture Con-tent”. Ind Eng Chem 19:1021–1025
[16] Skaar, C. 1964. “Some Factors Involved in the Electrical Determination of Moisture Gradients in Wood”. For. Prod. J. 14:239–243
[17] Dai, G., Ahmet, K. 2001. “Long-Term Monitoring of Timber Moisture Content Below the Fiber Saturation Point using Wood Resistance Sensors”. For. Prod. J. 51:52–58
[18] AFNOR, 2000. “EN ISO 12571, Hygrothermal Performance of Building Materials and Products -- Determination of Hygroscopic Sorption Properties”
[19] AFNOR, 2002. “EN 13183-1, Moisture content of a piece of sawn timber - Part 1: de-termination by oven dry method”
[20] AFNOR, 2012. “NF EN 408, Timber Structures - Structural Timber and Glued Laminat-ed Timber - Determination of Some Physical and Mechanical Properties”
[21] Gérard, J., Guibal, D., Paradis, S., Vernay, M., Beauchêne, J., Brancheriau, L., Thibaut, A. : Tropix 7 (Version 7.5.1), CIRAD, https://doi.org/10.18167/74726f706978, 2011