UNIVERSITÉ DU QUÉBEC
À
MONTRÉALv
ARlABILITÉ DE LA TEMPÉRATURE DE SURFACEET DU COUVERT DE GLACE DE MER DANS LE DÉTROIT DE FRAM AU COURS DES DEUX DERNIERS MILLÉNAIRES
MÉMOIRE PRÉSENTÉ
COMME EXIGENCE PARTIELLE
DE LA MAÎTRISE EN SCIENCES DE LA TERRE
PAR
SOPHIE BONNET
VARIABILITY OF SEA-SURFACE TEMPERATURE. AND SEA-ICE COVER IN THE FRAM STRAIT
OVER THE LAST TWO MILLENNLA
THESIS PRESENTED
AS PARTIAL REQUIREMENT FOR A M.Sc. IN EARTH SCIENCES
BY
SOPHIE BONNET
UNIVERSITÉ DU QUÉBEC À MONTRÉAL Service des bibliothèques
Avertissement
La diffusion de ce mémoire se fait dans le respect des droits de son auteur, qui a signé le formulaire Autorisation de reproduire et de diffuser un travail de recherche de cycles
supérieurs (SDU-522 - Rév.01-2006). Cette autorisation stipule que «conformément à
l'article 11 du Règlement no 8 des études de cycles supérieurs, [l'auteur] concède à
l'Université du Québec à Montréal une licence non exclusive d'utilisation et de publication de la totalité ou d'une partie importante de [son] travail de recherche pour des fins pédagogiques et non commerciales. Plus précisément, [l'auteur] autorise l'Université du Québec à Montréal à reproduire, diffuser, prêter, distribuer ou vendre des copies de [son] travail de recherche à des fins non commerciales sur quelque support que ce soit, y compris l'Internet. Cette licence et cette autorisation n'entraînent pas une renonciation de [la] part [de l'auteur] à [ses] droits moraux ni à [ses] droits de propriété intellectuelle. Sauf entente contraire, [l'auteur] conserve la liberté de diffuser et de commercialiser ou non ce travail dont [il] possède un exemplaire.»
Ce mémoire de maîtrise est rédigé sous forme d'un article scientifique qui sera soumis à la revue Marine Micropaleontology. Par conséquent, la langue anglaise est utilisée et la mise en forme respecte les exigences de Marine Micropaleontology et non celle d'un mémoire de l'Université du Québec à Montréal. Les tableaux et les figures sont placés à la suite des références. Mme Anne de Vernal, chercheure et professeure au département des Sciences de la Terre et de l'Atmosphère de l'UQÀM aparticipé à la rédaction de cet article.
REMERCIEMENTS
Je remercie sincèrement ma directrice de recherche, Mme Anne de Vernal qui a su me donner ma chance quand je suis arrivée au Canada en m'accueillant dans son laboratoire. Elle m'a fait découvrir un domaine de recherche passionnant et m'a donné l'envie de continuer. Aussi, elle m'a permis de mieux connaitre le milieu de la recherche scientifique en participant, entre autres, à différents congrès internationaux et à une campagne océanographique dans le détroit de Fram en Août 2008. Ses encouragements et sa disponibilité, malgré un emploi du temps très chargé, m'ont été très précieux. Je la remercie également pour son soutien financier. Un énorme merci à Maryse Henry, technicienne, et Taoufik Radi, post-doctorant, au GEOTOP, pour leur aide, conseils, soutien, enthousiasme et patience. Je remercie les étudiants, les chercheurs et le personnel du GEOTOP qui m'ont aidée tout au long de la maîtrise, notamment Claude Hillaire-Marcel et Bassam Ghaleb pour leur aide dans la chronologie et le 210Pb et Linda Genovesi "Œil de Lynx" pour la lecture finale. Finalement, un merci tout particulier à ma mère qui m'a toujours motivée et soutenue tout au long de mes études.
TABLE DES MATIÈRES
AVANT-PROPOS .iii
REMERCIEMENTS .iii
LISTE DES FlGURES vi
LISTE DES TABLEAUX .ix
RÉSUMÉ x
INTRODUCTION GÉNÉRALE 1
CHAPITRE 1
VARIABILITY OF SEA-SURFACE TEMPERATURE AND SEA-ICE COVER IN
THE FRAM STRAIT OVER THE LAST TWO MILLENNIA .10
Abstract. 11
1. Introduction 12
2. Modern oceanic setting 13
3. Material and methods 15
4. Results
4.1. Dinocyst assemblages in surface sediments from the Nordic Seas .18 4.2. Core JM04
4.2.1. Chronology 19
4.2.2. Dinocyst record .20
4.2.3. Quantitative reconstructions of sea-surface conditions .22
5. Discussion 24
6. Conclusion 27
7. Acknowledgements 28
CONCLUSION GÉNÉRALE .52 APPENDICE A
TABLEAUX DECOMPfAGES ET CONCENTRATIONS DES PALYNOMORPHES TERRESTRES ET MARINS DE LACAROTIE JM--ü6-WP-04-MCB 55 APPENDICEB
TABLEAUX DE COMPfAGES ET CONCENTRATIONS DES PALYNOMORPHES TERRESTRES ET MARINS DES ÉCHANTIllDNS DE SURfACE DES MERS
NORDIQUES (pROfONDEUR: 0-1 CM) 63
LISTE DES fiGURES
Figure
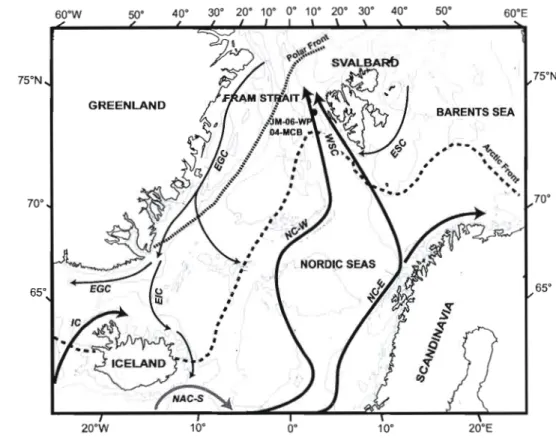
1. Location of core JM-06-WP-04-MCB (JM04; 78.92°N, 6.77°E, waterdepth: 1497 m, core length: 54 cm) and trajectories of main ocean surface currents (cf. Hansen and 0sterhus, 2000). Thick arrows depict warm currents and thin arrows, cold currents. Respectively, the dashed line and dotted line represent the Arctic and Polar Front, which are associated to the maximum sea-ice extension in winter and summer as defined from the 1953-2001 data set provided by the National Snow and Ice Data Center (NSIDC, 2001). Isobaths correspond to 200,1000 and 3000 m. EGC: East Greenland Current, EIC: East Icelandic Current, ESC: East Spitsbergen Current, NC-E: eastern branch of the Norwegian Current, NC-W: western branch of the Norwegian Current, WSC: West Spitsbergen Current, NAC-S: southern branch of the
North Atlantic Current, IC: Irminger Current.. .36
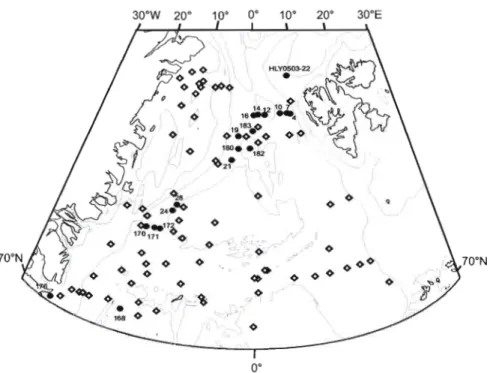
Figure 2.
Location map of the surface sediment sampi es used for canonical correspondence analysis (cf. Figure 6). Diamonds: data from de Vernal et al. (2005); circles: data from new reference sites (cf. Table 1). Isobaths correspond to 200, 1000and 3000 m 37
Figure 3. a)
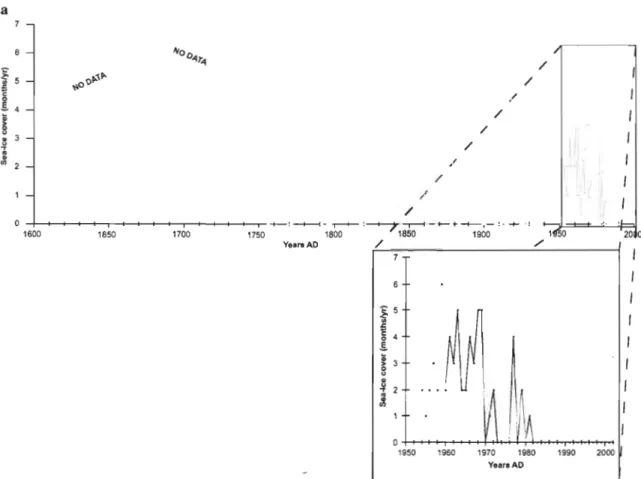
Modern sea-ice coyer with concentration greater than 50% as a function of years AD at the site of core JM04 (black curve). Data from 1953 to 2001 are provided by the NSIDC (2001). On the left, the histogram represents historical records of sea-ice coyer with concentration greater than 30% as a function of years AD with a 30-year average (AD 1596 to 2002). On the right, the grey curve illustrates historical records for the period AD 1953-2002. Data are compiled from ACSYS (2003). Note the important variability of sea-ice coyer and its absence since 1982. b) Historical sea-ice records for the period AD 1900-2002 and mean annua! (black curve) and mean winter (December to March; grey curve) air temperature anomalies (OC) between 1901 and 1995 in this area (75-800N; 5-11°E). Annual and winter temperatures are, respectively, -8.35±1.57°C and -16.03±2.92°C. .38
Figure 4.
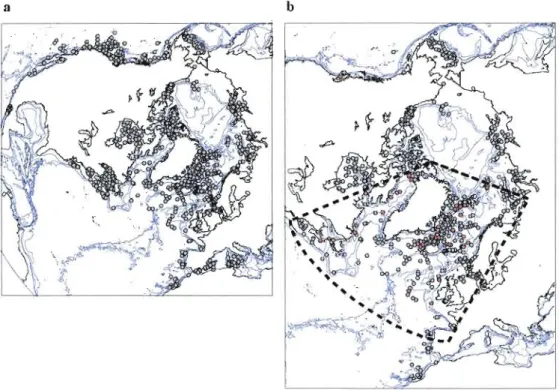
Location map of surface sediment samples used to reconstruct past sea surface conditions from dinocyst assemblages in core JM04. a) Reference database used for MAT (n=1208 sites). b) Calibration databases for ANN: one includes ail sites from the North Atlantic and Arctic (n=735 sites). The other one includes sites from the area delimited by the dashed line (n=437 sites), as defined from the bestFigure 5.
Percentage diagram of dinocyst taxa in surface sediment samples ranked by latitude (cf. Figure 2 for location). Different scales were used for dominant and accompanying taxa. Percentages of taxa with occasional occurrence lower than 1% are not reported. Dinocyst concentrations and modern sea-surface conditions (cf. National Ocean Data Center (NODC) and NSIDC, 2(01) are indicated on the right ofthe diagram 41
Figure 6.
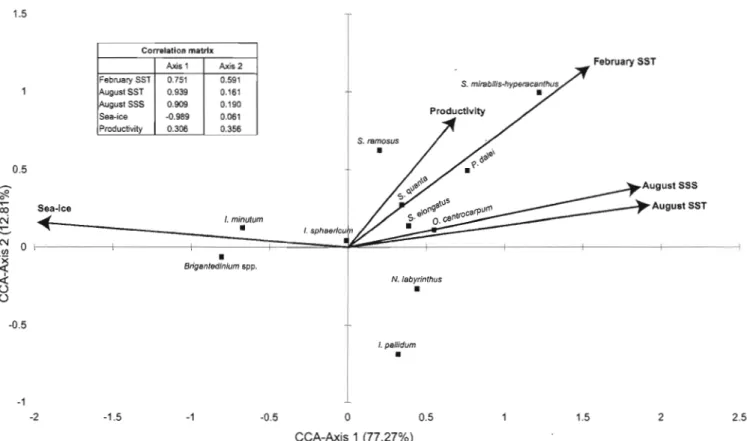
Results of CCA analysis. Ordination diagram of dinocyst taxa and environmental variables according to axis 1 and 2, and Pearson cross-correlation matrix between these two axes and hydrographical parameters. This analysis was performed with the XLSTAT software (Addinsoft, 2008), using the 94 sites (cf.Figure 2) 42
Figure
7. Geographical distribution of the scores for CCA axes 1 and 2, which represent, respectively, 77.27% and 12.81 % of the total variance. Isobaths correspondto 200, 1000 and 3000 m 43
Figure 8.
a) Ln Lead-21O excess and Cesium-137 activities as a function of depth in coreJM04. b)
Age model of coreJM04.
The five dots with error bars represent calibrated Carbon-14 ages (see Table 2). The black line shows the interpolated ages vs. depth relationship, which was used to establish the chronology in the core (Figures 9, 10 and 12). From 11.5 cm to the base of the core, we calculate mean sedimentation rate of 18 cm/kyrs. The close-up of depth vs. age for the upper 12 cm of the core shows the age model based on Lead-21O. c) Percentage of the coarse sandfraction (>106 pm) as a function of age 44
Figure 9.
a) Diagram of dinocyst taxa percentages as a function of age in coreJM04.
Different scales were used for dominant and accompanying taxa. Two assemblage zones separated by the horizontal dashed line were defined on the basis of the principal compone nt analysis calculations (cf. Figure 10). b) Dinocyst concentrations (solid line) and fluxes (dotted tine). The thick dashed line correspond to smoothed
concentration values (three-point running average) ..45
Figure 10.
Principal components1
and 2 (PC 1 andPC
2) as a function of age (left) and ordination diagram of dinocyst taxa based onPC 1
and PC 2 (right) for coreJM04
46
Figure 11.
Distribution maps of Selenopemphix quanta, Spiniferites mirabilishyperacanthus and Impagidinium sphaericum in surface sediment samples of the
northern North Atlantic. Occurrences are expressed in percentages. Isobaths
viii
Figure
12. Reconstruction of sea-surface conditions (temperatures, salinity, sea-ice cover) from dinocyst assemblages for the last 2500 years as a function of age, based on MAT and ANN techniques. The overall reference database (n=1208 sites) was used for MAT (red line), the North Atlantic and Arctic database with n=735 sites was used for ANN (blue !ine) as weil as the database delimited by the analogues with n=437 sites (dashed line) (cf. Figure 4 for calibrationdatabases). The modern values with their standard deviations are represented by !Tl ..48Table 1. Location of surface sediment sampies analyzed in the present study and
core JM04 49
Table 2. Radiocarbon ages from core JM04. The software Calib 5.0.2 (Stuiver et al., 2(00) was used for calibration with a reservoir correction of 400 years and normalization for a ô13C of -25%0 PDB (Stuiver et al., 2(00) 49
Table 3. Results of validation tests of sea-surface temperatures, salinity and sea-ice cover reconstructions based on MAT and ANN (databases of Atlantiè+Arctic sites and according to the analogues). R2 corresponds to the correlation coefficient between observed and estimated values. RMSE (Root Mean Square error) is the standard deviation of the difference between observed and estimated values. RMSEP (Root Mean Square Error of Prediction) is calculated by dividing the data base in
calibration and verification data sets .50
Table 4. Distance of the ten closest analogues for the core JM-06-WP-04-MCB as a function of depth, obtained with MAT. The threshold value for pOOf analogues is
RÉSUMÉ
Une carotte sédimentaire, couvrant les derniers 2500 ans, a été échantillonnée sur la marge continentale Ouest du Spitzberg dans le détroit de Fram (78,92°N 6,77°E, profondeur d'eau: 1497 m) avec pour objectif de reconstituer les variations hydroclimatiques à partir de l'analyse des assemblages de dinokystes. L'abondance relative des taxons de dinokystes ainsi qu'une analyse en composantes principales permet de distinguer une période de transition majeure à 300 ans cal. BP. Celle-ci est marquée par la disparition simultanée des taxons thermophiles Spiniferites mirabilis
hyperacanthus et Impagidinium sphaericum ainsi qu'une augmentation des taxons
polaires-subpolaires Impagidinium pallidum et Pentapharsodinium dalei. Les températures de surface estimées suggèrent des conditions plus chaudes que celles de l'actuel (moyenne de 7°C en Été, soit une anomalie d'environ +2°C) jusqu'à 300 ans cal. BP malgré plusieurs phases de refroidissement vers 1700, 1500, 1200 et 800 ans cal. BP. Les derniers 300 ans se caractérisent par une tendance au refroidissement, avec des températures d'Été chutant de 7,6 à 3,s°C et un couvert de glace de mer atteignant 7 mois/an. Les résultats obtenus montrent que le couvert de glace de mer et la température de surface océanique dans la région du détroit de Fram sont sensibles aux variations hydroclimatiques, principalement liées au débit relatif des eaux chaudes et salées du courant Nord Atlantique pénétrant à l'Est et des eaux froides et dèssalées sortant de l'Arctique, à l'Ouest. Nos données mettent également en évidence un optimum thermique vers 1320 ans cal. BP qui représenterait le seul intervalle des derniers 2500 ans pouvant être un analogue des conditions modernes post-AD 2000 et se singularisant par une absence du couvert de glace de mer.
Mots clés: Holocène, mers nordiques, détroit de Fram, conditions océaniques de surface, dinokyste
Changement climatique et instabilités du climat Holocène
Les observations climatiques et hydrographiques de ces dernières décennies nous ont montré à quel point le climat est sensible aux moindres perturbations. Le dernier rapport du groupe d'experts intergouvernemental sur l'évolution du climat (GIEC, 2007) met en évidence ces instabilités climatiques et le fait que ce sont principalement les hautes latitudes qui enregistrent les changements les plus significatifs. En outre, les données satellitaires illustrent une diminution sans précédent dans J'étendue et la concentration du couvert de glace de mer arctique (cf. par exemple, http://arctic.atmos.uiuc.eduhÀI'échelledeI'Holocène,de nombreux travaux sur les hautes latitudes de l'hémisphère Nord confirment l'existence d'instabilités climatiques de basse fréquence. À titre d'exemple, en 1995, O'Brien démontra que la circulation atmosphérique au-dessus de la calotte groenlandaise variait en suivant des cycles millénaires (O'Brien et al., 1995). D'autres études menées sur les carottes de glace du Groenland (GRIP : Greenland /ce Core Project et GISP 2: Greenland /ce Sheet Project Two) ont confirmé ces instabilités avec des fluctuations séculaires à millénaires. Des observations semblables ont été faites à partir de divers enregistrements issus de carottes de glace (e.g., Ailey et al., 1997), de spéléothèmes (e.g., McDermott, Mattey et Hawkesworth, 2001), de la dendrochronologie (e.g., MacDonald et al., 2000; Bennike, 2004) et de carottes marines (e.g., Bond et al., 1997,1999; Campbell etai., 1998; Bianchi et McCave, 1999; Husum et Hald, 2004) (cf. Tableau et Figures des pages 5-9). Malheureusement, en raison de vitesses de sédimentation souvent faibles dans les milieux marins, notamment dans les régions arctiques et subarctiques, les reconstitutions paléocéanographiques manquent de résolution temporelle pour documenter les variations décennales à séculaires de l'Holocène (e.g., Hald et al., 2004).
2
Objectifs
Dans le contexte du réchauffement climatique actuel, il s'avère pertinent d'étudier les changements climatiques et océaniques récents, avec une résolution temporelle élevée, afin de mieux dissocier les cycles naturels des perturbations anthropiques. Ici, notre objectif est de développer un enregistrement haute résolution des variations hydroclimatiques pendant l'Holocène tardif dans le détroit de Fram,
à
partir de l'étude de la carotte JM-06-WP-04-MCB (JM04 dans le texte; 78,92°N 6,77°E, profondeur d'eau: 1497 m, Figure 1). Celle-ci est localisée sur le talus de la marge continentale Ouest du Spitzberg où le sédiment holocène atteint plusieurs mètres d'épaisseur (Husum, 2006). Situé entre le Groenland et le Spitzberg, le détroit de Fram fait partie des mers nordiques, une des régions les plus importantes de l'Atlantique Nord puisqu'elle constitue une zone de convergence entre les masses d'eau des océans arctique et atlantique (Figure 1). Quelques études ont été menées dans cette région mais le manque de résolution ne permet pas de distinguer ces oscillations décennales à séculaires, en particulier pour l'Holocène tardif (e.g., Hald
et al., 2004, 2007 ; Slubowska-Woldengen et al., 2(07).
Contexte océanographique
Les mers nordiques se caractérisent par la rencontre des masses d'eaux chaudes et salées du courant Nord Atlantique (CNA), s'écoulant vers le Nord-Est, et les masses d'eaux froides et dessalées du courant Est Groenlandais (CEG), qui s'écoulent vers le Sud-Ouest. Le CNA, dans le prolongement du Gulf Stream, traverse l'Atlantique via la dérive Nord Atlantique et se poursuit par le courant Atlantique Norvégien puis le courant Ouest Spitzberg. Le CNA représente un débit de 35 Sv (Krauss et al., 1987). En atteignant les hautes latitudes, celui-ci redistribue la chaleur latente accumulée au niveau de l'Équateur. Le CNA joue donc un rôle prépondérant sur le climat des régions polaires. Il joue également un rôle important sur la circulation thermohaline puisque son refroidissement hivernal rend compte de la
formation d'eau profonde dans les mers nordiques. La formation d'eau profonde dépend aussi de la densité et de la salinité des eaux de surface. Or, dans les mers nordiques, ces deux paramètres sont déterminés par les flux d'eau douce d'origine arctique. Le débit d'eau douce du détroit de Fram est estimé à environ 160 mSv réparti de la manière suivante: 80 mSv sous forme de glace et 65-95 mSv sous forme liquide (cf. Dickson et al., 2007). Toutefois, la quantification de l'exportation de glace est différente selon les études et les paramètres pris en compte, sans doute en raison d'une variabilité interannuelle élevée. Par exemple, Koenigk et al. (2006)
rapporte un flux sortant de glace de mer entre 75 et 100 mSv. Quoi qu'il en soit, le détroit de Fram semble être un secteur très sensible du système climatique, qu'il s'agisse du CNA ou des flux d'eau douce issus de l'Arctique.
Méthodes
Les conditions océaniques de surface (température, salinité, glace de mer) de la carotte JM04 sont reconstituées en utilisant les kystes de dinoflagellés (i.e.,
dinokystes) qui sont des protistes. Les dinokystes sont composés d'une paroi organique réfractaire nommée dinosporine (e.g., Kokinos et al., 1998 ; Versteegh et Blokker, 2004), ils présentent l'avantage de ne pas être affectés par la dissolution et la distribution de leurs assemblages est étroitement liée aux paramètres hydrographiques. Dans les environnements subpolaires, ils sont bien préservés dans les sédiments et leur diversité taxonomique est relativement élevée (de Vernal, Guiot et Turon, 1994; de Vernal et al., 1997,2001,2005; de Vernal et Marret, 2007; Mudie et Rochon, 2001).
Dans le but de faire les meilleures reconstitutions possibles au site de carottage, nous avons augmenté le nombre d'échantillons de la base de données de référence des dinokystes dans les mers nordiques et le détroit de Fram
à
partir de l'analyse des échantillons de surface collectés lors des campagnes océanographiques WarmPast en 2006 et 2007 (JM06-WP et JM07-WP) (Figure 2) (Husum, 2006, 2007). La base de4
données de référence des dinokystes dans les mers nordiques, présentée ici, comprend 94 sites au-dessus de 70oN. Elle a été utilisée pour analyser la distribution des assemblages à une échelle régionale et pour définir les relations avec les conditions hydrographiques modernes, le plus précisément possible (Figure 2). Ces données régionales ont été combinées avec la base de données Nord Atlantique et Arctique des dinokystes (de Vernal et al., 2005) pour la reconstitution du couvert de glace, des températures et salinités de surface, à partir de la technique des analogues modernes (MAT) et de celle des réseaux artificiels de neurones (ANN) (e.g., Guiot et de Vernal, 2007).
III
Northern Hemisphere
CPS land wilh uncertainties
EIV land with uncertainties
- - EIV land+<lCn with uncertainties
0.8
Û 0.6
g.... - - Mann and Jones~003)
Espar et al. 12002 - - Moberg el a . ( ;)
HAD Instrumental Record - CRU Insbumental Record
~
OA
E 0.2 o t: 0 ct CIl -0.2...
; -0.4!
-0.6i
-0.8 ... -1 -1·~00 1400 1600 1800 0.8 - CPS la1d-tOCn Wllh uncerta,inties===
~~::- ~~2~~ (2000) Û 0.6 - - - Mann et af. (1999) ~ - - - Jones el al. /l99é) >0 0.4 - - - - Oer1emans (m~- - - - Mann el éi. (2003 OP1imaJ Borehole 'i E 0.2 - - - - Huang el al. ( ) Sorehole
o
a
0, ...,..._", li) -0.2 -1'~
-0.4' ~ -0.6 ~ -0.8 ... -1-1fooo
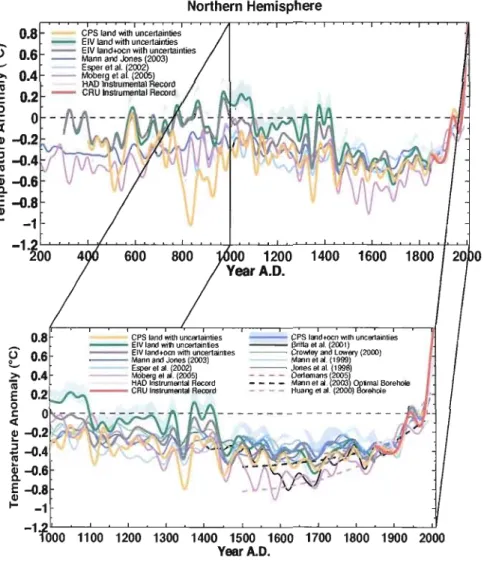
1100 1200 1300 1400 1500 1600 1700 1800 1900 2000 Year A.D.Graphique illuslrant les anomalies de températures daus
r
hémisphère Nord pour les derniers deux mille ans AD à partir d'observations, de reconstitutions et de simulations (figure empruntée au GIEC, 2007). La Période Chaude Médievale et le Petit Âge Glaciaire sont définis entre AD SOO-1500 et 1550-1850, respectivement (GIEC, 2007).6
Océan ,Arctique
Merde Barents
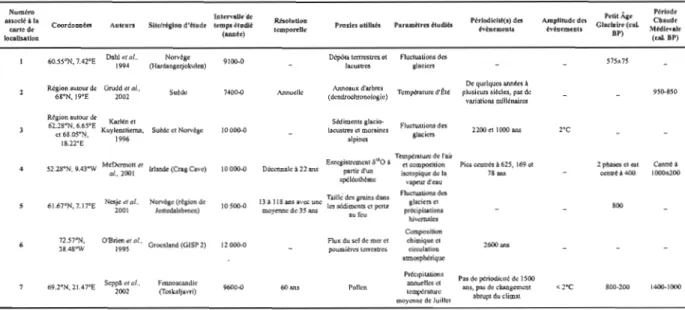
Carte de localisation de la carotte étudiée JM04 et des sites de l'Atlantique Nord auxquels il est fait référence dans le tableau. Les trajectoires des principaux courants de surface sont représentées (cf. Hansen et 0sterhus, 2000). Les flèches épaisses et en tiretés correspondent, respectivement, aux courants chauds et froids. CEG: courant Est groenlandais, CEl: courant Est islandais, COG : courant Ouest groenlandais, CES: courant Est Spitzberg, CL : courant du Labrador, GS : Gulf Stream, CI : courant d'Irnùnger, N-CNA : branche Nord du courant Nord Atlantique, N-CNA : branche Sud du courant Nord Atlantique, RH-CNA : branche Rockall-Hatton du courant Nord Atlantique, CP : courant de pente, CF : courant des îles Féroé, E-CN : branche Est du courant norvégien, O-CN : branche Ouest du courant norvégien, COS: courant Ouest Spitzberg.
Figure précédente pour la carte de localisation)
Numéro Période
lctt-n."&1Jc"de PelllÂj:e
auocléà la Résolution Pérlodlcilf(lI) des Amplhudcdn. CbIludc
CoordoDD~t:I AUleurs Sile/reglon d'élude temps élodlé Pl'OxIuutillsk Paramilm étudJ& Glaciaire (cal
ClU1e de temporelle évèncmcnl.J h~DcmcDls Médlcvalc
(année) BP)
locallsatlon (<al BP)
Dah1 et al.. Norv~gc OêpôlS tcmcstres Clt fluctuations des
60.:55"'N.7.42cE 9100-0 575±7S
1994 (Harclangerjol)ulco) lacustres glacicn
De quelques années à
Région autour d.: Grudd el al., Su~dc 7400.Q Anneaux d'azbrcs
Annuelle TcmpéralUR d'tlé plusicun; .siècles~ pas de 9So.8S0
68"N, )9cE 2002 (dendrochronologie)
vari3rions millénaires
Rtgion sulOW" de S6dÎml:nts g1l1ci()
62.2S"N.6.65"E Karll!n. el FJuet1lAtionsd"
Cl 68.0S"N, Kuylenshema. Suède cr NOTv~gc IOO()()...O \acusU'e9 et moraines 2200 et \000 ans 2'C gJaciCD
18.1rE' 1996 :llpines
• JI Tempéralute de l'aU
Dêlx--n.na1c à 22 ans Entl.'815~ent <5 0 à .et co~posilion Pies centrés à 625, 16901 2 phascs el OSI Conota 52.2S"N, 9,43"W M:~~~~l el Irlande (Crag Cave) 10000-0 partIr d'un Isotopique do:: la 78 ans centre! à 400 l00<>t2oo
spéloothème vapeur d'cau fluClualions des
13 a 118 ans a"cc une Taille' ~cs pains dans
Nesjol etai.. Norvo8e (règion de glaciers el
6J.67°N,7.17°E 10500-0 800
2001 JOSledalsbro::n) moyenne de 35 ans lcs sédi~uc;~ CI perte precipitations
hiv..'1'U:lle,
Compo,ition 72.57'"N. O'B~~~t al.. Groenland (GISP 2) Flux du sel de mer Cl chimique cl
12000-0 2600 ...
38.4S0W poussières lollTcrtrcs cirrolation
atmosphérique
Préclpil,uiOfls Pu de périodicJlé de 1500
Scppll. etaI.. Fennosc:mdie 3.D.Duellcset
69.2°N,21.47°E 2002 (Toskaljll.vri) 9600-0 60'", Pollen ICmpérarw-o:: ans, pas dc changement <2°C 800-200 1400-1000 abrupidu climal
moyc.-nne de JuillCI
Tableau de synthèse des enregistrements paléoclimatiques de j'Holocène dans le domaine océanique (voir Figure précédente pour la carte de localisation)
NY~m FirkM2t
lnltr...U.ede
anoc:liàla SIl~rIs:IoYl Pitlodlclll(.) dt. Attlpllludtdl!!l Pedl Â&e CI.c1ain Chaude
Coordoonh:1 Aukun Itroplitud~ Résol:uLlon temponlle ProxtC'lutJJl.i. Faramttru tludl"
cane de d'ilude (annfot) ,dntttleDU iV~DemtDlJ (catHP) M~itVIIlt
locallsalloD (<aI.BP)
Isotopes stablc:s ct Commence ven: 600
AIIders.<OD if M~~~~~.;ge Tempérawrc de
66.97"N,7.64"E 3000-0 2~:3.4ctS.4aos fOl11D'liD.j~ <2"e 500, 2 phases ct est 1100·700
al.. 2003 Variog) surface de l'océan
plsnetoniqucs centré à 300
BtndJe cr Tcmptreturcdc
66.98"N.17.95°W ls1Mdc JO 200~O 20"" Allcawncs Oscill&l..iOO5milltnMs >2"C 340·80
al.. 2007 surf~dol'odan
Bianc:hicl Vitcs.sc do l'ISOW
Taille: moyenne: d"
10 56.35"N,27.S"W McCayc:, hlandc: 10500-0 (fœlolld.$œrIOIId 1500"" Centré à 400 \050·750
silLS
1999 Oveiflow Walu)
Dëbrisglaciaircs
64.78~.29.S7·W ~troi(du (v~la8c), foramillifhc:s
S4.27~N.16.78"W Bond clef.. Danemark planclDniques,SIlC. ~bri,g!a,iaites
11 12000·0 30à50aJU 1100·900 ct SOQ..300 l1lS
54.25eN.16.83°W 2001 (Plateau de vcrre vokaniquc (vtlagc)
55.47°N.14.72"W Roclull) d'Islande. grains
db61:latitc DébIÜlIllIClaJJ"~ (v~lage), foraminifères Oétroltdu 64.7SeN,29.57"W BondcloJ.. Ol.Ilcmark plaDcloniques.S1'C. D6brilg!acilS.lRs Il 11100·1400 1470*.S00c.ns <2°C
54.27°N.16.78"W 1997 (platuude vcm: vokanlque (~!allc)
Rockall) d'LJlancic:,pun;lI
dbématite Mer de Norvl:sc
Calvo <1 oJ•• TC'tIl;JI!ra~de
13 66.97"N.7.6)"E (PlI\c'aude 15800-0 H200a.ns Aiktno,,,, llOO ... Mu...2.6"C
2002 VoriD~) lwf~dcl'ocl:an
Itludo : dl:bns gJaci~$(vtlasc-)· blande: isotopes
ItVlptratunde s18bles.dialom&:a:. S\&Ifau de l'octI,n ls.llUlde:66.S"N.19.s"W
Norvl:8 C :
"""""'.
Lslande: O'IOwde 20 MS K.dimCDtoloS'que'll. blandc: 2"C
14 No:::~~5;:g;~~S;"~;"E EuiJuson r1 1s1l:ode. Norv~e. c:bangcmcDtS de Éeoue: osci1!aUOQ1 151.1nde: 1050
2000-0 NOMge: 4à221.l1t - k y = 650·50
et 6/).S"'N, 3.7)ee 0/.. 2006 teoue Ielllpta~ daoJ le d~esà centennales r;::~~ :à~c;C ",0
Ecosse: 7 ans Nomse : dolOpes
nllXdu cowtU:ll teosse: 56.67'N. S.S3"\\' srablca Nord Aùantiquc Ëcosse:'ISOLOpes Éc.ouc: sl3blu ICmptramec dc.s cau.'\dc fODICQ Eu 00
précédente pour la carte de localisation)
Numiro lacel'V81ltde Pirlode
PedlÂae
auodl: à la Sltetnpon Rholuftoo Pfrlodlclli(s)dt'S Amplltuded~ Cbaude
Coordonnhs Autcun lemp'l!nl~ Proxlh\l.rWsét Panml!ttts iNdU:. G'adalte(cal.
artede d'~tudt temporelle "'~ntmenb '\'èaemtnb Mfdlevale
(ahDie) BP)
loc.allJatlon (a'.Bp)
ForamilÙfè:rc.s
Norvège Tcmpénrum dC'S
15 69.48"N, 18.3goE H~/ol.. 8000.1600 33 à 78 ans beDlbiques Cl isotopes Oscillations mÎlltIlaîn:s ,OC (MalaDgcnljord) cau.x.dt fond
Rabi..
foraminifères Dibris glaciaires
bC"nthiql.lts Cl
,.
68.3'"N. 29.910W JenllÏ~~:tQ{" (Nansen Fjord) GTœnland 1300·0 4l9am planClOniques. (vHilgc), glace de 32045 1220-840 œtr, ooa.ucsd'eau litboraci~, aD.lyses régiooales séd.imcolologiquts Température de jiang et af..17 66.5"N,19.07<>W 21lO2 Islande 4600·0 DjaloID~ sUlfaee de l'océan l·2°e Centré à350 Centré1850 cnÉJ:6
Oxyg6oalÎon Cl Norvoge Foruroiaifèn»
18 62.36"N,6.160E Mika;s:lel al., 5500-0 17822am température dl:s Min 2~C 325 (Sulafjord) beolhiqul:s ct SIlO eoaux de fond
Faiblespériodieilés décco.naJcs, centcnnales et ° Risebrobaklcen Mer de Norvège Il . TC'Olpc!rarurode
66.96~, 7.63 E el al., 200) (p~~~:e S0 d~ foramini lèrcs surf::u:e dc \'océ;tn
19 13800-0 15 à 27 ans millénaires (1400,1250, 2°e
1150,900, 570, 5~O, 417, 260,115,81 ans) Tnl.lupol1 du
AualY'" Osei1latio~ ccmtenna.les
2. 66.55"'N, 17.68~W Ro~~~tal., Islande 10000-0 10820 am paleomasn~bqucs sédimenl et taille: (714,238,167,104 Bn.5) 620-150 93Q.620 des groillS
lOOQ.\350, 885/840, 400· Foramirufèrt'S Tempc!raturedc
21 75°N, 14~E Sarn~; el al., Mer de Bare:tlts 14000-700 10à70am 650,505/605, 230, 145 Cl <4~C
plar.ctoaiqucs surfaoo do l'océan 92195 am Temperatwe et
50'~~8i~~W Soljgnac el al., saiinilé de swface
22 Islande 8000-2500 IODa )00 am Diook:y$tcs Oscillations 1!l1n~naites Max..5~C
48.370W 2004 de l'océan, cou\'cI1
de glace de D::It;r
CHAPITRE 1
VARIABILITY OF SEA-SURFACE TEMPERATURE AND SEA-ICE COVER IN THE FRAM STRAIT OVER THE LAST TWO MILLENNIA
Sophie Bonnd'-, Anne de VernaI 1.-, Claude Hillaire-Marcel ' , Taoufik Radi l ,
Robert F. Spielhagen2;3, Katrine Husum4 and Morten Hald4
1 Centre de recherche en géochimie isotopique et en géochronologie (GEOTOP),
Université du Québec à Montréal, Case postale 8888, Succursale Centre-Ville, Montréal, Québec, Canada, H3C 3P8. Tel: +1-514-987-4080; Fax: +1-514-987-3635
2 Academy of Sciences and Literature Mainz, Geschwister-Scholl-Str. 2, D-55131,
Mainz, Gerrnany
3 Leibniz Institute for Marine Sciences, East Coast Building, Wischhofstr. 1-3,
D-24148, Kiel, Gerrnany
4 Department of Geology, University of TroIllS0, Dramsveien 201, N-9037 Tromslll, Norway
Abstract
A sediment core located on the West Spitzbergen margin in the Fram Strait (78.92°N 6.77°E, water depth: 1497 m) was analyzed for its dinocyst content in order to reconstruct hydroclimatic variations of the last 2500 years. The relative abundance of dinocyst taxa and principal component analysis show a major transition at about 300 cal. years BP. It is characterized by the disappearance of thermophilic taxa
Spiniferites mirabilis-hyperacanthus and lmpagidinium sphaericum and the increase
of polar-subpolar taxa lmpagidinium pallidum and Pentapharsodinium daleL Sea surface temperature (SST) estimates suggest warmer conditions than present (anomaly '" +2°C) averaging at 7°C in summer until 300 cal. years BP, although cooling pulses are recorded around 1700, 1500, 1200 and 800 cal. years BP. The last 300 years were marked by a cooling trend from 7.6 to 3.s°C and sea-ice cover up to 7 months/yr. The results demonstrate that the Fram Straü area is sensitive to hydroclimatic variations, notably with respect to sea-ice and SSTs, which are linked to the relative strength of northward flow of North Atlantic waters to the East and southward outflow of cold and fresh waters from the Arctic Ocean. Based on our data, the thermal optimum recorded around 1320 cal. years BP is the only interval of the last 2500 years that provides
a
possible analogue for the modern post-AD 2000 interval, which is characterized by sea-ice free conditions.12
1. Introduction
Located North of the Greenland Sea, the Fram Strait is the major gateway
between the Arctic and North Atlantic oceans (Figure 1). It is a key area with respect
to poleward heat transport through the North Atlantic Current (NAC) to the East and freshwater fluxes from the Arctic to the North Atlantic to the West. Whereas the NAC inflow represents 35 Sv (Krauss et al., 1987), the total freshwater outflow is estimated around 160 mSv (80 mSv as ice and 65-95 mSv as liquid) according to Dickson et al. (2007). Thus, exchanges taking place in the Fram Strait play an important role in polar c1imate, sea-ice cover extent and thermohaline properties of upper water masses in the Nordic Seas. At higb latitudes of the Northern Hemisphere, numerous studies have shown instabilities in the Holocene c1imate. They include studies on Greenland ice cores (e.g., O'Brien et al., 1995; Ailey et al., 1997), speleothems (e.g., McDermott et al., 2001), tree-rings (e.g., MacDonald et al., 2000; Bennike, 2004) and marine cores (e.g., Bond et al., 1997; Campbell et al., 1998; Bianchi and McCave, 1999; Husum and Hald, 2004). In particular, sorne studies led by Hald et al. (2004,2007) and Slubowska-Woidengen et al. (2007) in the area of Svalbard show a graduai cooling from 8800 cal. years BP to the late Holocene, possibly resulting from regional decrease in the contribution of Atlantic water fluxes to polar waters. However, due to low sedimentation rates in marine environments, paleoceanographic reconstructions often lack of temporal resolution to document decadal to centennial timescale variations of the late Holocene (e.g., Hald et al., 2004).
Here, our objective is to develop a high-resolution record of ocean and c1imate variations during the late Holocene in the Fram Strait based on the analysis of core JM-06-WP-04-MCB (JM04 in the text; 78.92°N 6.77°E, water depth: 1497 m; Figure 1), which is located on the slope of the western continental margin of Svalbard, in an area characterized by relatively thick Holocene sedimentary sequence (Husum, 2006). In the present study, we report on the paleoclimate record of core JM04 based on
organic-walled dinoflagellate cysts (or dinocysts), which permit the reconstruction of sea-surface conditions, including winter and summer sea-surface temperatures (SSTs), salinities (SSSs) and sea-ice cover (de Vernal et al., 1994, 1997,2001,2005;
de Vernal and Marret, 2007). In subpolar environments, dinocysts are usually weIl preserved in sediments and distribution of their assemblages is c10sely related to hydrographical parameters, notably to the seasonal sea-ice extent.
In order to better understand the distribution of dinocyst assemblages in the Nordic Seas and Fram Strait prior to making quantitative reconstructions at the coring site, we have deve10ped a regional dataset with surface sediment samples collected during WarmPast expeditions JM-06-WP and JM-07-WP (Figure 2) (Husum, 2006,
2007). The regional dataset that comprises 94 sites North of 700
N was used for multivariate analyses with the aim to define the relationships between dinocyst assemblages and hydrographic conditions with the best possible accuracy (Figure 2).
It was combined with the North Atlantic and Arctic dinocyst database (de Vernal et al., 2(05) for the reconstructions of sea-ice cover, sea-surface temperatures and salinity using the modern analogue and artificial neural network techniques (e.g., Guiot and de Vernal, 2(07).
2. Modern oceanic setting
The surface currents in the Fram Strait are characterized by two main components: (1) the Arctic sea-ice and freshwater discharge flowing southward along the Greenland margin and forming the East Greenland Current (EGC); (2) the North Atlantic current (NAC) to the East which mixes with the East Spitsbergen Current (ESC) and forms the West Spitzbergen Current (WSC) flowing northward into the Arctic Ocean (Dickson et al., 2007; Wa1czowski et al., 2(05) (Figure 1). The WSC arises from the North Atlantic Drift (NAD) and constitutes its northernmost extension. The NAD water mass is warm and saline, becoming colder and fresher toward high latitudes, with SSSs and SSTs gradients ranging from 35.45 to 35.04 and
14 10.5°C to 3.1°C between the Greenland-Scotland Ridge (57° to 66°N) and Fram Strait (75°N) (Hansen and 0sterhus, 2000; Wa1czowski et al., 2(05). In winter, the cooling of North Atlantic waters in the Nordic Seas is accompanied by convection, thus playing a major role in the formation of the North Atlantic Deep Water (NADW) and thermohaline circulation (Hansen and 0sterhus, 2000; Rudels et al., 2005; Dickson et al., 2007; Komuro and Hasumi, 2(07). Surface waters at the location of core JM04 are principally influenced by the WSc. Studies led by Fahrbach et al. (2001) between September 1997 and August 1999 indicate a mean transport at 78°50'N of 9.5 ± 1.4 Sv northward (through the WSC) and 11.1 ± 1.7 Sv southward (through the EGC) at 79°N. The balance of northward flow takes place in the Barents Sea (e.g., Schauer et al., 2(02). The EGC carries fresher and colder waters with a total freshwater flux (ice and liquid) of roughly 160 mSv (80 mSv as ice and 65~95 mSv as freshwater) (Dickson et al., 2007; Holfort and Meincke, 2005).
At the coring site, mean modern SSTs (1930-2001) are -0.13 ± 1.27°C in February and 5.17 ± 1.62°C in August. Modern SSSs are 34.79 ± 0.12 in February and 34.31 ± 0.78 in August (NODC, 2001). The large standard deviations of temperatures and summer salinity indicate high interannual variability of sea-surface conditions in this area. It can be explained by the site location close to the Arctic Front that separates the Atlantic and Arctic water masses and corresponds to the maximum Iimit of sea-ice in winter (Figure 1). Figure 3a represents the 1953-2OQI sea-ice data (concentration greater than 50%) provided by the National Snow and Ice Data Center (NSIDC, http://nsidc.org/index.html) and historical records (concentration greater than 30%) from the Arctic Climate System Study (ACSYS, 2(03). Both data sets show large amplitude variations of seasonal coverage from one year to another, with sea-ice ranging from 0 to 6 months/yr. Since 1982; no sea-ice cover was recorded around the site, which is probably a regional consequence of the post-industrial warming (lPCC, 2007). Sea-ice variations in Fram Strait seem interrelated with surface air temperature, which also record large amplitude
variations, especially in winter (Figure 3b). These data are available at: http://www.ipcc-data.mg/index .html.
3. Material and methods
The samples analyzed were collected with a multi-corer (MC) or box corer (BC) during the expeditions of RN Jan Mayen (Husum, 2006, 2007) and the Healy
Oden Trans Arctic Expedition (HOTRAX; Darby, 2005). The multi-core JM04 is 54
cm long and was sub-sampled at 1 cm interval. Surface sediment (0-1 cm) samples from aIl other cores were sub-sampled and used to improve the reference database (Table 1).
In the upper 3 cm of core JM04, 21DPb, l37Cs measurements were performed in order to identify the depth of biological mixing and to evaluate the sediment accumulation rate. Five AMS-14C measurements on planktic foraminifera
(Neogloboquadrina pachyderma and Globigerina bulloides) allowed the
establishment of a chronology (Figure 8 and Table 2). The software Calib 5.0.2
(Stuiver et al., 2000) was used for calibration after correction for a 4OO-year atmosphere-ocean reservoir difference and normalization for a Ô13C of -25%0 PDB (MARINE04 calibration curve) (Hughen et al., 2004). Ali ages are reported as calibrated years BP (AD 1950
=
0 cal. years BP).Samples were processed using standard palynological procedure (de Vernal et al., 1996). About 5 cm3 of sediments were sieved on 106 pm and 10 pm mesh sieves to eliminate the coarse and fine fractions. The fraction between 10 and 106 pm was treated 4 times with warm Hel (10%) and 3 times with warm HF (49%) to dissolve, respectively, carbonate and silica particles. The remaining residue was mounted between slide and cover-slide in glycerin gel for observation in transmitted light rnicroscopy at 400x magnification. A minimum of 250 dinocyst specimens were counted and identified in each sample. Pollen grains, spores and organic linings of benthic foraminiferawere also counted. Only dinocyst results are presented here and
16 the detailed palynological results are reported in Bonnet (2009). Dinocyst taxa were identified using the nomenclature in Rochon et al. (l999) and Head et al. (2001). Concentration of palynomorphs was calculated from the marker-grain method (Matthews, 1969), which provides results with an accuracy of about 10% for a 0.95 confidence interval (de Vernal et a1., 1987).
Modem hydrographic data at surface sample sites were compiled from databases of NODC (2001) and NSIDC (2003). Compilations of SSTs and SSSs were made from measurements performed between AD 1930-2001 within a radius of 30 nautical miles around sites. Sea-ice data were compiled for the interval between 1953 and 2001 within a grid of 1 degree by 1 degree of latitude and longitude. Sea-ice is expressed as the number of months per year with a concentration greater than 50%. Data from ACSYS are interpreted from ice edge position, i.e., they are defined by a set of geographic coordinates, which are compiled using polylines and polygons in GIS files. Data from the period 1553-2002 are assembled in ACSYS historical ice chart archives provided by the Norwegian Polar Institute (ACSYS, 2003). For periods with scattered data, interpolations were applied for months with no available data. It
concerns mainly wintertime prior to 1750. Until 1966, data were derived from aircraft observations, ship logbooks, diaries, newspaper reports and maps. From 1966 to 2002, data constitute a combination of satellite imagery and in situ observations.
Principal component analysis (PCA) and canonical correspondence analysis (CCA) were performed with the software XLSTAT (Addinsoft, 2008). CCA was performed on the 94 surface samples of the Nordic Seas, between 700
N and 800
N and 200
W to 200
E (Figure 2) and PCA was applied on core JM04 assemblages.
Reconstructions of past sea-surface conditions were made using two different approaches for comparison and to insure the robustness of estimates. We used the modem analogue technique (MAT), which is based on the similarity degree between fossil and modem spectra and assumes fossil assemblages developed in environmental conditions that are similar to their modem analogues (Guiot, 1990).
We also used the artificial neural network (ANN) technique, which relies on calibration between hydrographical parameters and assemblages (cf. Malmgren and Nordlund, 1997). Among transfer function methods currently used 10
paleoceanography , MAT and ANN perform the best although both have caveats (e .g., Kucera et al., 2005; Guiot and de Vernal, 2007).
Reconstructions from MAT were made using the Northern Hemisphere reference database that includes 1189 sites in addition to the 19 surface samples from the Fram Strait analyzed here (Figure 4). We followed the procedures described by de Vernal et al. (2005) and we used a set of ten analogues for estimating past sea-surface conditions. Reconstructions from ANN were based on two different calibration data sets following the procedures described by Peyron and de Vernal (2001). The geographical domain of the calibration data set is important since it may introduce a bias in reconstructions with equivalent error of prediction as shown by Peyron and de Vernal (2001). One calibration data set comprises ail sites from the North Atlantic and Arctic oceans, including adjacent seas (n
=
735). The other calibration data set was constrained on the basis of the geographical domain deterrnined from the location of analogues in core JM04 (n=
437; Figure 4). MAT and ANN were performed using the R software, available at this website: http://www.r-project.org/, with scripts adapted by Guiot from PPPbase (Guiot and Goeury, 1996; http://www.imep-cnrs.com/pages/3pbase.htm).Quantitative reconstructions of winter and summer SSTs, summer SSSs and seasonal sea-ice coyer (> 50%) duration in months/year were perforrned. Validation tests of MAT and ANN with the two calibration data sets were made in order to evaluate the respective performance of each approach and to caJculate the error of prediction (Table 3). The reliability of approaches is given by the coefficient of correlation (R2) between observed and estimated values, whereas the accuracy is
provided by the root mean square error (RMSE) that corresponds to the standard deviation of the difference between observed and estimated vaJues. The root mean
18 square error of prediction (RMSEP) is calculated by dividing the database in calibration (5/6) and verification data sets (1/6) (Guiot and de Vernal, 2007). The use of verification data set, which represents 1/6 of the database for the RMSEP calculations, avoids the problem of spatial autocorrelation (Telford, 2006). On the whole, ail approaches provide good results, the best ones being obtained with MAT (Table 3).
4. Results
4 .J. Dinocyst assemblages in surface sediments from the Nordic Seas
Surface sediment sampIes collected in 2006 and 2007 in the Fram Strait contain abundant dinocysts, with concentrations ranging from 195 cysts/cm3 along the Greenland margins to 28 000 cysts/cm~ in eastern Fram Strait (Figure 5). The dinocyst assemblages are dominated by the ubiquitous taxa Operculodinium
centrocarpum and Nematosphaeropsis labyrinthus, in addition to Jslandinium
minutum and Brigantedinium spp., which often dominate in Arctic seas (e.g., Rochon
et al., 1999; de Vernal et al., 2001; Matthiessen, 1995). Accompanying taxa include
Jmpagidinium pallidum, Spiniferites elongatus, Spiniferites ramosus and
Pentapharsodinium dalei (Figure 5).
J. minutum and Brigantedinium spp. occur principally along the eastern
Greenland margin as documented by Rochon et al. (1999) (Figure 5). J. pallidum is mostly abundant in the open ocean settings and P. dalel is common in most samples.
S. ramosus and S. elongatus are frequent in low numbers as accompanying taxa.
CCA analyses were performed on the assemblages from the 94 sites of the Nordic Seas (Figure 6). Axis 1 (CCA 1) represents 77.27% of the total variance. It is defined by negative scores of J. minutum and Brigantedinium spp., which belong to Protoperidiniales, and are generally associated with heterotrophic productivity. Axis 1 is also defined by positive scores of ail other taxa, which can be mostly associated with phototrophic behavior (e.g., Taylor and PoIlingher, 1987). Axis 1 correlates
negatively with Sea-ICe cover (R2
=
-0.989) and positively with August SSTs (R2=
0.939) and SSSs (R2=
0.909) (Figure 6). The geographical distribution of CCA axis 1 ill ustrates a strong relationship between dinocyst assemblages and sea-ice cover, positive values being associated with ice-free areas that are predominantly influenced by the North Atlantic Current. Conversely, negative values of CCA axis 1 correspond to the sites characterized by extensive sea-ice cover along the margins of the eastern Greenland coast marked by outflow of Arctic waters (Figure 7). CCA axis 2 explains 12.81 % of the variance. It shows an opposition between /. pallidum and N.labyrinthus on one side, and the other taxa on the other side (Figure 6). Geographical
distribution of axis 2 scores shows that the most negative values occur in the central part of the Nordic Seas, whereas positive values correspond to neritic regions (Figure 7).
4.2. Core JM04 4.2./. Chronology
The age vs. depth relationship in the core has been established from AMS_ 14C measurements on planktonic foraminiferal populations and 210pb measurements in core-top sediments (Table 2, Figure 8). A first order estimate of sedimentation rates has been obtained from a linear regression using the calibrated 14C_ages between Il.5 and 48.5 cm. It indicates a mean sedimentation rate of about 18 cm/kyr and suggests a core-bottom age of 2500 years. However, the spreading of datum points around the regression line (R2 = 0.99) points to relatively variable sedimentation rates. This is further indicated by core-top 210Pb and 137Cs data.
Nearly constant 210Pb acti vities down to approximately 3 cm lead to set a mixed-layer boundary at this depth, but with incomplete mixing through bioturbation, as suggested by 137Cs activities peaking sorne 1.5 cm below core top (Figure 8a). Below 3 cm and down to 8 cm, In210Pb-excesses show a decreasing linear trend leading to estimate a mean sedimentation rate of 94 cm/kyr. Extrapolating this rate up
20 to the core top, the age of the 3 cm-thick mixed layer can be estimated using the equation below (cf. Berger and Johnson, 1978):
T = II À x In[l +(Àx 1S)]
where À is the decay constant, x is the mixed-Iayer thickness, S the sedimentation rate and T, the radiometric age of the mixed layer. A "T' value of about 30 years is obtained here.
A significant decline in the 21OPb-excess (from 12 to 1.3 dpm/g) is seen between mid-sample depths of 7.5 and 8.5 cm, suggesting a major drop in sedimentation rate. A poorly constrained value of about 18 cm/kyr can be calculated, contrasting sharply with the value estimated for the overlying sediment (94 cm/kyr). Nonetheless, the calibrated 14C_age of 213.5 ± 40.5 years yielded by foraminifers at a depth of Il.5 cm and the mean sedimentation rate estimated above for the 11.5 and 48.5 cm section fit with this scenario, as illustrated in Figure 8b.
The cause of a sharp rise in the sedimentation rate dating from approximately a century ago is unknown but we observe changes in grain size, which indicate variations in detrital inputs (Figure 8c). The upper part of the sequence is marked by an increased proportion of coarse sand (fraction >106 ,um) and probably corresponds to higher sedimentary supply, notably through ice rafting. The significant decrease in dinocyst concentrations in the upper few centimeters of the core could also be explained by higher sedimentation rates and dilution with higher sedimentary inputs (cf. Figure 9b).
The final age model used for this core is based on a mixed layer age around 30 years, followed by a 9O-year interval with high sedimentation rate, then ages interpolated from 14C-data assuming unchanged reservoir correction of 400 years for each datum before calibration. It is worth mentioning that assuming a constant 3 cm thick rnixed layer, bioturbation mixing would limit the temporal resolution to about 30 years near core top to approximately 150 years below.
4.2.2. Dinocyst record
Dinocysts are abundant in ail sampies from core JM04 with concentrations ranging from 4000 to 38 000 cysts/cm3 • This corresponds to fluxes ranging from 376
to 684 cysts/cm2/yr (Figure 9b). Such values are characteristic of high productivity continental margin environments (e.g., de Vernal et al., 1994).
Dinocyst assemblages of core JM04 (Figure 9) are dominated by O.
centrocarpum (60-90%), with abundant 1. minutum (0.4-22%), N. labyrinthus (1
13%) and Brigantedinium spp. (0.1-11%). Accompanying taxa include S. elongatus,
S. ramosus, P. dalei and J. pallidum. In the lower part of the sequence, assemblages
also include thermophilic taxa, which occur rarely in surface sediment sampi es of the Nordic Seas. These taxa are Spiniferites mirabilis-hyperacanthus, Selenopemphix
quanta and Jmpagidinium sphaericum (Figures 9 and Il).
We performed a PCA on taxa percentages (Figure 10). The first principal component (PC 1) explains 27.65% of the total variance and shows an opposition between J. pallidum, S. ramosus, P. dalei and 1. minutum on one side and 1.
sphaericum, S. mirabilis-hyperacanthus and O. centrocarpum on the other side. Thus,
PC 1 seems to reflect an opposition between polar-subpolar taxa and more thermophilic ones. The second principal component (PC 2) represents 16.48% of the variance and shows an opposition between J. minutum, Brigantedinium spp. and S.
quanta on one side and most other taxa on the other side. PC 2 therefore seems to be
determined by the trophic behavior of taxa (i.e. heterotrophic vs. phototrophic). On the basis of taxa percentages and PCA, we can distinguish two assemblage zones (Figures 9-10). The lower zone, spanning 2500 to 300 cal. years BP is characterized by positive values of PC 1, with the occurrence of S. mirabilis
hyperacanthus, S. quanta, and J. sphaericum. It suggests relatively mild sea-surface
conditions. The upper zone, covering from 300 cal. years BP to present, is marked by negative PC 1, the absence or rarity of thermophilic taxa S. mirabilis-hyperacanthus,
22 is also characterized by increased percentages of /. minutum. On the whole, the upper zone reflects colder conditions than the lower one.
4.2 3. Quantitative reconstructions of sea-surface conditions
Sea-surface conditions were reconstructed quantitatively from dinocyst assemblages using MAT and ANN as briefly described in the material and methods section (Figure 12). Validation tests suggest that MAT provides the most accurate results (Table 3), but ANN was nonetheless used as a means to verify the robustness of the estimates and trends. It is worth to mention the RMSEP is lower than the RMSE for most parameters using the MAT. This demonstrates that spatial autocorrelation does not bias the MAT results (Telford, 2006).
The MAT applied to assemblages of core lM04 shows that most modem analogues are located in the Nordic Seas and northem North Atlantic (Figure 4b). It
also shows that good analogues with high degree of similarity exist for ail assemblages of core JM04, with distance considerably below the threshold value for poor analogue situation (Table 4). Therefore, given the high dinocyst concentrations in samples suggesting a high regional production, the accuracy of the approach as defined from validation exercises and the degree of similarity of selected analogues, MAT results meet ail reliability criteria (de Vernal et al., 2005; Kucera et al., 2005; Guiot and de Vernal, 2(07).
Results from ANN are generally consistent with thoseobtained from MAT, especially for summer and winter temperatures. Time series from ANN, however, show a lesser variability and amplitude of changes than those from MAT, which suggests a smoothing effect from calibrations. Nevertheless, the SST curves are nearly identical and show oscillations between -1°C and 5.s°C in winter and between 2.4°C and 1O.0°C in summer. From 2500 to 300 cal. years BP, SSTs were relatively high with mean values of about 2°C and 7°C in winter and summer, respectively. Warm phases are recorded around 1900, 1600, 1320, 1120 and 325 cal. years BP,
with an optimum centered at 1320 cal. years BP. After 300 cal. years BP, SSTs were significantly lower with mean values of about O°C and 3.5-4°C in winter and summer, respecti vely .
Salinity reconstructions show discrepancies, not only between MAT and ANN, but mostly between ANN reconstructions based on the two different calibration databases. By applying the North Atlantic-Arctic data base that includes a wide range of salinity (from 20 to 36), the reconstructed summer salinity with ANN is relatively low (mean of 33). Conversely, by using the North Atlantic database as delimitated by the distribution of analogues in core JM04 (Figure 4b), the reconstructed salinity with ANN is relatively high (mean of 34). The MAT estimates average around 33.5 and vary between the maximum and minimum values provided by ANN estimates. It thus seems the ANN estimates are biased toward low and high salinity depending upon the calibration database. Salinity reconstructions from MAT seem more reliable and suggest high salinity variability, ranging from 30.5 to 35. Of interest here, are the low salinity peaks recorded around 2240,640 cal. years BP and at the top of the sequence (280 cal. years BP). They correspond to cool phases and suggest important outflow of low saline Arctic water. The maximum salinity recorded at about 1320 cal. years BP corresponds to the thermal optimum and underlines maximum northward flow of warm and saline North Atlantic Current in the eastern Fram Strait.
Sea-ice estimates based on MAT and the two ANN calibrations also show discrepancies. In general, estimates from MAT yield higher sea-ice values than ANN, and ANN calibration using the North Atlantic data alone yields the lowest values. Here again, ANN reconstructions appear biased depending on the calibration database chosen. Given the lower sea ice RMSEP from MAT (Table 3), we are more confident with MAT results. Moreover, the MAT estimates of sea-ice cover during the last centuries are in agreement with historical data (see Figure 3), in contrary to ANN estimates. In any case, despite sorne uncertainties, there are consistent features in the sea-ice record, notably the existence of ice-free conditions du ring the thermal
24
optimum centered at about 1320 cal. years BP and the increased trend of sea-ice cover after 300 cal. years BP, with maximum values up to 7 months/yrs in a sub recent interval. Moreover, aIl approaches lead to reconstructions showing the spreading of sea-ice cover during the cooling pulses recorded around 1700, 1500 and centered to 800 cal. years BP.
5. Discussion
Reconstructions of sea-surface conditions were performed in core JM04 that spans the last 2500 years. According to the age model based on 210Pb and 14C
measurements, sedimentation rates average around 18 cm/kyr throughout most of the sequence and reach up to 94 cm/kyr in the upper part of the core (0-8 cm), representing the last century. Taking into account mixing by bioturbation over 3 cm thick layers, the time resolution achieved with analyses performed at one cm interval is about 160 years for the interval spanning 2500 to 100 cal. years BP. Such a chronological resolution is not as high as expected, but it nevertheless remains the best one available for late Holocene marine records in the northern part of the Nordic Seas. The paleoceanographical time series of core JM04 we established, based on dinocyst assemblages, is also unique since it allows documenting sea-surface salinity and sea-ice cover in addition to sea-surface temperature.
Beyond uncertainties inherent to the application of transfer functions (see sections 3 and 4.2.3 and Table 3) and despite the smoothing effect of bioturbation, the results demonstrate large amplitude variations of temperatures, from 2 to lOoe in summer, and from -1 to 5.5°e in winter. They also show large amplitude changes in sea-ice, from ice-free conditions up to 7 months/yr, and summer salinity variations from 30.7 to 34.9. Clearly, the area of the Fram Strait is extremely sensitive to climate and ocean changes as also shown from the historical sea-ice records (Figure 3) and hydrographie data (NODe, 2001).
Numerous studies in high latitudes of the North Atlantic Ocean and surrounding lands led to document climate changes during the Holocene with amplitude ranging from 1 to 3°C (e.g., Bendle and Rosell-Melé, 2007; Slubowska-Woldengen et al., 2007; Hald et al., 2004, 2007; Rousse et al., 2006; Eiriksson et al., 2006; Solignac et al., 2004; Husum and Hald, 2004). At the scale of the last two millennia, most data come from Scandinavia, Greenland, Svalbard and Iceland, and there are a few records available from the marine realm (e.g., compilation in IPCC, 2007). In most of records, the largest climate change is associatedwith the transition from the Medieval Warm Period (MWP) to Little Ice Age (LIA). For example, data from the Vli1ring Plateau suggest a cooling of "'2°C at 6OO-S00 cal. years BP based on stable isotopes and planktic foraminifers (Andersson et al., 2(03). As another example, alkenone and diatom data from the North Icelandic Basin area permitted to reconstruct a cooling of about 1-2°C around 3S0 cal. years (cf. Bendle and Rosell-Melé, 2007; Jiang et al., 2002). Among the terrestrial records, those from Scandinavia and Ireland suggest that the LIA cooling was 2°C in amplitude and began around 800 cal. years BP (Seppa et
al., 2002; Nesje et al., 2001; Karlén and Kuylenstierna, 1996). As illustrated from the
examples above, there are many proxy data documenting climate changes related to the transition from the MWP to the LIA, but the amplitude and timing of the LIA cooling remains equivocal. The discrepancies from one record to another may reflect regionalism in the climate change. They may also result from uncertainties in age models and from different sensitivity of the proxies. The reconstructions from core JM04 illustrate higher amplitudes of temperature changes (up to SOC) than what is reported in the literature, which can be related to higher sensitivity of the dinocyst proxy as compared to others in a subpolar-polar context (e.g., Solignac, 2004; de Vernal et al., 200S, 2006) or to the location of the coring site close to the Arctic Front, probably to both.
In the core JM04, dinocyst assemblages led to identify a thermal optimum dated from 14S0 to 1300 cal. years BP. This optimum is marked by sea-ice free conditions,
26
SSTs reaching 5°C in winter and 10°C in summer and salinity slightly above the modem value. It is the only interval of the JM04 record showing conditions as warm as the ones observed since the late eighties (Figure 3). The 1450-1250 cal. years BP optimum corresponds probably to maximum strength of the NAC, which resulted in a northward shift of the Arctic Front. At the scale the northern North Atlantic region, this interval is not identified as a thermal optimum. On the contrary, it rather corresponds to a cooling in the Rockall and V0ring Plateau areas (Bond et al., 1997; Andersson et al., 2003). If we assume the chronology is correct, the discrepancies between the Fram Strait record and those of the Rockall and V0ring Plateau could reflect regionalism in the strength and characteristics of the eastern and western branches of the North Atlantic CUITent in the northern North Atlantic.
The record of sea-surface conditions from core JM04 indicates warmer than modem winter SSTs during the last 2500 years. The only exception is the interval spanning from 250 to 50 years BP, which is characterized by particularly low temperatures both in winter and summer. This interval illustrates a major change in dinocyst assemblages with the disappearance of Selenopemphix quanta and
Spiniferites mirabilis-hyperacanthus. It also corresponds to an interval of abundant
ice-rafted debris. A cold event dated at about 350-300 cal. years BP has been recorded in a few sequences, notably North of Iceland (Jiang et al., 2002; Bendle et al., 2007), off eastern Greenland (Jennings et al., 1996) and along the western Norwegian coast (Mikalsen et al., 2001). This event is commonly associated with the latest phase of the LIA. Although apparently younger, the drastic cooling recorded in core JM04 is probably correlative taking into account the chronological uncertainties.
Beyond temperature and sea-ice fluctuations, our reconstructions point out two major low salinity events, down to 31, at about 2340 and 700 cal. years BP. These events indicate dilution with freshwater outflow from the Arctic. It is worth mentioning that the freshwater event dated between 850 and 550 cal. years BP corresponds to the onset of the LIA in many marine and terrestrial paleoclimate
records of the circum Atlantic regIOn (Nesje et al., 2001; Seppa et al., 2002; Andersson et al., 2003; Eriksson et al., 2006; Rousse et al., 2006). This supports the hypothesis of thermohaline circulation weakening as a cause of the LIA.
6. Conclusion
Dinocyst assemblages of surface sediment samples in the Fram Strait and Nordic Seas show a geographical distribution c10sely related to the sea-ice cover extent in addition to sea-surface temperature and salinity. It relates to the main path of surface circulation, the EOC exporting fresh and cold water from the Arctic to the West and the WSC bringing water masses warmer and saltier from the North Atlantic to the East. Thus, in the context of the Fram Strait, dinocysts are a sui table proxy for paleoceanographical conditions, especially since they are weil preserved and form assemblages characterized by relatively high diversity of species. The analyses of core JM04 in the eastem Fram Strait show that important changes of sea-surface conditions occurred during the last 2500 years. In general, the late Holocene is characterized by SSTs warmer than present, but centennial oscillations of winter and summer temperatures and sea-ice cover indicate the limit of the Arctic Front remained close to the coring site throughout most of the last two millennia. From 1450 to 1300 cal. years BP, particular warm (up to 5.5°C in summer) and saline (> 34 in summer) water masses characterized the area together with year-round ice-free conditions. This corresponds to the only interval during which the Arctic Front shifted significantly to the north in Fram Strait due to poleward penetration of warm and saline North Atlantic Waters at the surface before subducting into the Arctic Ocean: In contrary, from 250 cal. years BP to the upper part of the sequence, particularly harsh conditions are recorded with sea-ice cover reaching up to 7 months/yr. Such a cooling event might constitute the regional signature of the LIA, but would correspond to its later phase. Beyond these paleotemperature peaks and centennial oscillations of SSTs, the record shows large amplitude variations of